


63SATS Cybertech Limited
Securing the digital futureCybersecurity without compromise
IPO Review and Rating
Speculative
Overall Recommendation
63SATS is considerably more interesting operationally than its historical numbers initially suggest. The company has gone from virtually no operating business in FY24, to INR 2.4 Cr revenue in FY25, to INR 87.2 Cr in FY26. Losses have narrowed sharply, leverage is negligible, the company has nearly INR 300 Cr of equity and it is positioned in one of India's fastest-growing technology categories. The market is paying approximately INR 2,629 Cr for INR 87 Cr of FY26 revenue, which is ~30x sales, despite negative EBITDA and cash flow. It also represents more than twice the valuation established only months earlier
PARAMETER
WEIGHT
SCORE
KEY FACTORS
Financial Performance
25.0%
2.4/5
Extraordinary revenue scaling and a near debt-free balance sheet are positives, but core EBITDA and ROE remains negative
Show more
Detailed Analysis
Revenue exploded from INR 2.4 Cr in FY25 to INR 87.2 Cr in FY26, representing genuine commercialisation after the cybersecurity pivot
Core EBITDA remained negative ~INR 11.9 Cr, implying ~(13.6%) core EBITDA margin. Losses have narrowed substantially but operating breakeven is not yet demonstrated
PAT loss narrowed 68.7% to INR 5.1 Cr, with loss margin improving dramatically to ~5.8%. Still loss-making, but FY26 represents meaningful progress
FY26 equity reached INR 297.5 Cr against only ~INR 2.6 Cr borrowings, resulting in negligible ~0.1x leverage and substantial liquidity
FY26 ROE remained negative at (4.3%), reflecting continued losses despite the large new equity base
Industry
25.0%
3.8/5
Cybersecurity offers exceptional structural demand, regulatory support and penetration runway, but technological disruption and intense global competition remain significant
Show more
Detailed Analysis
India's cybersecurity market is estimated to grow at around 19.3% CAGR through 2030, supported by rapidly increasing digital infrastructure and cyber incidents
Indian enterprise, consumer and AI cybersecurity remain structurally early in penetration, giving significant multi-year growth runway
Competition is intense from global cybersecurity OEMs, domestic security firms, IT-services players and specialist startups
DPDP, CERT-In requirements and cybersecurity regulation structurally increase demand, although compliance and government procurement remain demanding
Cybersecurity is inherently global and India's engineering talent creates export potential, although 63SATS remains predominantly India-focused today
Management
25.0%
3.5/5
Strong specialist leadership and clean audit findings support management quality, although the short execution history and allocation of fresh capital outside core operations warrant monitoring
Show more
Detailed Analysis
63 moons provides technology-sector backing, while senior leadership now includes experienced cybersecurity, financial-markets and national-security professionals
Governance has been strengthened through independent appointments, although independence was still relatively limited at FY26 year-end and the board is undergoing rapid evolution
FY25/FY26 auditors issued clean opinions; no material litigation, fraud, wilful default or major statutory-dues issue is disclosed
Valuation Metrics
25.0%
1.3/5
63SATS deserves a growth premium, but ~30x sales and >2x its recent institutional valuation already discount extremely aggressive execution
Show more
Detailed Analysis
Even after adjusting for substantial net liquidity, EV/Sales remains near 28x, leaving a very large premium to listed cybersecurity peers
~30x sales is extremely expensive compared with peers like TAC Infosec at ~15.3x, eMudhra ~6.0x and Quick Heal ~3.0x
8.8x book is demanding while ROE remains negative, although the large net-cash balance provides some downside support
TOTAL
100%
2.8/5
Weighted Composite Score
Per Share Price
₹30.0
As of 24 Oct 2026
Lot Size
1,000.0 Shares
Minimum Investment
₹30,000.0 / 1,000 shares
Market Cap. (₹ Cr)
Revenue FY’26
PAT FY’26
Face Value
₹ 1.0Lot Size
1,000.0 sharesPAT FY’26
₹ -5.0 CrPAT Margin (%)
-5.8 %YoY Growth
3,500.0 %ROE (FY’26)
-4.3 %ROCE (FY’26)
-1.5 %Price to Book Value ratio
8.8xDebt/Equity (FY’26)
0.0xMerchant banker appointed
❌ NoCompany Website
63sats.comDisclaimer: Unlisted shares are unregulated & illiquid. This is NOT investment advice. Please do your own due diligence before investing.
Minimum Investment
₹30,000.0 / 1,000 sharesShares Lot 1000 X 1
Investment amount
₹30,000.0
Overview
Business
Business Model
Geographical Presence
Sales Channel
Financial Highlights
Income Statement
Revenue growth with EBITDA and PAT margins
| Financial Metric | FY 2025 | FY 2026 |
|---|---|---|
| Revenue (₹ Cr) | 2.4 | 87.2 |
| Growth (%) | 0.0% | 3500.0% |
| EBITDA (₹ Cr) | -15.2 | -3.9 |
| EBITDA Margin (%) | -633.2% | -4.4% |
| PAT (₹ Cr) | -16.1 | -5.0 |
| PAT Margin (%) | -670.2% | -5.8% |
OBSERVATIONS & INSIGHTS
FY26 revenue increased more than thirty-six times from FY25
The EBITDA loss narrowed from INR 15.2 Cr to INR 3.9 Cr as revenue scaled, but the company had not reached operating breakeven
Other income of INR 8.0 Cr was material and exceeded the absolute PBT loss
PAT loss narrowed to INR 5.0 Cr. The improvement is directionally positive but does not establish sustainable profitability or cash generation
Balance Sheet
| Financial Metric | FY 2025 | FY 2026 |
|---|---|---|
| EQUITY & LIABILITIES | ₹ 9.5 Cr | ₹ 311.2 Cr |
| Net Worth | ₹ -3.5 Cr | ₹ 297.5 Cr |
| Share Capital | ₹ 6.0 Cr | ₹ 101.1 Cr |
| Reserves & Surplus | ₹ -9.5 Cr | ₹ 196.4 Cr |
| Total Liabilities | ₹ 13.0 Cr | ₹ 13.7 Cr |
| Current Liabilities | ₹ 2.4 Cr | ₹ 9.3 Cr |
| Borrowings | ₹ 0.0 Cr | ₹ 0.0 Cr |
| Trade Payables | ₹ 1.0 Cr | ₹ 4.5 Cr |
| Other Current Liabilities | ₹ 1.4 Cr | ₹ 4.8 Cr |
| Non-Current Liabilities | ₹ 10.6 Cr | ₹ 4.4 Cr |
| Borrowings | ₹ 10.1 Cr | ₹ 2.6 Cr |
| Other Non-Current Liabilities | ₹ 0.5 Cr | ₹ 1.8 Cr |
| ASSETS | ₹ 9.4 Cr | ₹ 311.1 Cr |
| Current Assets | ₹ 8.8 Cr | ₹ 275.8 Cr |
| Trade Receivables | ₹ 0.4 Cr | ₹ 58.2 Cr |
| Inventory | ₹ 0.0 Cr | ₹ 0.0 Cr |
| Cash & Cash Equivalents | ₹ 1.1 Cr | ₹ 33.3 Cr |
| Other Current Assets | ₹ 7.3 Cr | ₹ 184.3 Cr |
| Non-Current Assets | ₹ 0.6 Cr | ₹ 35.3 Cr |
| Fixed Assets | ₹ 0.5 Cr | ₹ 32.1 Cr |
| Other Non-Current Assets | ₹ 0.1 Cr | ₹ 3.2 Cr |
OBSERVATIONS & INSIGHTS
Shareholders’ wealth moved from negative INR 3.5 Cr to positive INR 297.5 Cr because capital was raised and securities premium increased
Paid-up share capital rose to INR 101.1 Cr after preferential allotments and conversion of 6,000 ZOFCDs into 60.0 crore shares
Closing borrowings were only INR 2.6 Cr, representing the liability component of remaining convertible instruments rather than conventional bank leverage
Cash reached INR 33.3 Cr, while other current assets included INR 86.9 Cr of investments, INR 44.4 Cr of bank deposits and INR 40.0 Cr of loans
Trade receivables of INR 58.2 Cr were the largest operating asset and represented 18.7% of total assets and 66.8% of revenue
Cash Flow
| Financial Metric | FY 2025 | FY 2026 |
|---|---|---|
CFO (₹ Cr) Cash generated from core business operations. | -16.0 Cr | -73.6 Cr |
CFI (₹ Cr) Cash used for investments and long-term assets. | -2.9 Cr | -191.3 Cr |
CFF (₹ Cr) Cash flow related to funding and borrowings. | +19.9 Cr | +297.2 Cr |
Working Capital
| Efficiency Metric | FY 2023 | FY 2024 | FY 2025 |
|---|---|---|---|
Debtor Days Average number of days taken to collect customer payments. | - | - | - |
Creditor Days Average time taken to pay suppliers and vendors. | - | - | - |
Inventory Days Average number of days inventory remains unsold. | - | - | - |
CCC (Cash Conversion Cycle) (Debtor Days + Inventory Days - Creditor Days) | - | - | - |
Financial Ratios
Measures the company’s leverage relative to shareholder equity.
OBSERVATIONS & INSIGHTS
FY26 ROE remained negative because the company reported a loss while the capital raise materially increased average equity
Financial leverage is low after conversion and equity raising. Low debt does not remove business-model, fund-deployment or dilution risk
The FY26 ratio rose to 29.7x because unutilised funds were held in liquid assets
Return on assets improved from the FY25 loss but remained negative
The large capital deploymeant during FY26 also makes averageasset returns volatile
Industry Overview
Industry Drivers
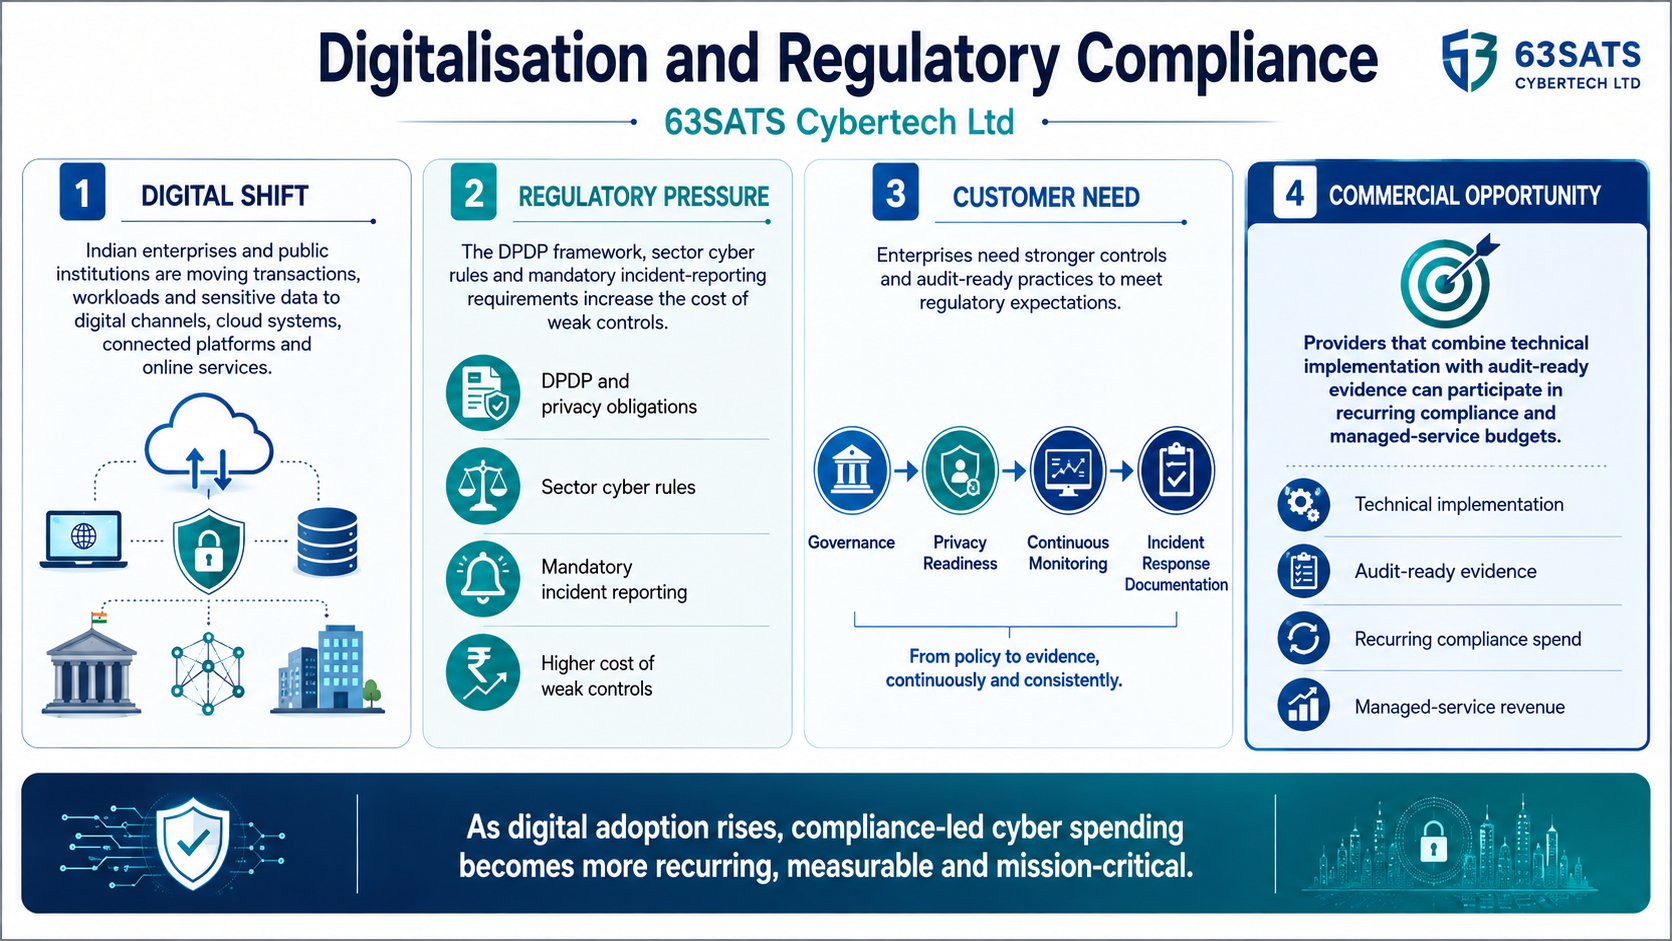
Digitalisation and regulatory compliance
Indian enterprises and public institutions are moving more transactions, workloads and sensitive data to digital channels
The DPDP framework, sector cyber rules and mandatory incident-reporting requirements increase the cost of weak controls and create demand for governance, privacy readiness, continuous monitoring and documented response
Providers that combine technical implementation with audit-ready evidence can participate in recurring compliance and managed-service budgets
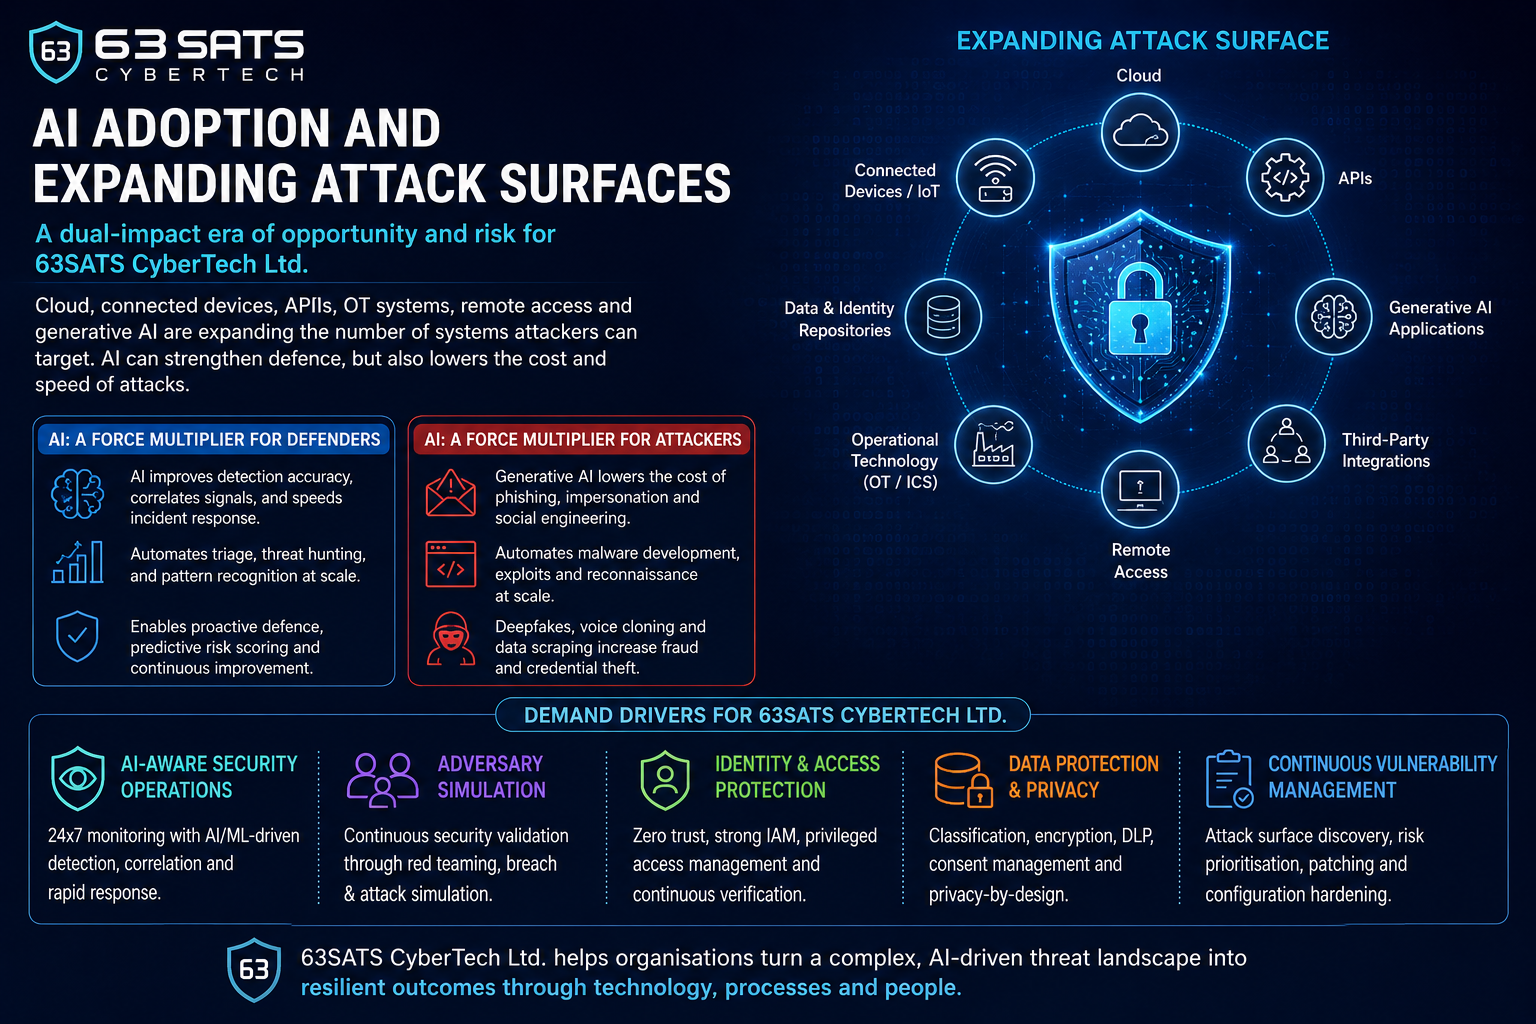
AI adoption and expanding attack surfaces
Cloud migration, connected devices, APIs, operational technology, remote access and generative AI broaden the number of systems that attackers can target
AI can improve detection and response, but also lowers the cost of phishing, impersonation, malware development and automated reconnaissance
This environment supports demand for AI-aware security operations, adversary simulation, identity protection, data controls and continuous vulnerability management
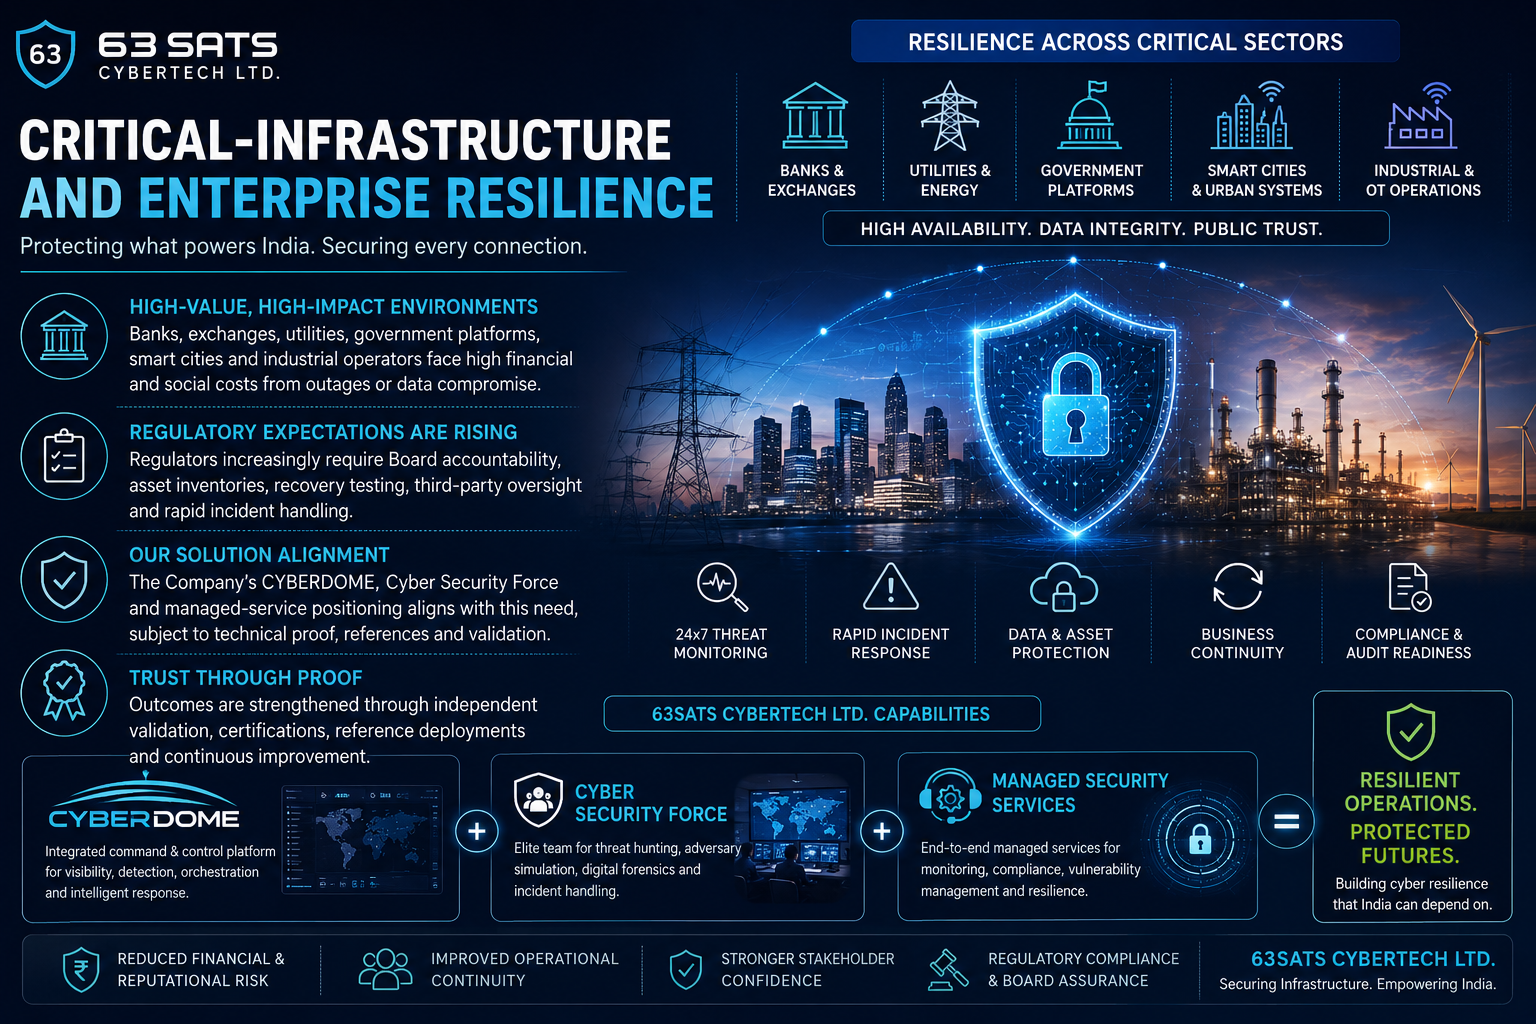
Critical-infrastructure and enterprise resilience
Banks, exchanges, utilities, government platforms, smart cities and industrial operators face high financial and social costs from outages or data compromise
Regulators increasingly require Board accountability, asset inventories, recovery testing, third-party oversight and rapid incident handling
The company’s CYBERDOME, Cyber Security Force and managed-service positioning aligns with this need, subject to technical proof, references and independent validation
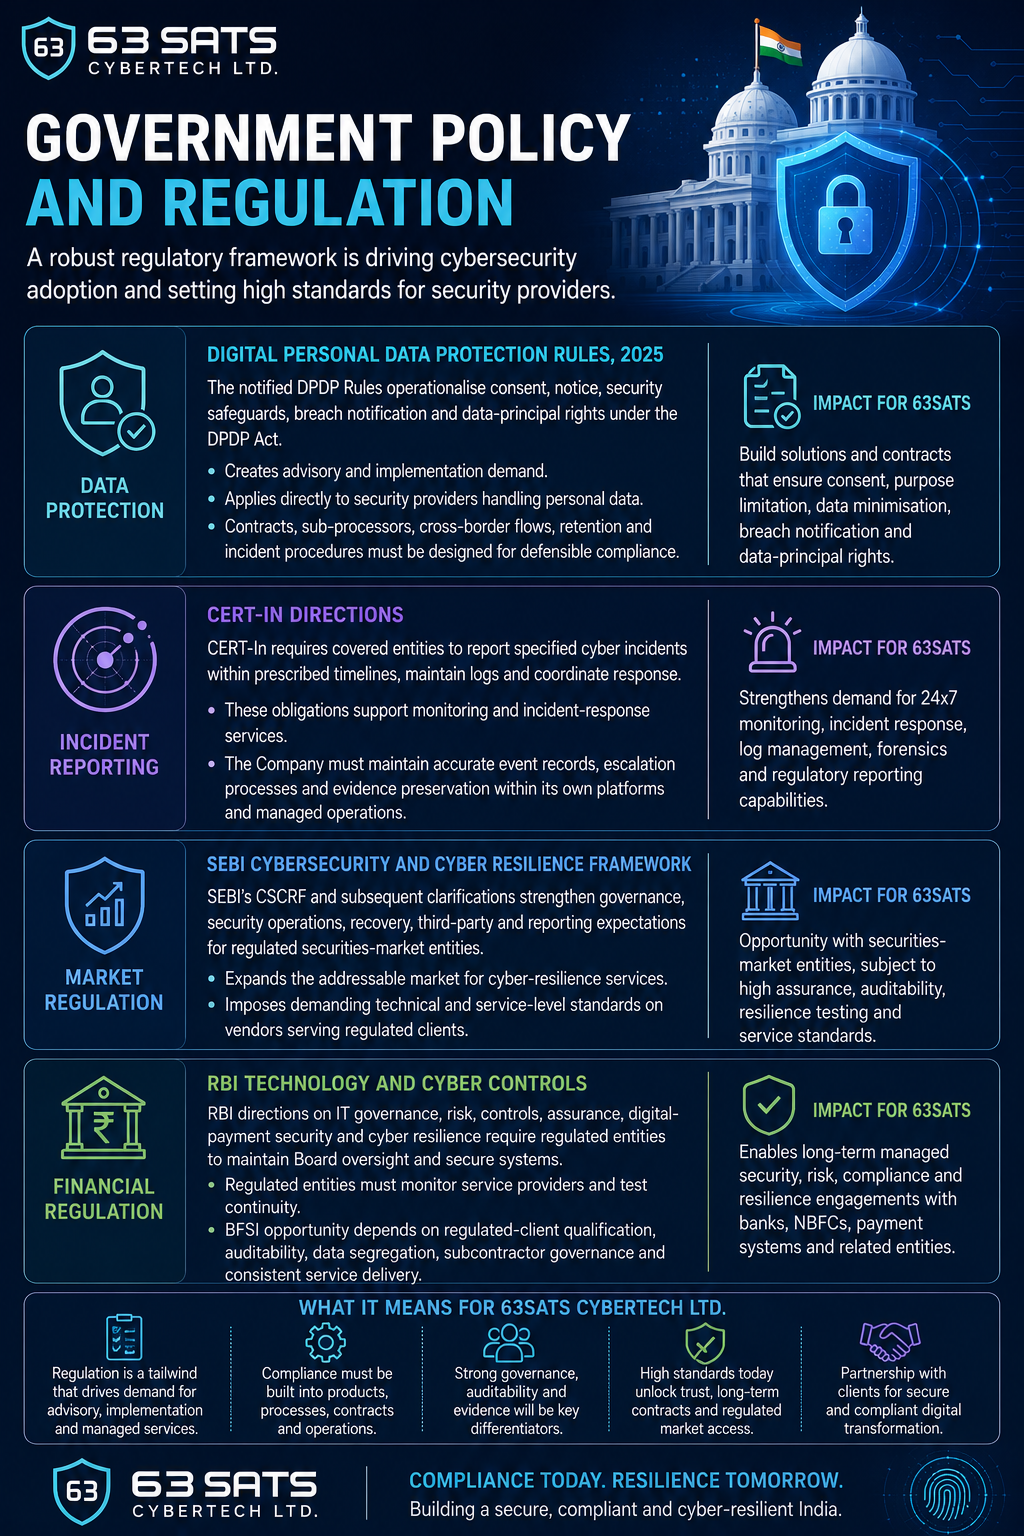
Government Policy Support
Digital Personal Data Protection Rules, 2025: The notified DPDP Rules operationalise consent, notice, security safeguards, breach notification and data-principal rights under the DPDP Act
This creates advisory and implementation demand but also applies directly to security providers handling personal data. Contracts, sub-processors, cross-border flows, retention and incident procedures must be designed for defensible compliance
CERT-In directions: CERT-In requires covered entities to report specified cyber incidents within prescribed timelines, maintain logs and coordinate response
These obligations support monitoring and incident-response services
SEBI Cybersecurity and Cyber Resilience Framework: SEBI’s CSCRF and subsequent clarifications strengthen governance, security operations, recovery, third-party and reporting expectations for regulated securities-market entities
The framework expands the addressable market for cyber-resilience services but imposes demanding technical and service-level standards on vendors serving regulated clients
RBI technology and cyber controls: RBI directions on IT governance, risk, controls, assurance, digital-payment security and cyber resilience require regulated entities to maintain board oversight, secure systems, monitor service providers and test continuity
- Overview
- Business
- Financial Highlights
- Industry Overview
- Documentation
Get the Preqt App and keep in touch around the clock!
 Monitor your investments in real-time.
- Receive tailored deal suggestions.
- Get real-time updates and alerts.
