

A-One Steels ltd
Forging Stronger FoundationsStrength That Builds
IPO Review and Rating
Under Watch
DRHP ApprovedOverall Recommendation
A-One Steels benefits from experienced promoters, improved FY26 profitability, positive operating cash flow and strong domestic steel demand. Nevertheless, two-year standalone revenue declined, EBITDA and PAT margins remain thin, borrowings are almost equal to equity, related-party exposure is meaningful and contingent disputes are substantial relative to annual profit. The headline P/E discount is overstated by the supplied 45x industry benchmark, while unlisted-share liquidity and group-level financial visibility remain limited
PARAMETER
WEIGHT
SCORE
KEY FACTORS
Financial Performance
25.0%
2.8/5
Revenue recorded a 6.3% 3-year CAGR, while FY26 revenue increased 13.0%
Show more
Detailed Analysis
Revenue increased from restated INR 2,829.6 Cr in FY23 to INR 3,489.8 Cr in FY24, INR 3,004.3 Cr in FY25 and INR 3,396.1 Cr in FY26, representing a 6.3% FY23-FY26 3-year CAGR. FY26 revenue increased 13.0% YoY
FY26 mechanical EBITDA stood at approximately INR 277.8 Cr, versus INR 199.1 Cr in FY25, representing 39.5% YoY growth. EBITDA margin improved from approximately 6.6% to 8.2%
PAT increased from INR 46.7 Cr in FY25 to INR 111.0 Cr in FY26, +137.5% YoY. FY26 PAT margin improved from approximately 1.6% to 3.3%
FY26 D/E stood at 1.08x, compared with 0.98x in FY25
FY26 PAT of INR 111.0 Cr against average FY25-FY26 equity of approximately INR 703.1 Cr results in estimated ROE of 15.8%
Industry
25.0%
2.1/5
Indian steel demand is projected to grow at approximately 5.1% CAGR through 2030
Show more
Detailed Analysis
OECD projects Indian steel demand to increase from approximately 163.7 MT in 2025 to 209.5 MT by 2030, representing a 5.1% CAGR
Steel is a long-established, high-capacity commodity industry with established technologies, extensive existing production and cyclical pricing
Official production data indicates approximately 46% share for SAIL, 16% JSW, 15% Tata Steel, 5% AMNS, 5% JSPL and 2% RINL
The sector faces environmental/emissions regulation, BIS product standards, trade-policy intervention, mining/raw-material regulation and import safeguards
Global steel demand is projected to grow only approximately 0.9% CAGR through 2030, while A-One's FY26 balance-sheet foreign receivables were only approximately INR 2.1 Cr
Management
25.0%
3.7/5
Experienced promoters and a 50%-independent board are positives
Show more
Detailed Analysis
Chairman Krishan Kumar Jalan reportedly has 30+ years’ experience, while Sunil Jallan and Sandeep Kumar have 20+ years
Three of six directors are independent, satisfying the framework’s 50% independent-director threshold
No promoter-share pledge was identified, but ₹61.9 crore of tax, GST, IP and electricity-duty disputes require monitoring
Operating related-party transactions were approximately 10% of revenue
Valuation Metrics
25.0%
3.1/5
Headline P/E appears cheap, but peer-normalized earnings, leverage and unlisted-price volatility materially reduce the apparent discount
Show more
Detailed Analysis
The 19.4x P/E represents a 56.8% discount to the attached industry P/E of 45x
Estimated EV/EBITDA is 10.8x, approximately 1.1x the current steel-sector median near 9.5x
The Company is valued at 2.8x P/B, based on market capitalisation of INR 2,156.7 Cr against FY26 equity of INR 758.7 Cr
TOTAL
100%
2.9/5
Weighted Composite Score
Per Share Price
₹324.5
As of 29 Aug 2026
Lot Size
100.0 Shares
Minimum Investment
₹32,450.0 / 100 shares
Market Cap. (₹ Cr)
Revenue FY’26
PAT FY’26
P/E Multiple
Face Value
₹ 10.0Lot Size
100.0 sharesPAT FY’26
₹ 111.0 CrPAT Margin (%)
3.3 %P/E Multiple
19.4xCAGR Growth 3Y
6.3 %ROE (FY’26)
15.8 %ROCE (FY’26)
15.5 %Price to Book Value ratio
2.8xDebt/Equity (FY’26)
1.1xMerchant banker appointed
✅ YesCompany Website
www.aonesteelgroup.comDisclaimer: Unlisted shares are unregulated & illiquid. This is NOT investment advice. Please do your own due diligence before investing.
Minimum Investment
₹32,450.0 / 100 sharesShares Lot 100 X 1
Investment amount
₹32,450.0
Overview
Business
Products
Business Model
Geographical Presence
Sales Channel
Financial Highlights
Income Statement
Revenue growth with EBITDA and PAT margins
| Financial Metric | FY 2024 | FY 2025 | FY 2026 |
|---|---|---|---|
| Revenue (₹ Cr) | 3,489.8 | 3,004.3 | 3,396.1 |
| Growth (%) | 23.3% | -13.9% | 13.0% |
| EBITDA (₹ Cr) | 148.0 | 199.1 | 277.8 |
| EBITDA Margin (%) | 4.3% | 6.6% | 8.2% |
| PAT (₹ Cr) | 26.2 | 46.7 | 111.0 |
| PAT Margin (%) | 0.8% | 1.6% | 3.3% |
OBSERVATIONS & INSIGHTS
FY26 revenue increased 13.0% from FY25 but was still 2.7% below FY24, producing a negative 1.4% FY24- FY26 CAGR
EBITDA margin rose from 4.3% in FY24 to 8.2% in FY26, while PAT margin increased from 0.8% to 3.3%
Finance costs remained around ₹85.7 Cr in FY26, but the stronger operating result increased interest coverage to 2.7x
Balance Sheet
| Financial Metric | FY 2024 | FY 2025 | FY 2026 |
|---|---|---|---|
| EQUITY & LIABILITIES | ₹ 1,932.6 Cr | ₹ 2,215.4 Cr | ₹ 2,602.5 Cr |
| Net Worth | ₹ 354.3 Cr | ₹ 647.6 Cr | ₹ 758.7 Cr |
| Share Capital | ₹ 16.7 Cr | ₹ 68.5 Cr | ₹ 68.5 Cr |
| Reserves & Surplus | ₹ 337.6 Cr | ₹ 579.1 Cr | ₹ 690.2 Cr |
| Total Liabilities | ₹ 1,578.3 Cr | ₹ 1,567.8 Cr | ₹ 1,843.8 Cr |
| Current Liabilities | ₹ 1,230.6 Cr | ₹ 1,256.3 Cr | ₹ 1,485.8 Cr |
| Borrowings | ₹ 678.2 Cr | ₹ 553.4 Cr | ₹ 547.5 Cr |
| Trade Payables | ₹ 367.7 Cr | ₹ 610.9 Cr | ₹ 791.9 Cr |
| Other Current Liabilities | ₹ 184.7 Cr | ₹ 92.0 Cr | ₹ 146.4 Cr |
| Non-Current Liabilities | ₹ 347.7 Cr | ₹ 311.5 Cr | ₹ 358.0 Cr |
| Borrowings | ₹ 169.5 Cr | ₹ 143.0 Cr | ₹ 198.0 Cr |
| Other Non-Current Liabilities | ₹ 178.2 Cr | ₹ 168.5 Cr | ₹ 160.0 Cr |
| ASSETS | ₹ 1,932.5 Cr | ₹ 1,895.3 Cr | ₹ 2,602.6 Cr |
| Current Assets | ₹ 1,349.5 Cr | ₹ 1,173.2 Cr | ₹ 1,890.1 Cr |
| Trade Receivables | ₹ 531.4 Cr | ₹ 438.9 Cr | ₹ 696.2 Cr |
| Inventory | ₹ 445.9 Cr | ₹ 610.0 Cr | ₹ 699.5 Cr |
| Cash & Cash Equivalents | ₹ 82.3 Cr | ₹ 87.8 Cr | ₹ 77.9 Cr |
| Other Current Assets | ₹ 289.9 Cr | ₹ 36.5 Cr | ₹ 416.5 Cr |
| Non-Current Assets | ₹ 583.0 Cr | ₹ 722.1 Cr | ₹ 712.5 Cr |
| Fixed Assets | ₹ 416.3 Cr | ₹ 442.5 Cr | ₹ 428.9 Cr |
| Other Non-Current Assets | ₹ 166.7 Cr | ₹ 279.6 Cr | ₹ 283.6 Cr |
OBSERVATIONS & INSIGHTS
Shareholders' wealth increased from ₹354.3 Cr to ₹758.7 Cr, reflecting retained earnings and the FY25 capital restructuring
Inventory and receivables together increased by ₹418.4 Cr from FY24 to FY26, absorbing cash despite the earnings improvement
Trade payables more than doubled to ₹791.9 Cr, partly financing the larger operating asset base and reducing the cash-cycle impact
Total assets increased to ₹2,602.5 Cr, while fixed assets declined modestly from FY25, showing that FY26 growth was driven mainly by working capital rather than heavy new fixed-asset deployment
Cash Flow
| Financial Metric | FY 2024 | FY 2025 | FY 2026 |
|---|---|---|---|
CFO (₹ Cr) Cash generated from core business operations. | +201.7 Cr | +168.9 Cr | +32.2 Cr |
CFI (₹ Cr) Cash used for investments and long-term assets. | -133.8 Cr | -180.5 Cr | +1.5 Cr |
CFF (₹ Cr) Cash flow related to funding and borrowings. | -94.5 Cr | +11 Cr | -30.0 Cr |
Working Capital
| Efficiency Metric | FY 2023 | FY 2024 | FY 2025 |
|---|---|---|---|
Debtor Days Average number of days taken to collect customer payments. | - | - | - |
Creditor Days Average time taken to pay suppliers and vendors. | - | - | - |
Inventory Days Average number of days inventory remains unsold. | - | - | - |
CCC (Cash Conversion Cycle) (Debtor Days + Inventory Days - Creditor Days) | - | - | - |
Financial Ratios
Measures the company’s leverage relative to shareholder equity.
OBSERVATIONS & INSIGHTS
FY26 ROE reached 16.0% and ROA reached 4.6% as earnings grew faster than the capital base
Debt / equity fell from 2.4x to 1.0x, although absolute borrowings and funding needs remain material for a cyclical business
CFO / PAT fell to 0.3x in FY26, showing that accounting profit was not converted into operating cash at the same pace
The current ratio increased to 1.3x and net working capital reached ₹404.3 Cr, but the quick ratio remained below 1.0
Industry Overview
Industry Drivers
Expansion of Technological Capabilities
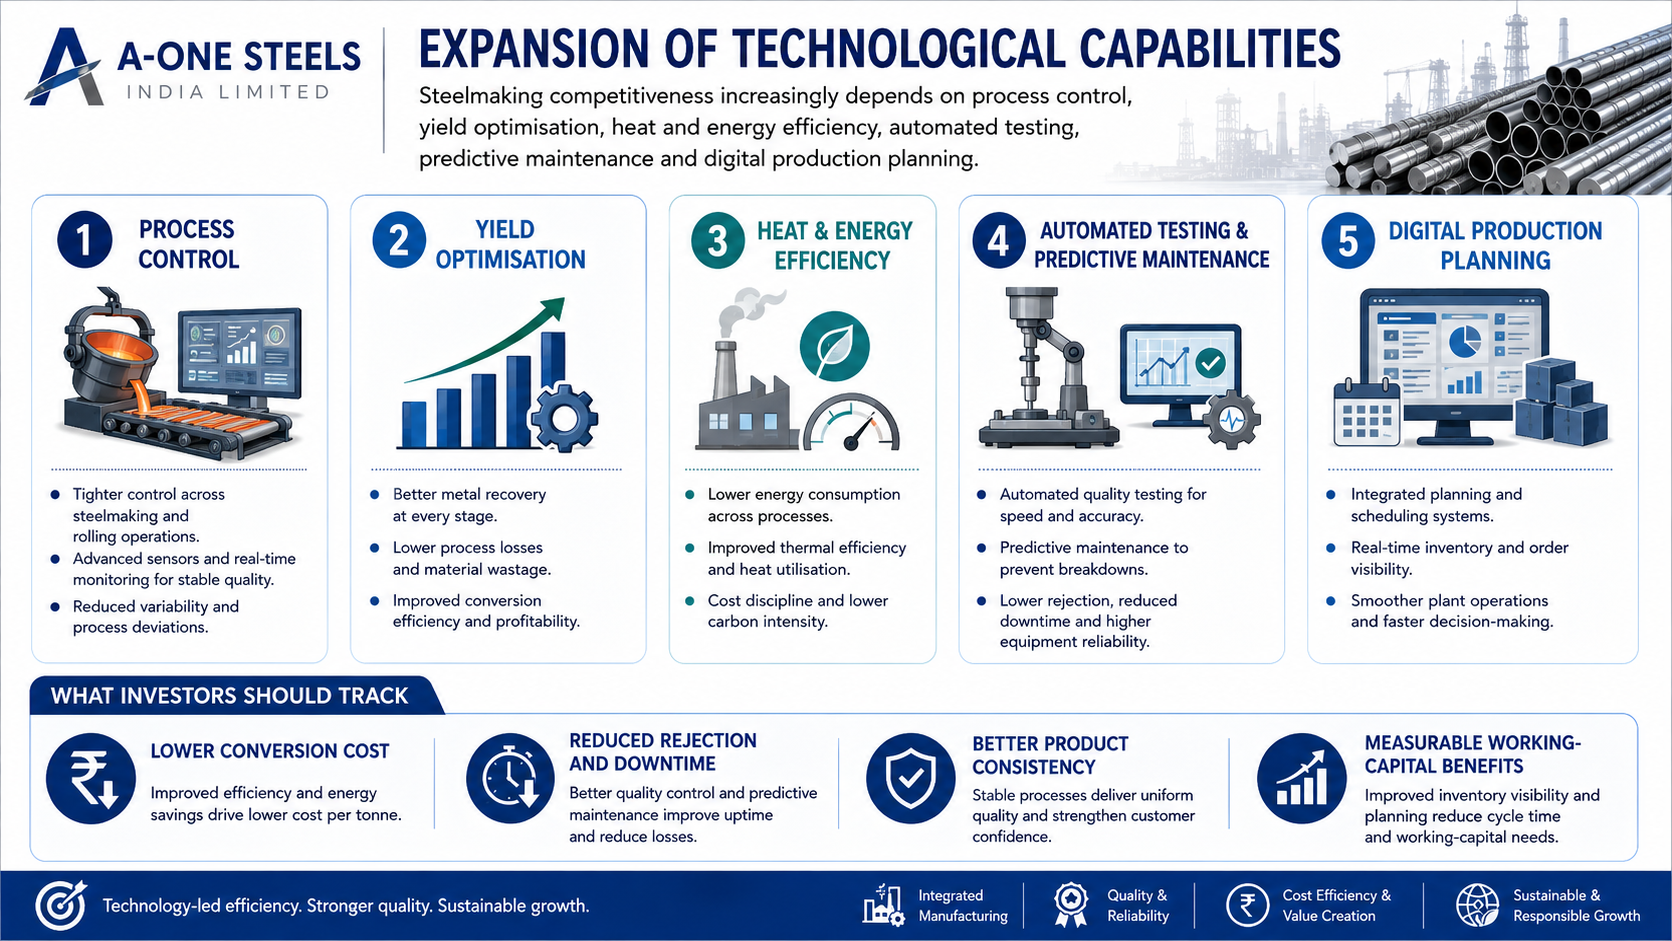
Steel making competitiveness increasingly depends on process control, yield optimisation, heat and energy efficiency, automated testing, predictive maintenance and digital production planning
For A-One, technology investment should be evaluated through lower conversion cost, reduced rejection and downtime, better product consistency and measurable working-capital benefits rather than installation alone
Capacity Expansion
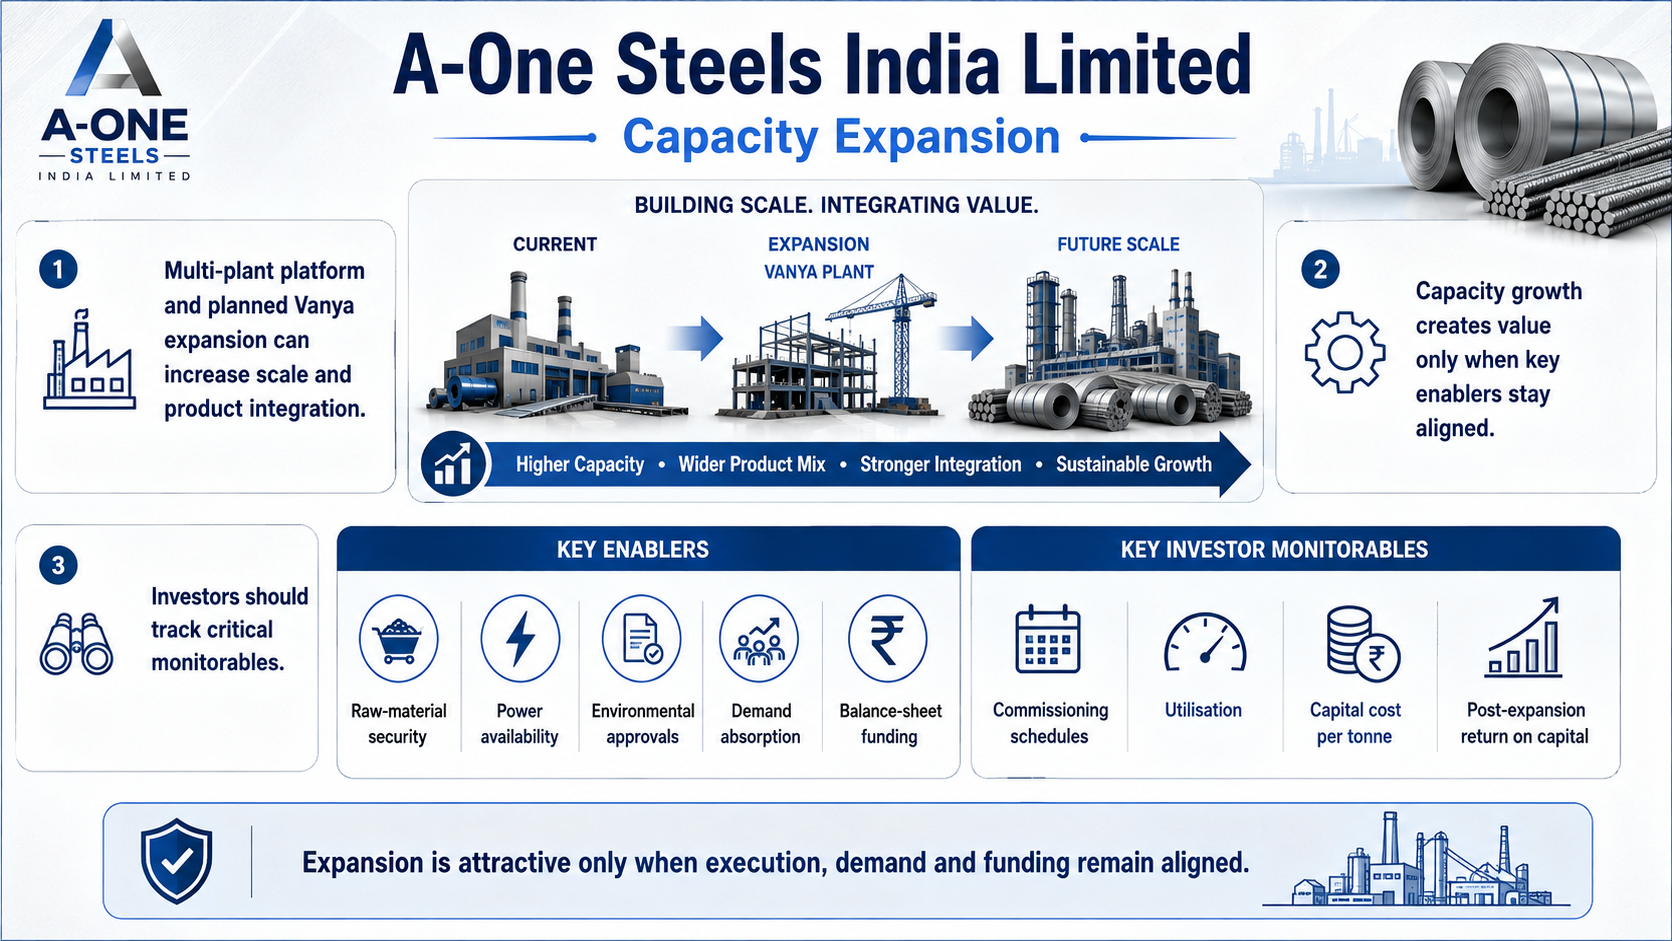
The company's multi-plant platform and planned Vanya expansion can increase scale and product integration
Capacity growth is valuable only when raw-material security, power availability, environmental approvals, demand absorption and balance-sheet funding remain aligned
Investors should track commissioning schedules, utilisation, capital cost per tonne and post-expansion return on capital
Global Market Penetration
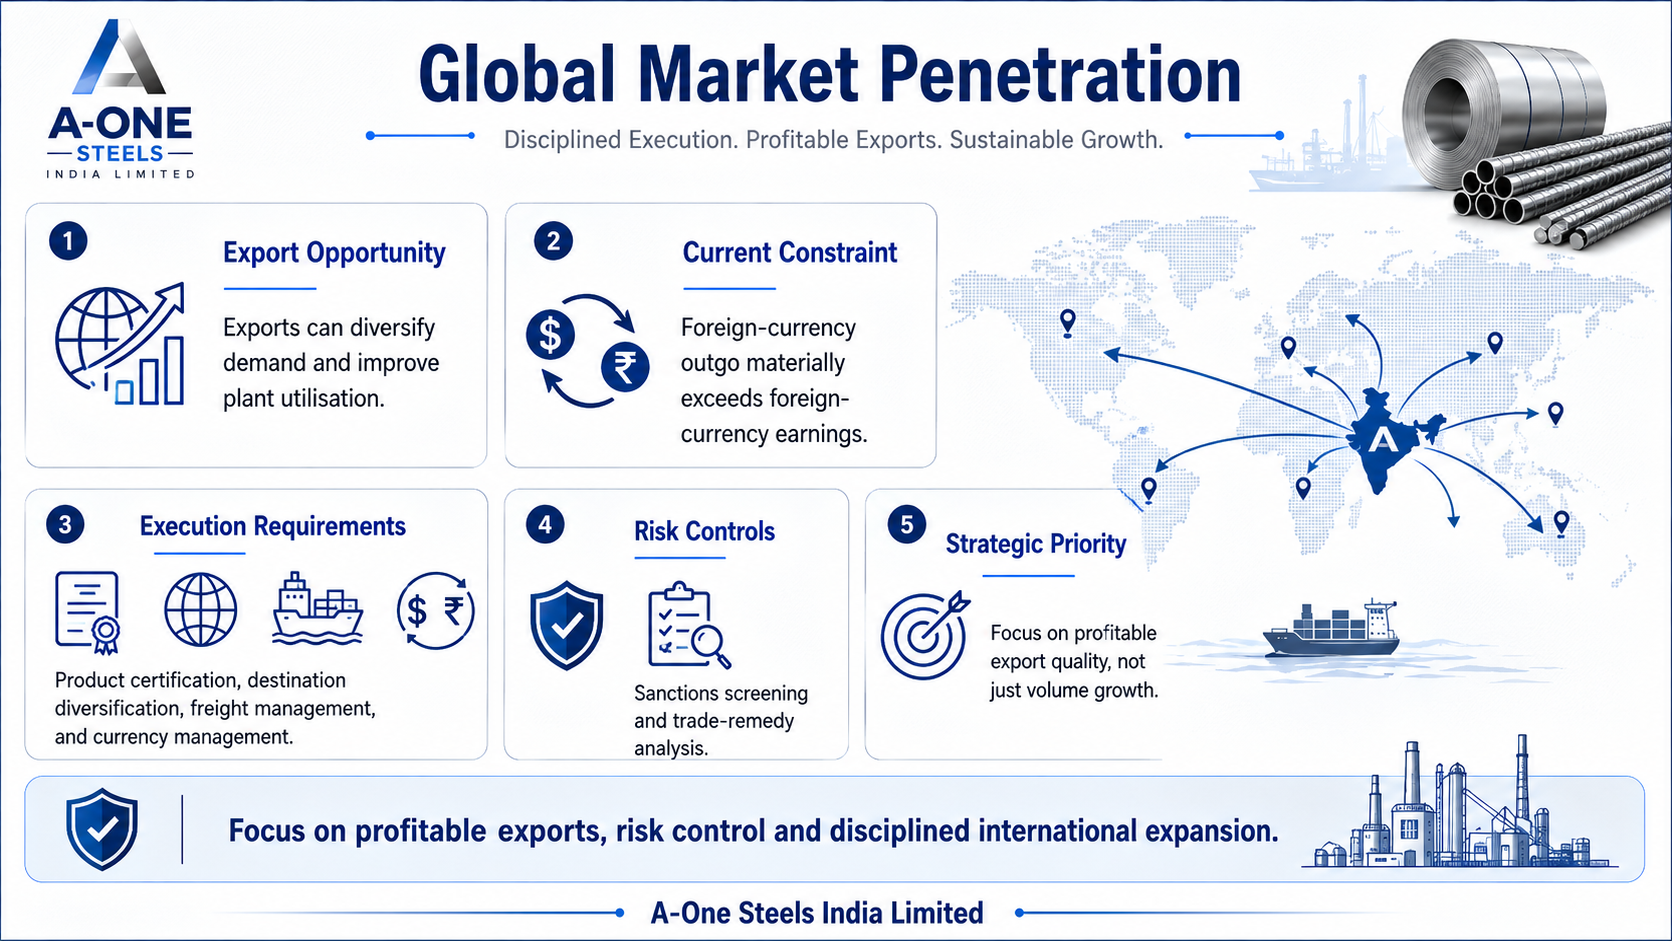
Exports can diversify demand and improve utilisation, but A-One's disclosed foreign-currency outgo materially exceeds earnings
Global penetration therefore requires careful product certification, destination diversification, freight and currency management, sanctions screening and trade-remedy analysis
The immediate priority is profitable export quality rather than headline volume
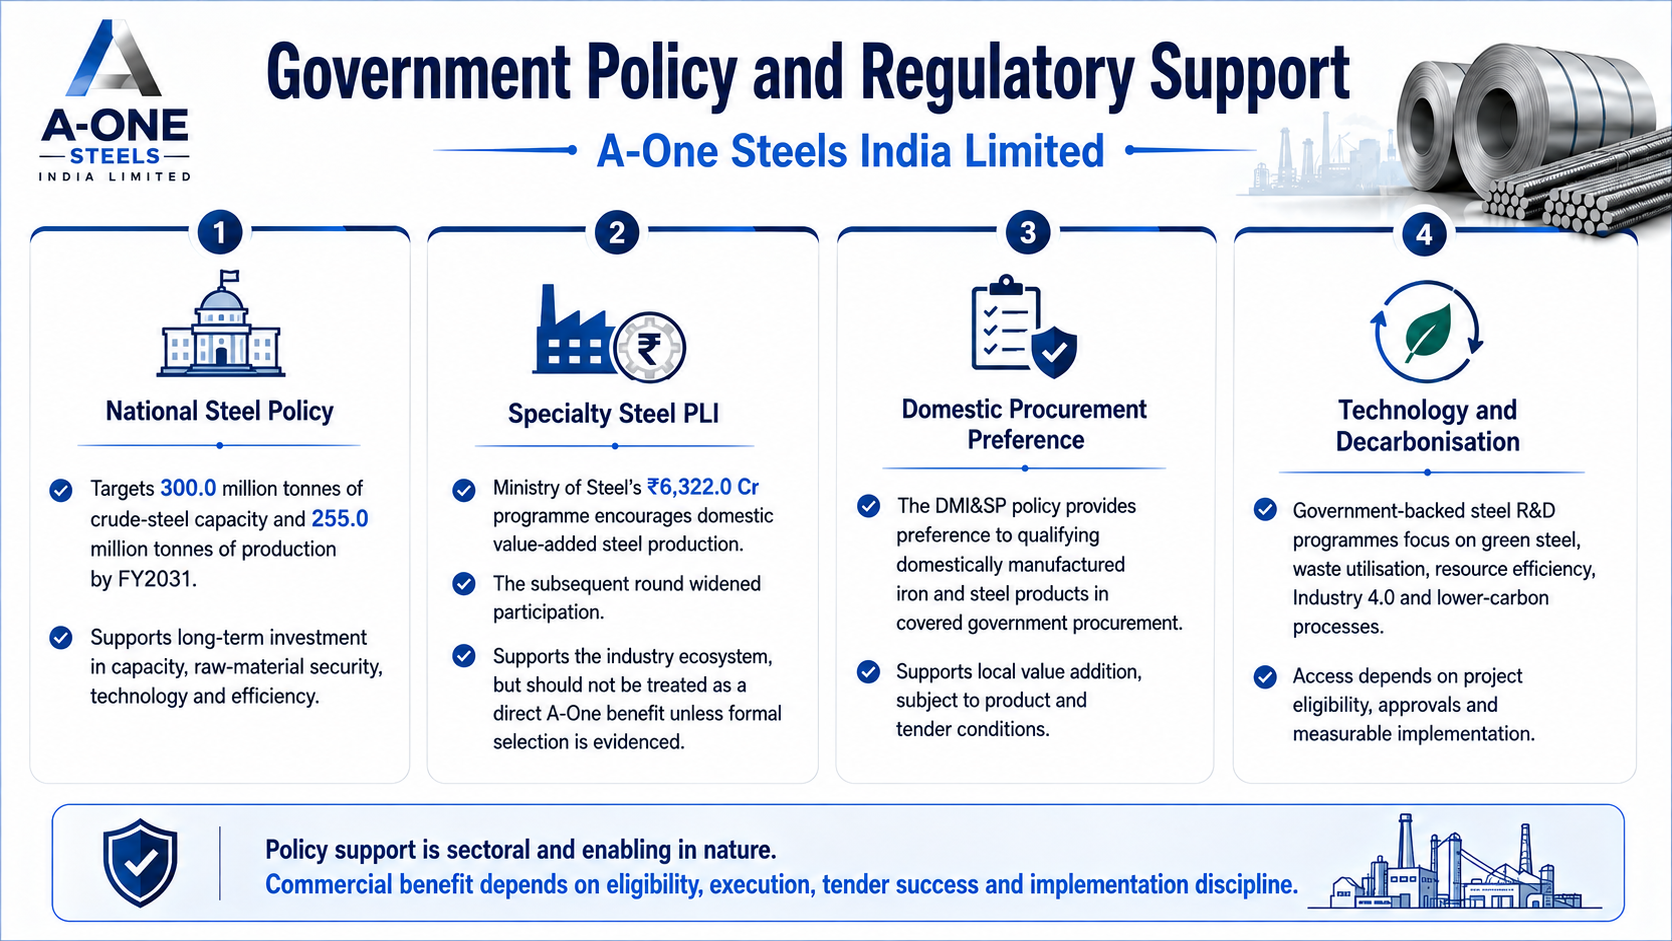
Government Policy Support
National Steel Policy: The policy targets 300.0 million tonnes of crude-steel capacity and 255.0 million tonnes of production by FY2031, supporting long-term investment in capacity, raw-material security, technology and efficiency
Specialty Steel PLI: The Ministry of Steel's ₹6,322.0 Cr programme encourages domestic value-added steel production, and its subsequent round widened participation. It supports the industry ecosystem but should not be treated as a direct A-One benefit unless formal selection is evidenced
Domestic procurement preference: The DMI&SP policy provides preference to qualifying domestically manufactured iron and steel products in covered government procurement, supporting local value addition subject to product and tender conditions
Technology and decarbonisation: Government-backed steel R&D programmes focus on green steel, waste utilisation, resource efficiency, Industry 4.0 and lower-carbon processes. Access depends on project eligibility, approvals and measurable implementation
- Overview
- Business
- Financial Highlights
- Industry Overview
- Documentation
Get the Preqt App and keep in touch around the clock!
 Monitor your investments in real-time.
- Receive tailored deal suggestions.
- Get real-time updates and alerts.
