


Absolute Projects (India) Limited
Building Energy InfrastructurePowering Infrastructure Progress
Unlisted Review and Rating
Considerable
DRHP ApprovedOverall Recommendation
Absolute Projects has developed into a strong-growth power and infrastructure EPC company. Revenue has more than doubled between FY23 and FY25, EBITDA margin has increased from 4.7% to 12.6%, PAT has expanded substantially and ROE remains above 30%. The INR 9.15 lakh Cr Indian transmission investment pipeline provides a strong structural tailwind, while APIL's growing export contribution adds another growth avenue.
At approximately 11.9x FY25 earnings, valuation appears attractive relative to the supplied 30x industry multiple and current listed EPC peers. Management quality also scores well because of long promoter operating history, high ownership, an increasingly independent board and clean audit findings. The single biggest issue is cash conversion. FY25's INR 25.1 Cr PAT was accompanied by negative INR 70.4 Cr operating cash flow, as receivables, inventory and other working-capital assets increased sharply. Debt consequently increased and DSCR fell to 0.33x. This is significant enough that the low P/E should not be viewed in isolation.
PARAMETER
WEIGHT
SCORE
KEY FACTORS
Financial Performance
25.0%
4.0/5
Excellent revenue growth, margin expansion and ROE are materially offset by weak cash conversion, rising receivables and significantly higher borrowings
Show more
Detailed Analysis
Revenue increased from INR 145.03 Cr in FY23 to INR 307.30 Cr in FY25, an excellent 45.6% two-year CAGR. FY25 itself delivered 23.6% growth
EBITDA margin improved consistently from 4.7% → 9.5% → 12.6%, demonstrating significant operating leverage and better project profitability
PAT margin expanded from 2.00% in FY23 to 5.94% in FY24 and 8.2% in FY25, while FY25 PAT increased 70.1% YoY
Debt/equity remains manageable at 0.8x, but increased materially from 0.54x as borrowings were raised to fund growth and working capital
FY25 ROE remained exceptional at 30.6%, broadly maintaining FY24's 29.3% despite a large increase in equity capital
Industry
25.0%
4.0/5
A powerful multi-year transmission capex cycle and emerging exports provide strong growth visibility, although competitive tendering keeps pricing and execution risk meaningful
Show more
Detailed Analysis
India's transmission sector has a very large committed investment pipeline, with approximately ₹9.1 lakh Cr of investment opportunities through 2032
Power EPC is established, but transmission infrastructure is entering another major expansion cycle driven by renewable integration and electricity-demand growth
The sector benefits from strong policy visibility, but tender awards, project approvals, rights-of-way, payment cycles and regulatory processes remain execution risks
APIL generated approximately 15.6% of FY25 revenue from exports, demonstrating actual international execution rather than merely potential export exposure
Management
25.0%
4.0/5
Long promoter experience, high ownership and improving institutional governance are strong positives; director funding and related-party contracts deserve ongoing monitoring.
Show more
Detailed Analysis
APIL is presenting its 30th Annual Report, with the Ola promoter family maintaining long-standing operational control and successfully scaling revenue and profitability
Governance has strengthened materially, with three non-executive independent directors alongside the promoter executives plus dedicated CFO and Company Secretary functions.
RPTs are disclosed as arm's length, but director loans and a INR 14.7 Cr contract with an entity having common directors warrant continued monitoring
Valuation Metrics
25.0%
3.0/5
APIL is inexpensive on earnings, but only moderately discounted on EV/EBITDA, while the sharp unlisted-price correction reflects liquidity and execution risk
Show more
Detailed Analysis
11.89x P/E is approximately 60% below the supplied 30x industry P/E and materially below KEC International's current ~20.5x multiple]
APIL's estimated ~10.0x EV/EBITDA is close to KEC's ~10.5x and Kalpataru Projects' ~11.0x, making valuation fair rather than exceptionally cheap on enterprise value
2.92x P/B is not particularly cheap versus KEC's ~1.8x, although APIL's 30.6% ROE supports a meaningful book-value premium
TOTAL
100%
3.8/5
Weighted Composite Score
Per Share Price
₹76.0
As of 24 Oct 2026
Lot Size
1,000.0 Shares
Minimum Investment
₹76,000.0 / 1,000 shares
Market Cap. (₹ Cr)
Revenue FY’25
PAT FY’25
P/E Multiple
Face Value
₹ 2.0Lot Size
1,000.0 sharesSale Type
Secondary SalePAT FY’25
₹ 21.0 CrPAT Margin (%)
6.8 %P/E Multiple
16.8xCAGR Growth 3Y
47.1 %ROE (FY’25)
20.3 %ROCE (FY’25)
14.7 %Price to Book Value ratio
1.7xMerchant banker appointed
❌ NoCompany Website
www.apil-online.comDisclaimer: Unlisted shares are unregulated & illiquid. This is NOT investment advice. Please do your own due diligence before investing.
Minimum Investment
₹76,000.0 / 1,000 sharesShares Lot 1000 X 1
Investment amount
₹76,000.0
Overview
Business
Business Model
Geographical Presence
Sales Channel
Financial Highlights
Income Statement
Revenue growth with EBITDA and PAT margins
| Financial Metric | FY 2023 | FY 2024 | FY 2025 |
|---|---|---|---|
| Revenue (₹ Cr) | 145.0 | 248.7 | 307.3 |
| Growth (%) | - | 71.5% | 23.6% |
| EBITDA (₹ Cr) | 6.8 | 23.6 | 38.7 |
| EBITDA Margin (%) | 4.7% | 9.5% | 12.6% |
| PAT (₹ Cr) | 2.9 | 14.8 | 25.1 |
| PAT Margin (%) | 2.0% | 5.9% | 8.2% |
OBSERVATIONS & INSIGHTS
Revenue increased from INR 145.0 Cr to INR 307.3 Cr, a 45.6% two-year CAGR
Margin expanded by 7.9 percentage points to 12.6% as scale and project economics improved; the later DRHP method produces a lower FY25 margin
Annual-report PAT increased from INR 2.9 Cr to INR 25.1 Cr, but the later DRHP restated FY25 PAT to INR 21.0 Cr, Annual-report PAT margin improved by 6.2 percentage points to 8.2%, showing stronger reported earnings conversion
Balance Sheet
| Financial Metric | FY 2023 | FY 2024 | FY 2025 |
|---|---|---|---|
| EQUITY & LIABILITIES | ₹ 139.5 Cr | ₹ 201.4 Cr | ₹ 290.1 Cr |
| Net Worth | ₹ 41.6 Cr | ₹ 56.9 Cr | ₹ 107.5 Cr |
| Share Capital | ₹ 6.9 Cr | ₹ 7.4 Cr | ₹ 8.3 Cr |
| Reserves & Surplus | ₹ 34.7 Cr | ₹ 49.5 Cr | ₹ 99.2 Cr |
| Total Liabilities | ₹ 97.9 Cr | ₹ 144.5 Cr | ₹ 182.6 Cr |
| Current Liabilities | ₹ 93.4 Cr | ₹ 140.1 Cr | ₹ 133.6 Cr |
| Borrowings | ₹ 19.6 Cr | ₹ 27.2 Cr | ₹ 40.3 Cr |
| Trade Payables | ₹ 60.4 Cr | ₹ 68.7 Cr | ₹ 66.8 Cr |
| Other Current Liabilities | ₹ 13.4 Cr | ₹ 44.2 Cr | ₹ 26.5 Cr |
| Non-Current Liabilities | ₹ 4.5 Cr | ₹ 4.4 Cr | ₹ 49.0 Cr |
| Borrowings | ₹ 3.9 Cr | ₹ 3.8 Cr | ₹ 48.3 Cr |
| Other Non-Current Liabilities | ₹ 0.6 Cr | ₹ 0.6 Cr | ₹ 0.7 Cr |
| ASSETS | ₹ 139.5 Cr | ₹ 201.3 Cr | ₹ 290.1 Cr |
| Current Assets | ₹ 116.1 Cr | ₹ 182.2 Cr | ₹ 254.0 Cr |
| Trade Receivables | ₹ 33.8 Cr | ₹ 17.6 Cr | ₹ 71.1 Cr |
| Inventory | ₹ 25.9 Cr | ₹ 52.9 Cr | ₹ 68.2 Cr |
| Cash & Cash Equivalents | ₹ 4.4 Cr | ₹ 16.5 Cr | ₹ 16.2 Cr |
| Other Current Assets | ₹ 52.0 Cr | ₹ 95.2 Cr | ₹ 98.5 Cr |
| Non-Current Assets | ₹ 23.4 Cr | ₹ 19.1 Cr | ₹ 36.1 Cr |
| Fixed Assets | ₹ 10.9 Cr | ₹ 10.4 Cr | ₹ 17.2 Cr |
| Other Non-Current Assets | ₹ 12.5 Cr | ₹ 8.7 Cr | ₹ 18.9 Cr |
OBSERVATIONS & INSIGHTS
Equity increased from INR 41.6 Cr to INR 107.5 Cr through retained earnings and fresh share issuance, Share capital reached INR 8.3 Cr while reserves nearly doubled in FY25 to INR 99.2 Cr, including securities premium
Payables remained broadly stable at INR 66.8 Cr despite higher scale, reducing incremental supplier funding, Short-term borrowing increased to INR 40.3 Cr as working-capital requirements expanded
The balance normalised from INR 44.2 Cr to INR 26.5 Cr, partly offsetting the rise in borrowings, Long-term borrowing rose from INR 3.8 Cr to INR 48.3 Cr, becoming the main source of liability growth
Cash remained stable at INR 16.2 Cr while inventory rose to INR 68.2 Cr, indicating cash was deployed into execution, Trade receivables increased to INR 71.1 Cr and other current assets to INR 98.5 Cr, making the asset base working-capital-heavy and Fixed and other non-current assets increased to INR 36.1 Cr, but remained a modest portion of total assets
Cash Flow
| Financial Metric | FY 2023 | FY 2024 | FY 2025 |
|---|---|---|---|
CFO (₹ Cr) Cash generated from core business operations. | -7.0 Cr | +11.7 Cr | -70.4 Cr |
CFI (₹ Cr) Cash used for investments and long-term assets. | +0.6 Cr | -4.2 Cr | -8.6 Cr |
CFF (₹ Cr) Cash flow related to funding and borrowings. | +10.7 Cr | +4.6 Cr | +78.7 Cr |
Working Capital
| Efficiency Metric | FY 2023 | FY 2024 | FY 2025 |
|---|---|---|---|
Debtor Days Average number of days taken to collect customer payments. | - | - | - |
Creditor Days Average time taken to pay suppliers and vendors. | - | - | - |
Inventory Days Average number of days inventory remains unsold. | - | - | - |
CCC (Cash Conversion Cycle) (Debtor Days + Inventory Days - Creditor Days) | - | - | - |
Financial Ratios
Measures the company’s leverage relative to shareholder equity.
OBSERVATIONS & INSIGHTS
ROE rose to 30.6% as earnings grew faster than average equity in the annual-report series, ROCE fell from 26.2% to 19.4% in FY25 because the expanded capital base outpaced EBIT growth
Leverage increased to 0.8x after substantial long-term borrowing was raised in FY25, Debt-to-EBITDA improved from 3.5x in FY23 but rose from 1.3x to 2.3x in FY25 as borrowing accelerated
Coverage increased to 8.4x because EBIT grew faster than finance cost
The current ratio improved to 1.9x as current assets, especially receivables and other operating assets, expanded
Industry Overview
Industry Drivers
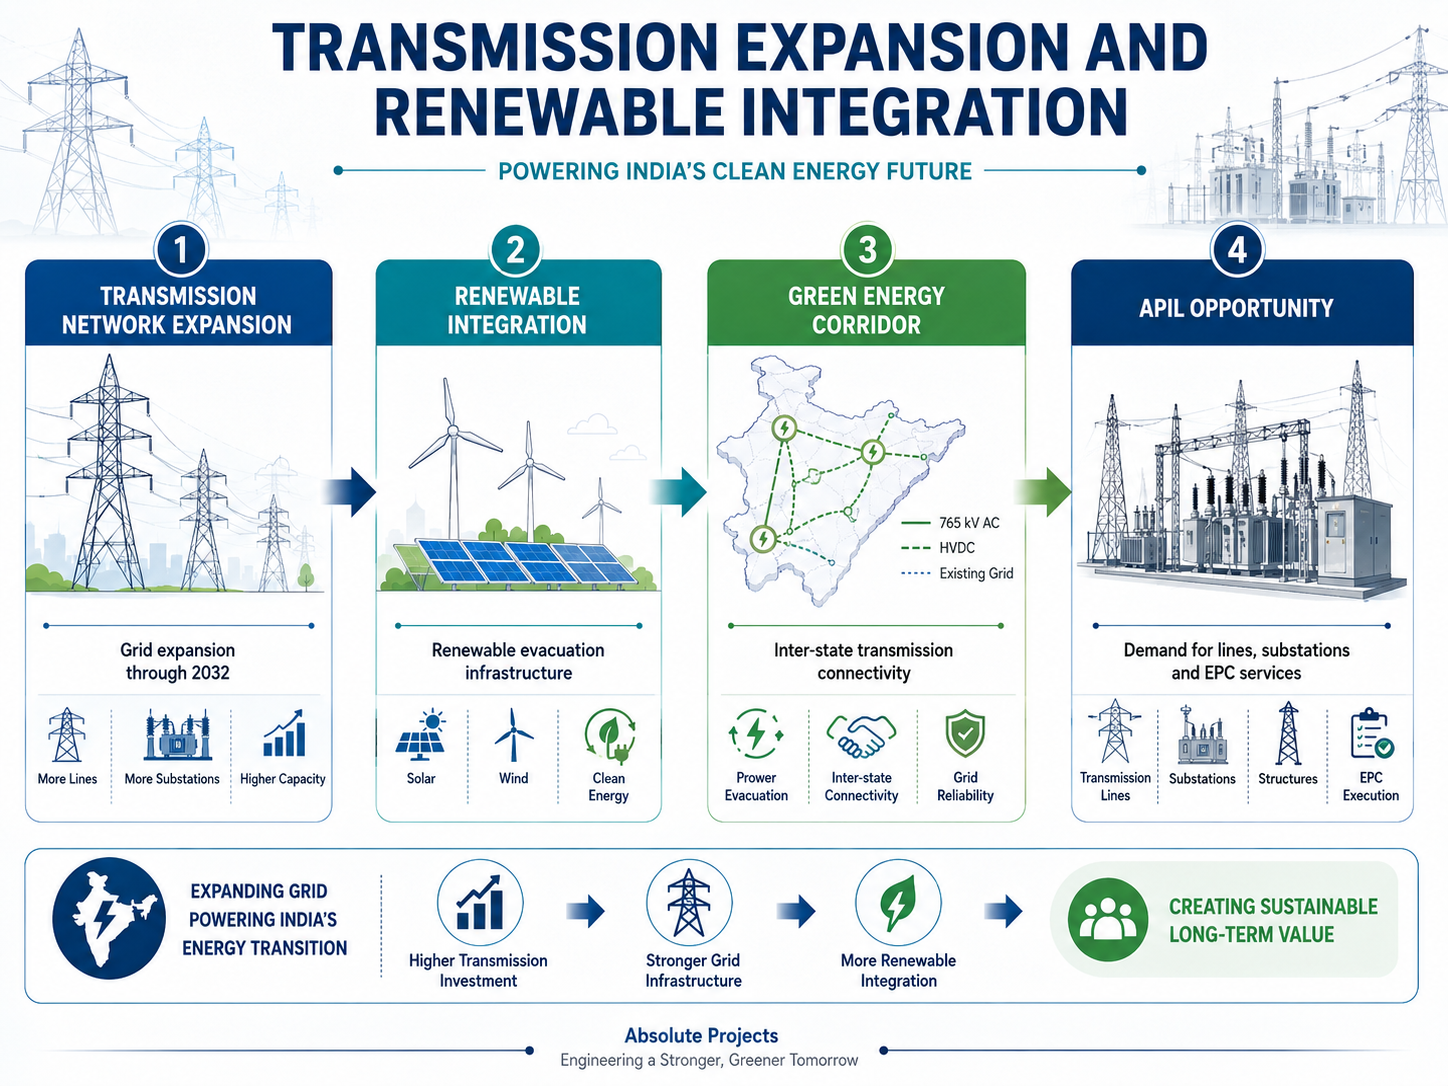
Transmission Expansion and Renewable Integration
The national transmission network is planned to expand materially through 2032, while Green Energy Corridor and inter-state systems are being developed to evacuate renewable power
This supports demand for lines, substations, structures and associated EPC services
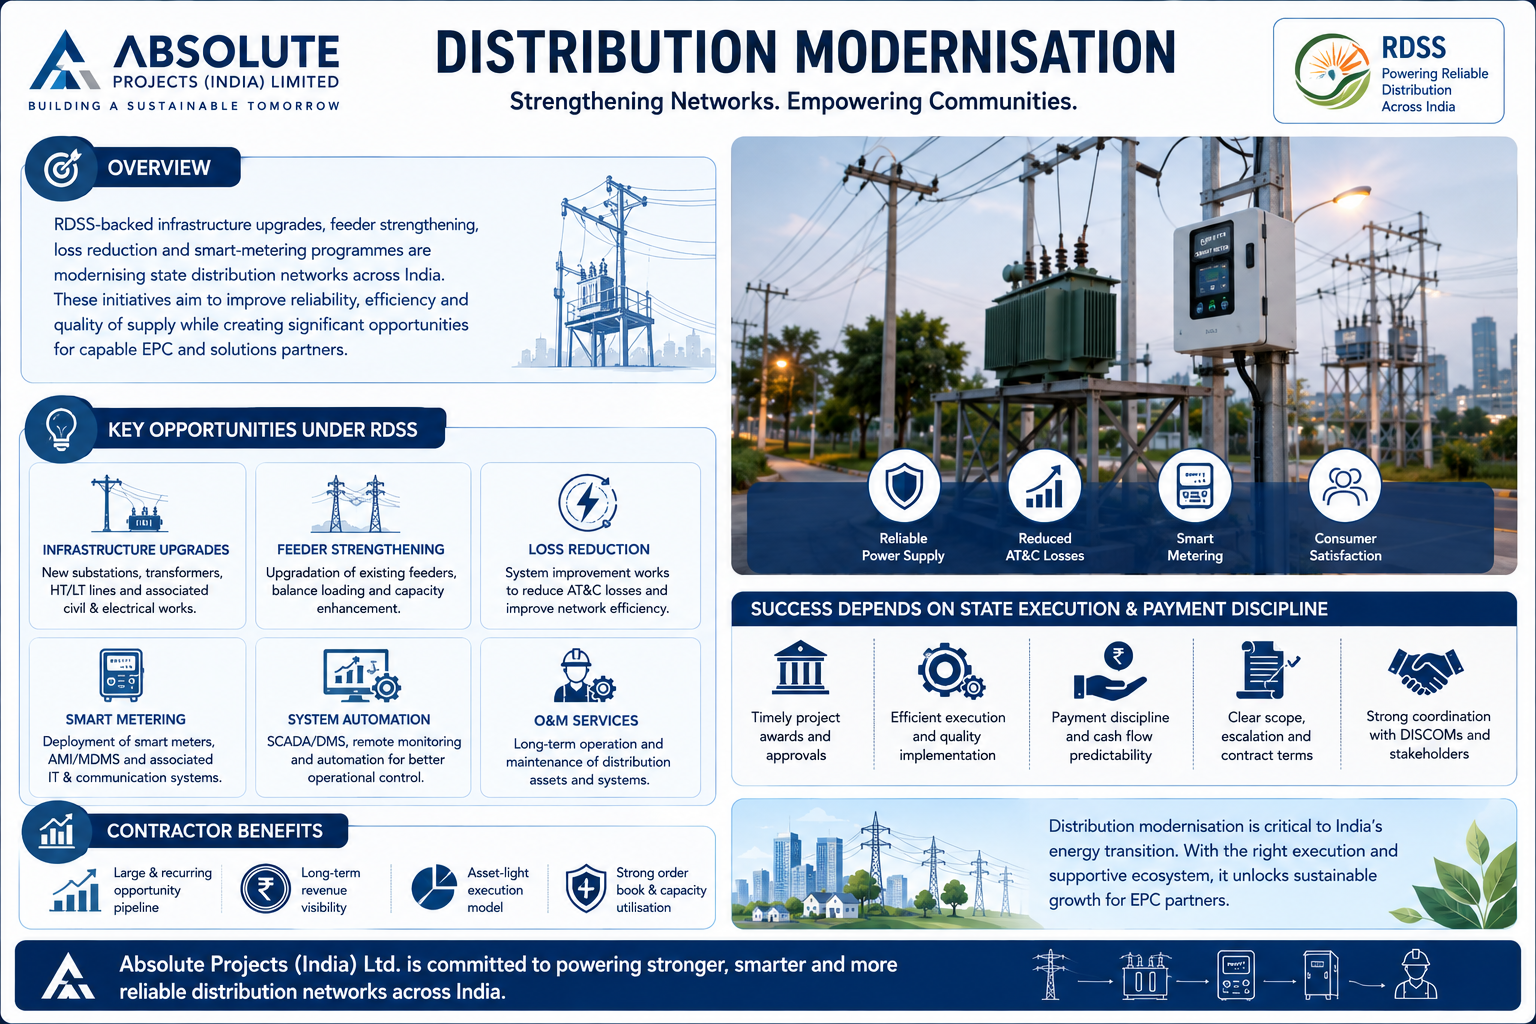
Distribution Modernisation
RDSS-backed infrastructure upgrades, feeder strengthening, loss reduction and smart-metering programmes create opportunities in state distribution networks
Contractor benefits depend on state execution and payment discipline
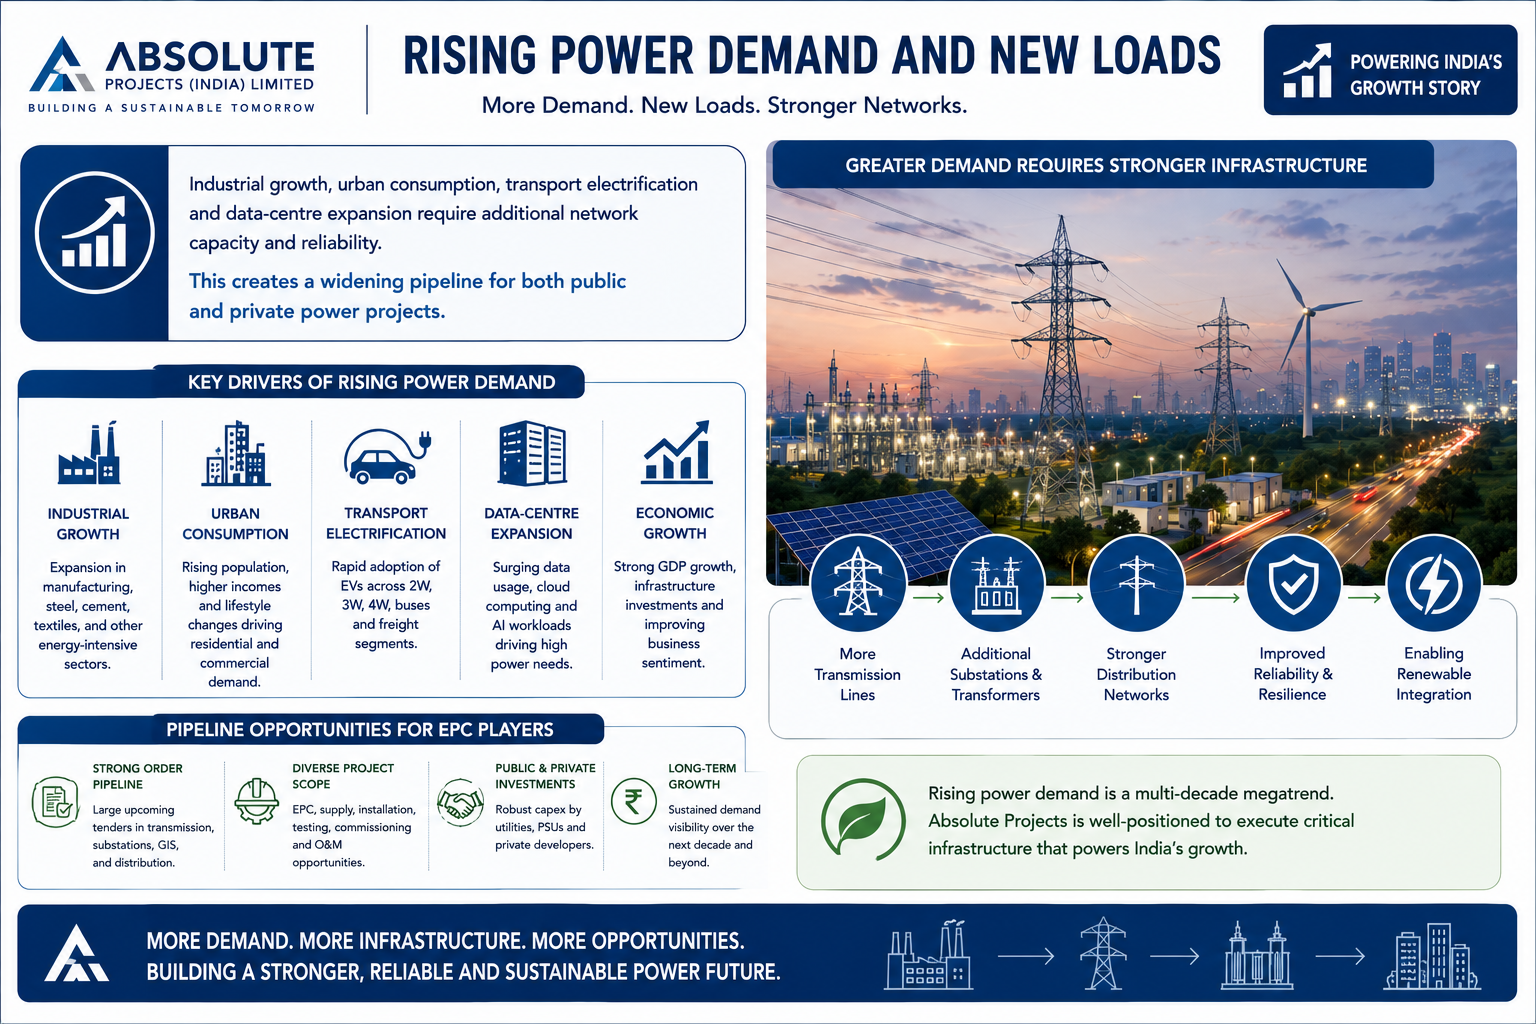
Rising Power Demand and New Loads
Industrial growth, urban consumption, transport electrification, and data-centre expansion are rapidly accelerating energy demands globally
This surge requires urgent grid modernization to ensure network capacity and reliability. Consequently, it is widening the pipeline for high-value public and private infrastructure projects, attracting massive global capital investments
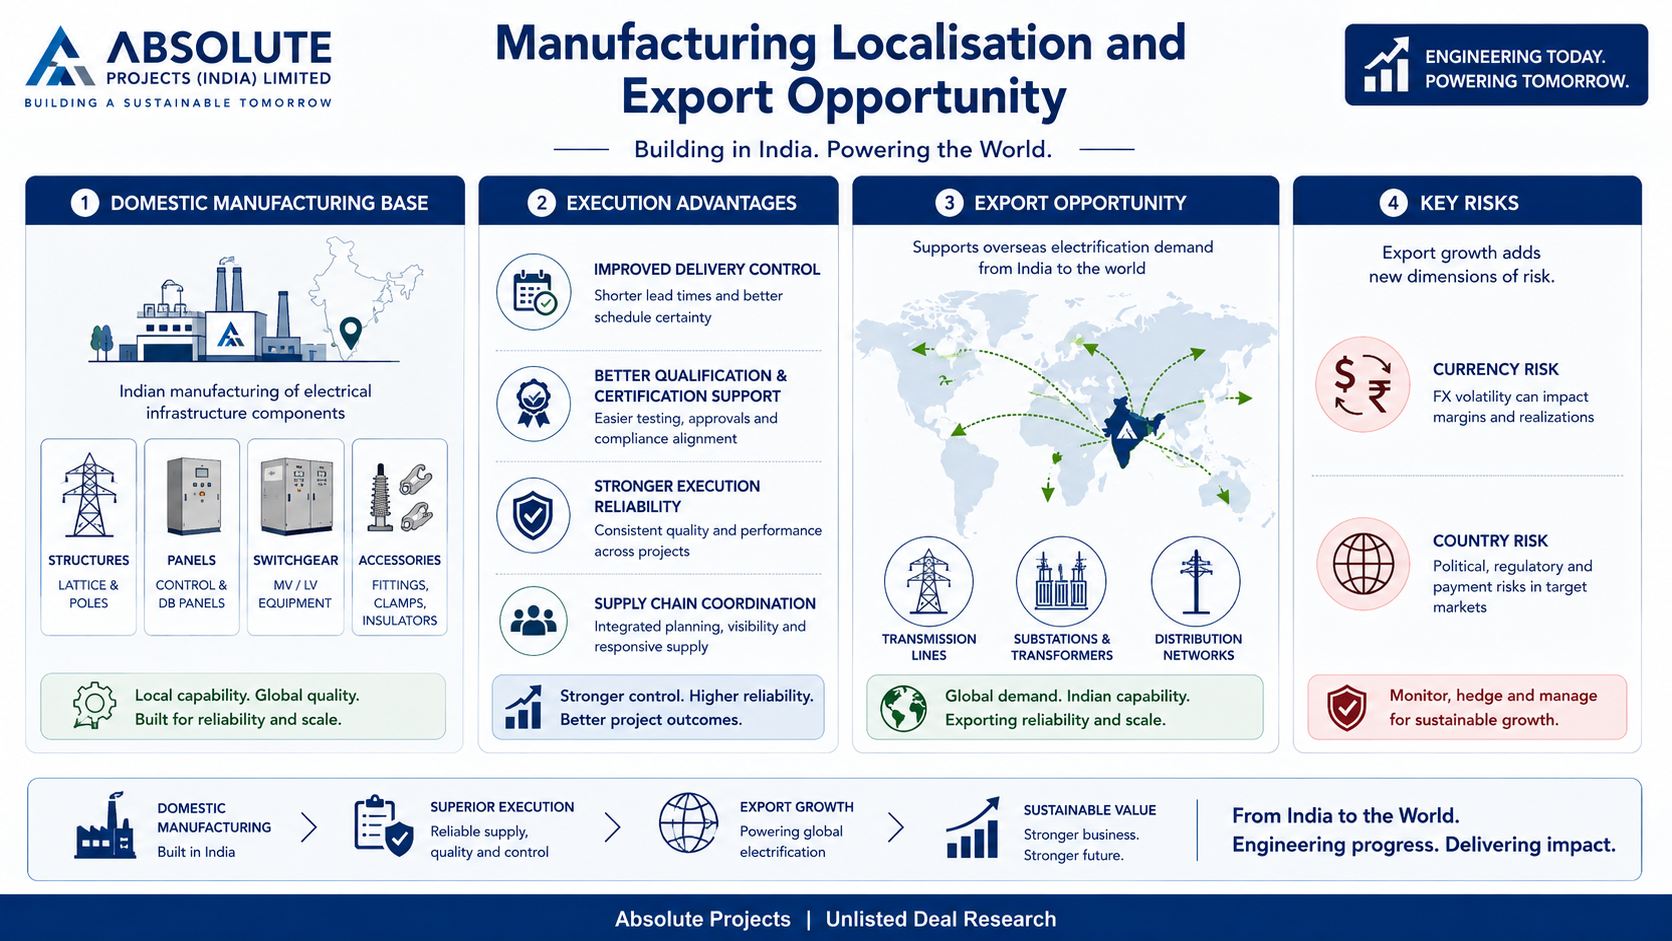
Manufacturing Localisation and Export Opportunity
Domestic production of switchgear and panels secures delivery control and strict quality qualification. Meanwhile, expanding into overseas electrification unlocks massive export potential but introduces distinct currency and country risks
Balancing these two strategies allows companies to stabilize their local supply chain while capturing global growth
Government Policy Support
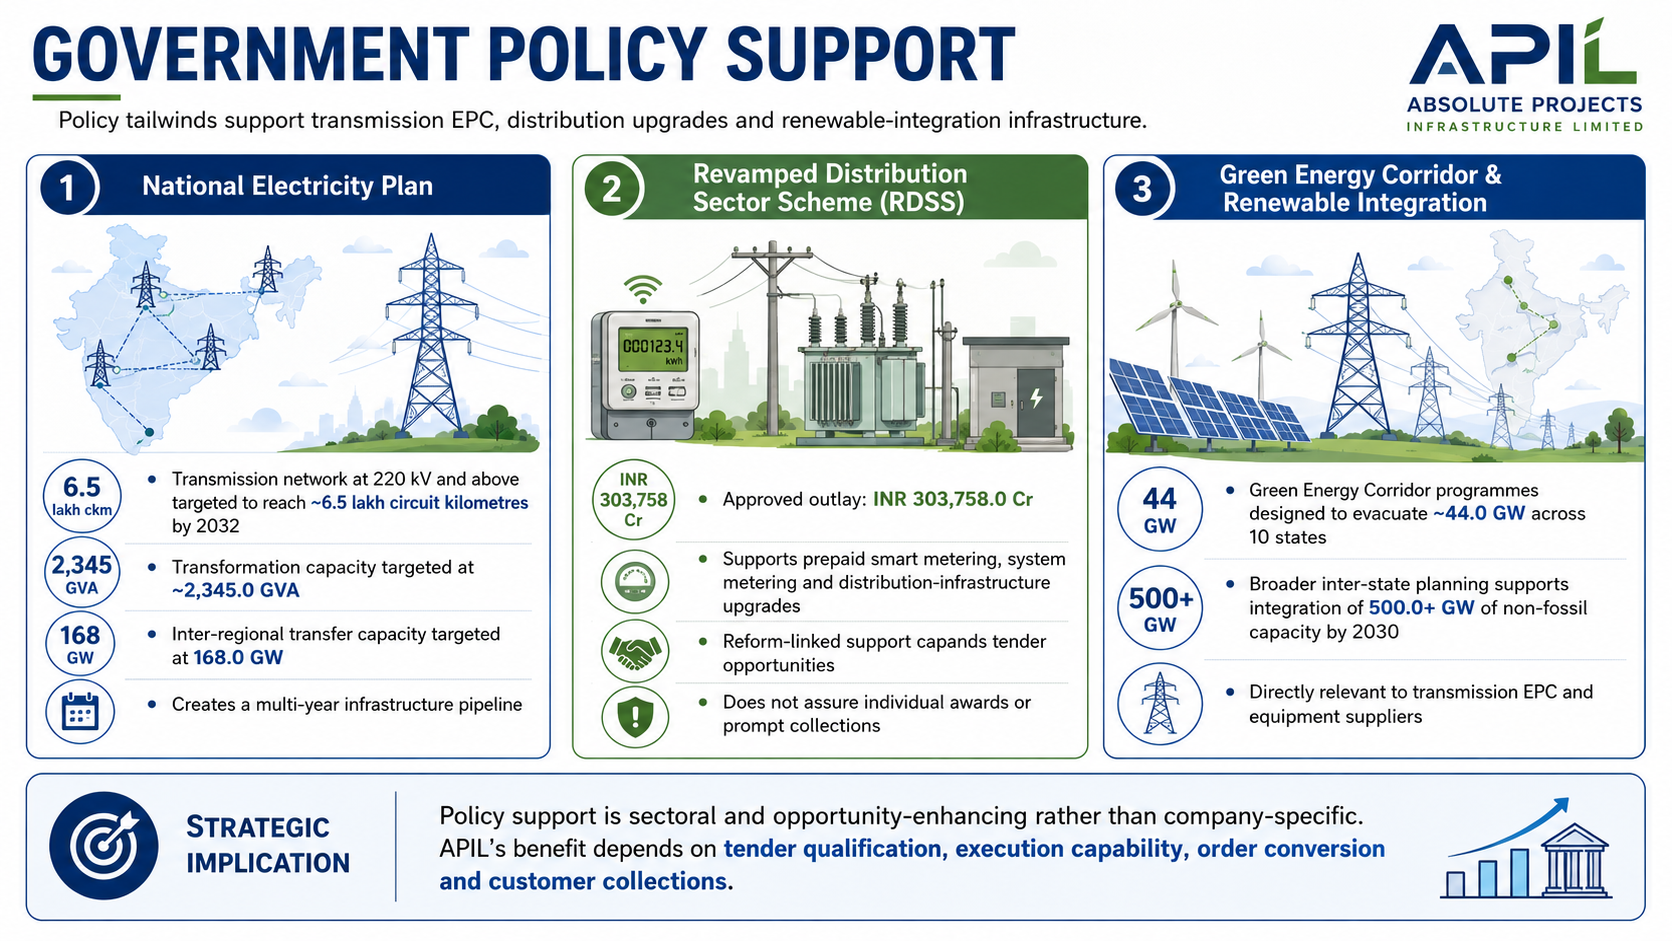
The National Electricity Plan envisages expansion of the transmission network at 220 kV and above to approximately 6.5 lakh circuit kilometres by 2032, with transformation capacity rising to about 2,345.0 GVA and inter-regional transfer capacity to 168.0 GW. This provides a multi-year infrastructure pipeline
The Revamped Distribution Sector Scheme has an approved outlay of INR 303,758.0 Cr for prepaid smart metering, system metering, distribution-infrastructure upgrades and reform-linked support. It expands the tender opportunity but does not assure individual awards or prompt collections
Green Energy Corridor programmes are designed to evacuate approximately 44.0 GW of renewable capacity across ten states, while broader inter-state planning supports integration of more than 500.0 GW of non-fossil capacity by 2030. These programmes are directly relevant to transmission EPC and equipment suppliers
- Overview
- Business
- Financial Highlights
- Industry Overview
- Documentation
Get the Preqt App and keep in touch around the clock!
 Monitor your investments in real-time.
- Receive tailored deal suggestions.
- Get real-time updates and alerts.
