


Alternicq Limited
Packaging Innovation at ScalePrecision Meets Packaging
Unlisted Review and Rating
Speculative
DRHP Not FiledOverall Recommendation
Alternicq is a high-quality operating platform currently showing weak earnings economics at a valuation that still assumes materially better future performance.
The underlying strengths are clear: revenue scale of INR 2,716.7 Cr, diversified FMCG/pharma/customer exposure, relatively low customer concentration, extensive manufacturing infrastructure, strong cash generation and an institutional ownership/governance framework. But FY26 changed the investment equation. EBITDA margin compressed to 13.6%, pre-exceptional PBT fell 68.9%, ROE declined to 3.0%, ROCE to 6.0%, and DSCR to approximately 1.0x. Gross borrowings increased to INR 1,108.8 Cr, while supplier finance reached another INR 343.9 Cr. At the same time, the unlisted share still implies approximately INR 8,336.1 Cr market capitalisation and 25.5x EV/EBITDA. That combination does not provide enough margin of safety at the current OTC price. The metric I would watch most closely in FY27 is EBITDA-margin recovery. If revenue continues growing and EBITDA margin returns toward 15.0%-16.0%, while leverage and supplier finance stop increasing, the investment case can improve substantially. Until then, I would prefer waiting rather than buying simply because the underlying Company is a strong franchise
PARAMETER
WEIGHT
SCORE
KEY FACTORS
Financial Performance
25.0%
3.0/5
Revenue remains large and cash generation strong, but FY26 profitability weakened sharply with lower EBITDA margin, ROE, ROCE and debt-service coverage
Show more
Detailed Analysis
FY26 revenue increased 5.7%, while FY24-FY26 CAGR remains respectable at 13.3%
Margin compressed from 18.3% in FY24 to 16.0% in FY25 and 13.6% in FY26
Margin compressed from 18.3% in FY24 to 16.0% in FY25 and 13.6% in FY26
D/E increased to 0.9x
ROE collapsed from approximately 20.0% to 3.0% because of the earnings deterioration
CFO remained excellent at INR 326.4 Cr, representing approximately 88.1% of EBITDA
Industry
25.0%
3.0/5
Alternicq benefits from steady rigid-plastic packaging demand, diversified end-markets and sustainability-led formalisation, though sector growth is moderate and competition remains intense
Show more
Detailed Analysis
Indian rigid-plastic packaging is projected to grow around 6.2% CAGR through 2031
Organized packaging continues to benefit from FMCG, pharma, food, beverage and convenience-consumption growth
EPR and recycled-content requirements create cost pressure but favour organized, compliant converters with recycling capabilities
Management
25.0%
4.0/5
Professional institutional ownership, experienced leadership and clean audit opinions support governance, but sizeable related-party transactions and pending group amalgamations warrant monitoring
Show more
Detailed Analysis
Nearly four decades of operating history, institutional ownership and a professional management structure support execution capability
Three of seven FY26 directors were independent, including an independent woman director
Large RPT authorisations and pending group amalgamations require monitoring despite arm's-length disclosures
Valuation Metrics
25.0%
1.0/5
Current unlisted valuation looks expensive versus listed packaging peers, with elevated P/E, EV/EBITDA and P/B multiples despite weak FY26 return ratios
Show more
Detailed Analysis
FY26 P/E of 180.3x is exceptionally high versus listed packaging peers
25.5x is approximately double or more than several comparable listed packaging businesses
P/B of 5.8x is difficult to justify against FY26 ROE of only 3.0%
TOTAL
100%
2.8/5
Weighted Composite Score
Per Share Price
₹777.0
As of 25 Oct 2026
Lot Size
10.0 Shares
Minimum Investment
₹7,770.0 / 10 shares
Market Cap. (₹ Cr)
Revenue FY’26
PAT FY’26
P/E Multiple
Face Value
₹ 2.0Lot Size
10.0 sharesSale Type
Secondary SalePAT FY’26
₹ 46.3 CrPAT Margin (%)
1.7 %P/E Multiple
180.3xCAGR Growth 3Y
9.0 %ROE (FY’26)
3.2 %ROCE (FY’26)
5.1 %Price to Book Value ratio
5.8xDebt/Equity (FY’26)
0.6xMerchant banker appointed
❌ NoCompany Website
www.alternicq.comDisclaimer: Unlisted shares are unregulated & illiquid. This is NOT investment advice. Please do your own due diligence before investing.
Minimum Investment
₹7,770.0 / 10 sharesShares Lot 10 X 1
Investment amount
₹7,770.0
Overview
Business
Business Model
Geographical Presence
Sales Channel
Clients
Financial Highlights
Income Statement
Revenue growth with EBITDA and PAT margins
| Financial Metric | FY 2024 | FY 2025 | FY 2026 |
|---|---|---|---|
| Revenue (₹ Cr) | 2,117.0 | 2,569.8 | 2,716.7 |
| Growth (%) | 1.0% | 21.4% | 5.7% |
| EBITDA (₹ Cr) | 373.3 | 397.2 | 361.1 |
| EBITDA Margin (%) | 17.6% | 15.5% | 13.3% |
| PAT (₹ Cr) | 140.8 | 247.6 | 46.3 |
| PAT Margin (%) | 6.7% | 9.6% | 1.7% |
OBSERVATIONS & INSIGHTS
Revenue increased by 21.4% in FY25, followed by 5.7% growth in FY26 to INR 2,716.7 Cr. The Company continued expanding its sales base, although the pace of growth slowed considerably
EBITDA increased by 6.4% in FY25 but declined by 9.1% to INR 361.1 Cr in FY26. EBITDA margin contracted from 17.6% in FY24 to 15.5% in FY25 and 13.3% in FY26, indicating weaker operating profitability despite higher revenue/
PAT increased by 75.9% in FY25 to INR 247.6 Cr, supported by an exceptional gain of INR 184.4 Cr from extinguishment of financial liabilities. FY26 PAT declined by 81.3% to INR 46.3 Cr, reflecting the absence of this gain and weaker operating earnings
FY26 depreciation of INR 223.1 Cr and finance costs of INR 119.3 Cr substantially absorbed operating earnings. PAT margin fell to 1.7%, despite a net tax credit of INR 21.9 Cr supporting the reported bottom line
Balance Sheet
| Financial Metric | FY 2024 | FY 2025 | FY 2026 |
|---|---|---|---|
| EQUITY & LIABILITIES | ₹ 2,284.3 Cr | ₹ 3,205.4 Cr | ₹ 3,354.6 Cr |
| Net Worth | ₹ 1,008.1 Cr | ₹ 1,411.0 Cr | ₹ 1,443.1 Cr |
| Share Capital | ₹ 13.7 Cr | ₹ 17.3 Cr | ₹ 19.0 Cr |
| Reserves & Surplus | ₹ 994.4 Cr | ₹ 1,393.7 Cr | ₹ 1,424.1 Cr |
| Total Liabilities | ₹ 1,276.2 Cr | ₹ 1,794.4 Cr | ₹ 1,911.5 Cr |
| Current Liabilities | ₹ 708.5 Cr | ₹ 1,219.5 Cr | ₹ 1,191.4 Cr |
| Borrowings | ₹ 369.2 Cr | ₹ 608.6 Cr | ₹ 554.7 Cr |
| Trade Payables | ₹ 276.2 Cr | ₹ 178.7 Cr | ₹ 193.7 Cr |
| Other Current Liabilities | ₹ 63.1 Cr | ₹ 432.2 Cr | ₹ 443.0 Cr |
| Non-Current Liabilities | ₹ 567.7 Cr | ₹ 574.9 Cr | ₹ 720.1 Cr |
| Borrowings | ₹ 384.4 Cr | ₹ 382.4 Cr | ₹ 554.1 Cr |
| Other Non-Current Liabilities | ₹ 183.3 Cr | ₹ 192.5 Cr | ₹ 166.0 Cr |
| ASSETS | ₹ 2,284.4 Cr | ₹ 3,205.3 Cr | ₹ 3,354.6 Cr |
| Current Assets | ₹ 757.1 Cr | ₹ 1,200.7 Cr | ₹ 1,338.7 Cr |
| Trade Receivables | ₹ 301.1 Cr | ₹ 423.7 Cr | ₹ 445.7 Cr |
| Inventory | ₹ 353.6 Cr | ₹ 533.5 Cr | ₹ 570.7 Cr |
| Cash & Cash Equivalents | ₹ 24.4 Cr | ₹ 113.3 Cr | ₹ 135.6 Cr |
| Other Current Assets | ₹ 78.0 Cr | ₹ 130.2 Cr | ₹ 186.7 Cr |
| Non-Current Assets | ₹ 1,527.3 Cr | ₹ 2,004.6 Cr | ₹ 2,015.9 Cr |
| Fixed Assets | ₹ 1,198.9 Cr | ₹ 1,655.1 Cr | ₹ 1,649.1 Cr |
| Other Non-Current Assets | ₹ 328.4 Cr | ₹ 349.5 Cr | ₹ 366.8 Cr |
OBSERVATIONS & INSIGHTS
The Company’s total assets increased from INR 2,284.3 Cr in FY24 to INR 3,354.7 Cr in FY26, with most expansion occurring in FY25. Fixed assets eased slightly to INR 1,649.1 Cr in FY26
Net worth increased from INR 1,411.1 Cr in FY25 to INR 1,443.1 Cr in FY26, while total liabilities rose from INR 1,794.3 Cr to INR 1,911.6 Cr. Liabilities contributed more than equity to the latest balance sheet expansion
Non-current borrowings increased from INR 382.4 Cr in FY25 to INR 554.1 Cr in FY26, while current borrowings declined from INR 608.6 Cr to INR 554.7 Cr, indicating a shift towards longer borrowing maturities
The current ratio improved from 1.0x in FY25 to 1.1x in FY26, indicating a modest liquidity cushion. However, inventory of INR 570.7 Cr and receivables of INR 445.7 Cr kept substantial funds tied up in working capital
Cash Flow
| Financial Metric | FY 2024 | FY 2025 | FY 2026 |
|---|---|---|---|
CFO (₹ Cr) Cash generated from core business operations. | +352.4 Cr | +343.5 Cr | +326.4 Cr |
CFI (₹ Cr) Cash used for investments and long-term assets. | -149.3 Cr | -737.9 Cr | -232.0 Cr |
CFF (₹ Cr) Cash flow related to funding and borrowings. | -257.1 Cr | +483.3 Cr | -72.1 Cr |
Working Capital
| Efficiency Metric | FY 2023 | FY 2024 | FY 2025 |
|---|---|---|---|
Debtor Days Average number of days taken to collect customer payments. | - | - | - |
Creditor Days Average time taken to pay suppliers and vendors. | - | - | - |
Inventory Days Average number of days inventory remains unsold. | - | - | - |
CCC (Cash Conversion Cycle) (Debtor Days + Inventory Days - Creditor Days) | - | - | - |
Financial Ratios
Measures the company’s leverage relative to shareholder equity.
OBSERVATIONS & INSIGHTS
Coverage declined from 2.4x in FY24 to 1.6x in FY25 and 1.2x in FY26. Operating earnings now provide limited headroom above finance costs, increasing sensitivity to further margin pressure or higher borrowing costs
Operating ROCE declined from 11.4% in FY24 to 7.7% in FY25 and 5.1% in FY26. This indicates that operating profitability weakened relative to the equity, borrowings and leases employed in the business
ROE increased from 14.4% in FY24 to 20.5% in FY25 before falling to 3.2% in FY26. ROA similarly moved from 6.2% to 7.7% and then 1.4%. FY25 returns benefited from the exceptional liability-extinguishment gain, limiting comparability with recurring operating performance
Debt-to-equity stood at 0.9x in FY24, 0.8x in FY25 and 0.9x in FY26. Although broadly stable, weaker earnings reduced the capacity to service this funding. These ratios include leases but exclude supplier finance; including supplier finance increases FY26 debt-to-equity to 1.1x
The current ratio improved from 1.0x in FY25 to 1.1x in FY26, matching FY24. This provides only a modest cushion of current assets over current liabilities, making inventory conversion, timely collections and continued funding availability important
Industry Overview
Industry Drivers
Packaged consumption and repeat replenishment
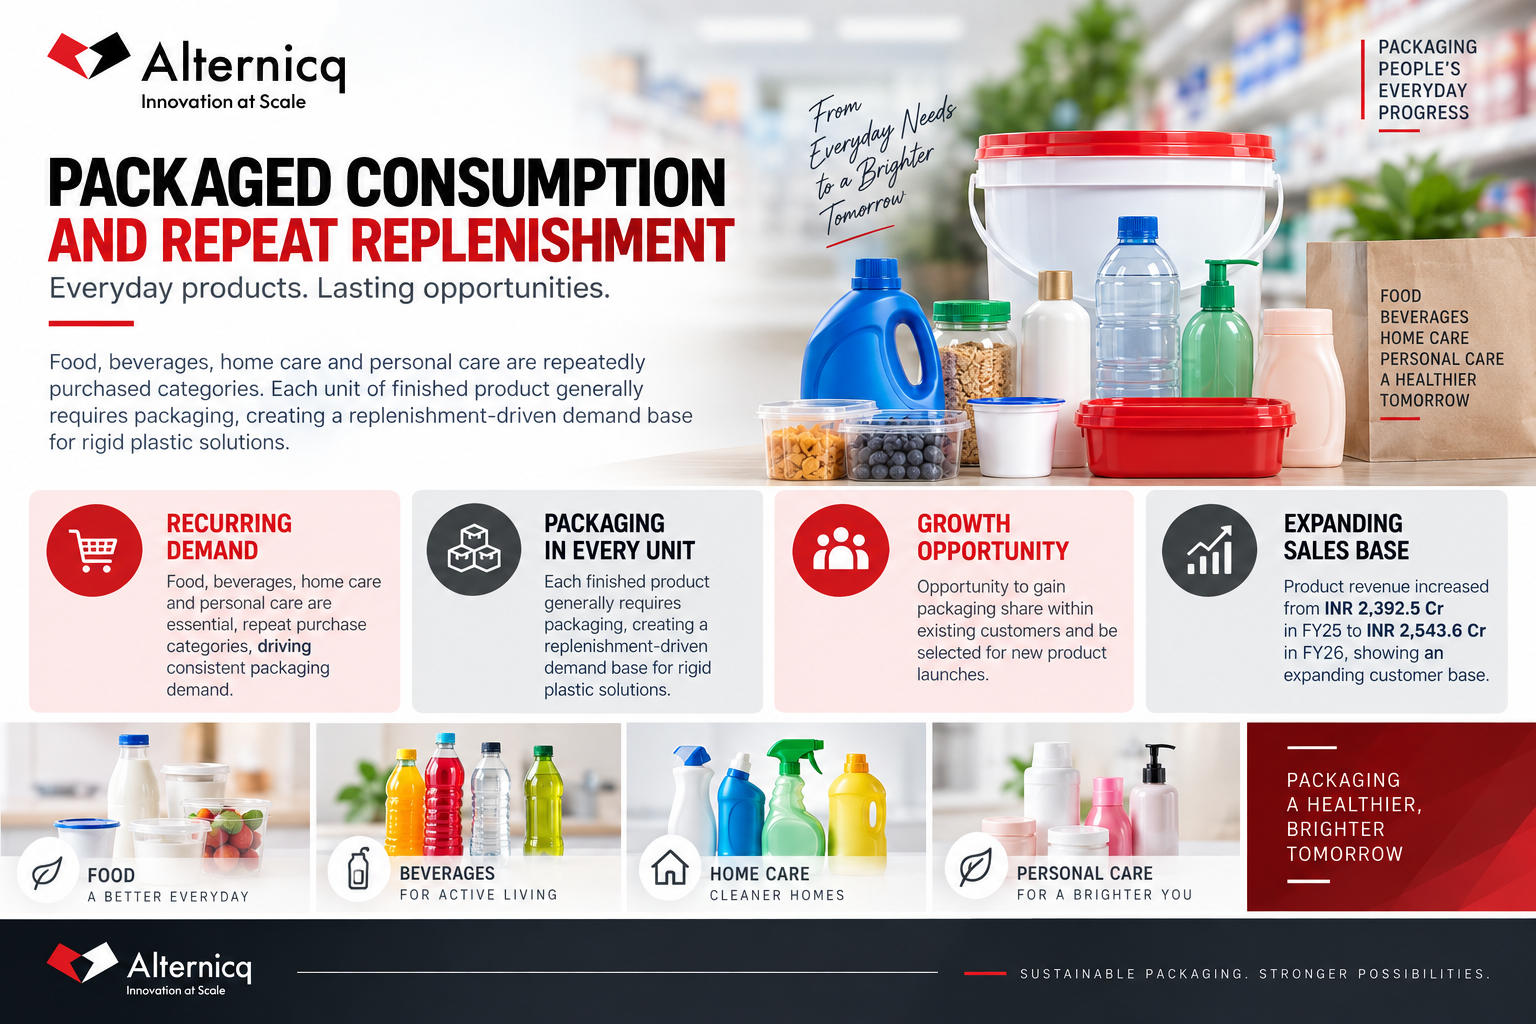
Food, beverages, home care and personal care are repeatedly purchased categories. Each unit of finished product generally requires packaging, creating a replenishment-driven demand base. For the Company, the opportunity is to gain packaging share within customers and be selected for new product launches
Demand is strongest economically when it improves capacity utilisation and repeat order density. New customers can still require mould investment, qualification runs and credit before generating adequate returns. FY26 product revenue increased to INR 2,543.6 Cr from INR 2,392.5 Cr, showing an expanding sales base without demonstrating the separate contributions of volume, price and acquisitions
Supplier consolidation and national brand procurement
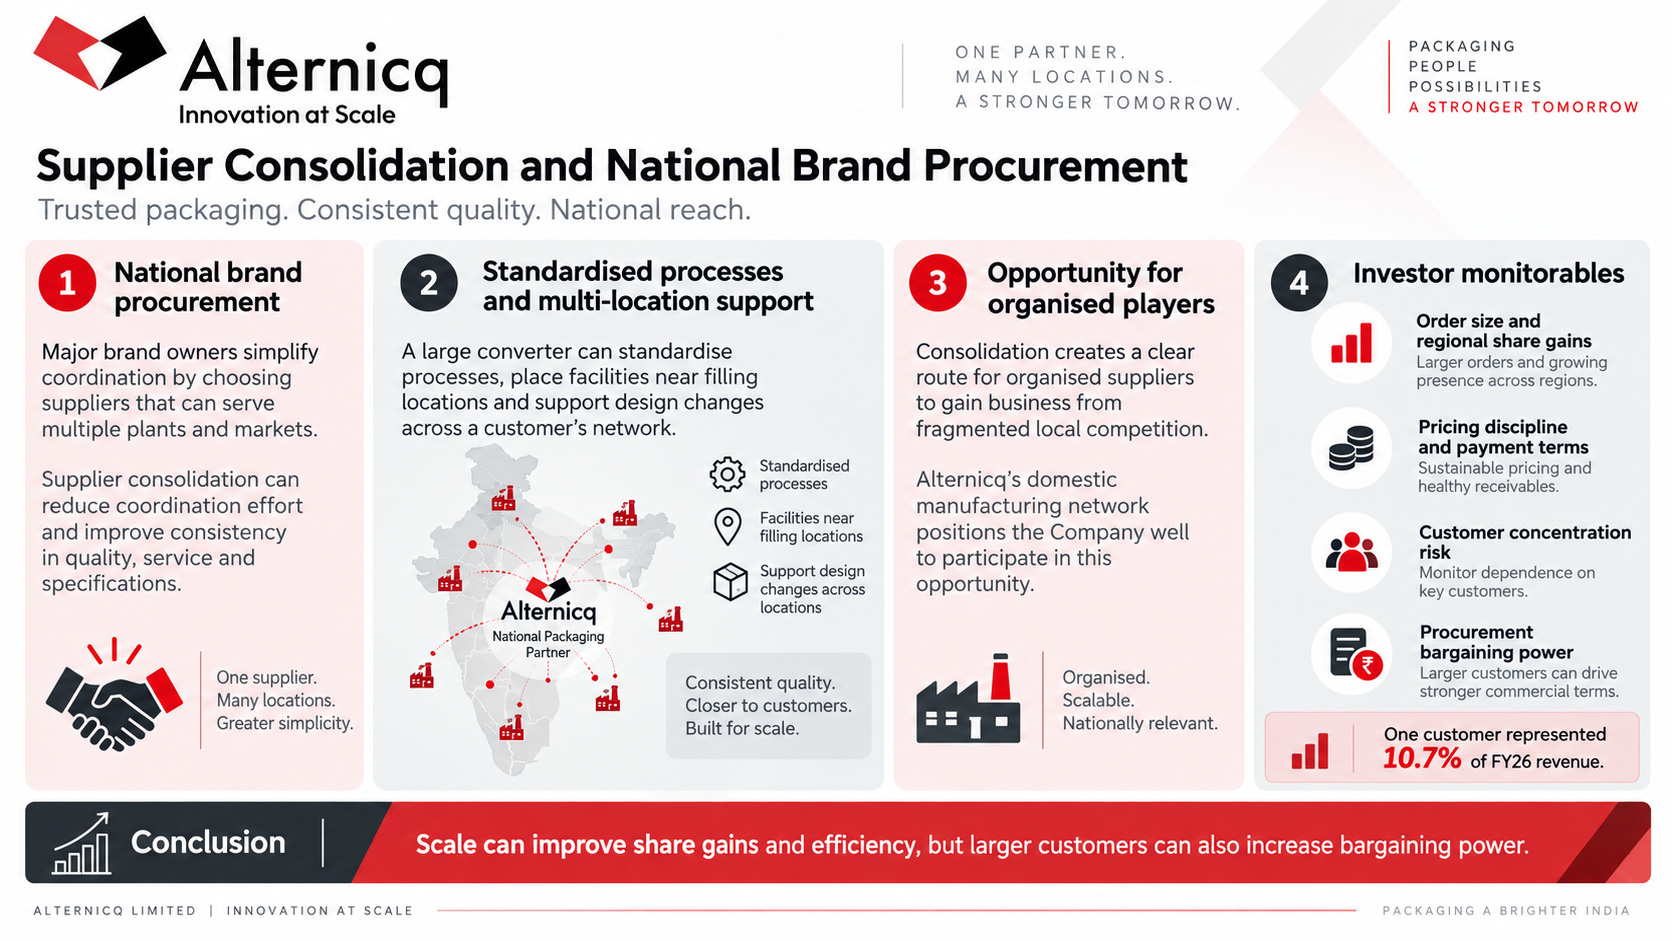
Brand owners can reduce coordination effort by using suppliers able to provide consistent packaging across regions. A large converter can standardise processes, place facilities near filling locations and support design changes across a customer’s network. This creates a route for organised suppliers to gain business from fragmented local competition
The Company’s domestic manufacturing network is relevant to this opportunity. The key test is whether larger orders come with acceptable pricing and payment terms; concentration can rise as national customers become more important. One customer already represented 10.7% of FY26 revenue, so scale benefits must be weighed against procurement bargaining power
Premiumisation, dispensing and packaging design
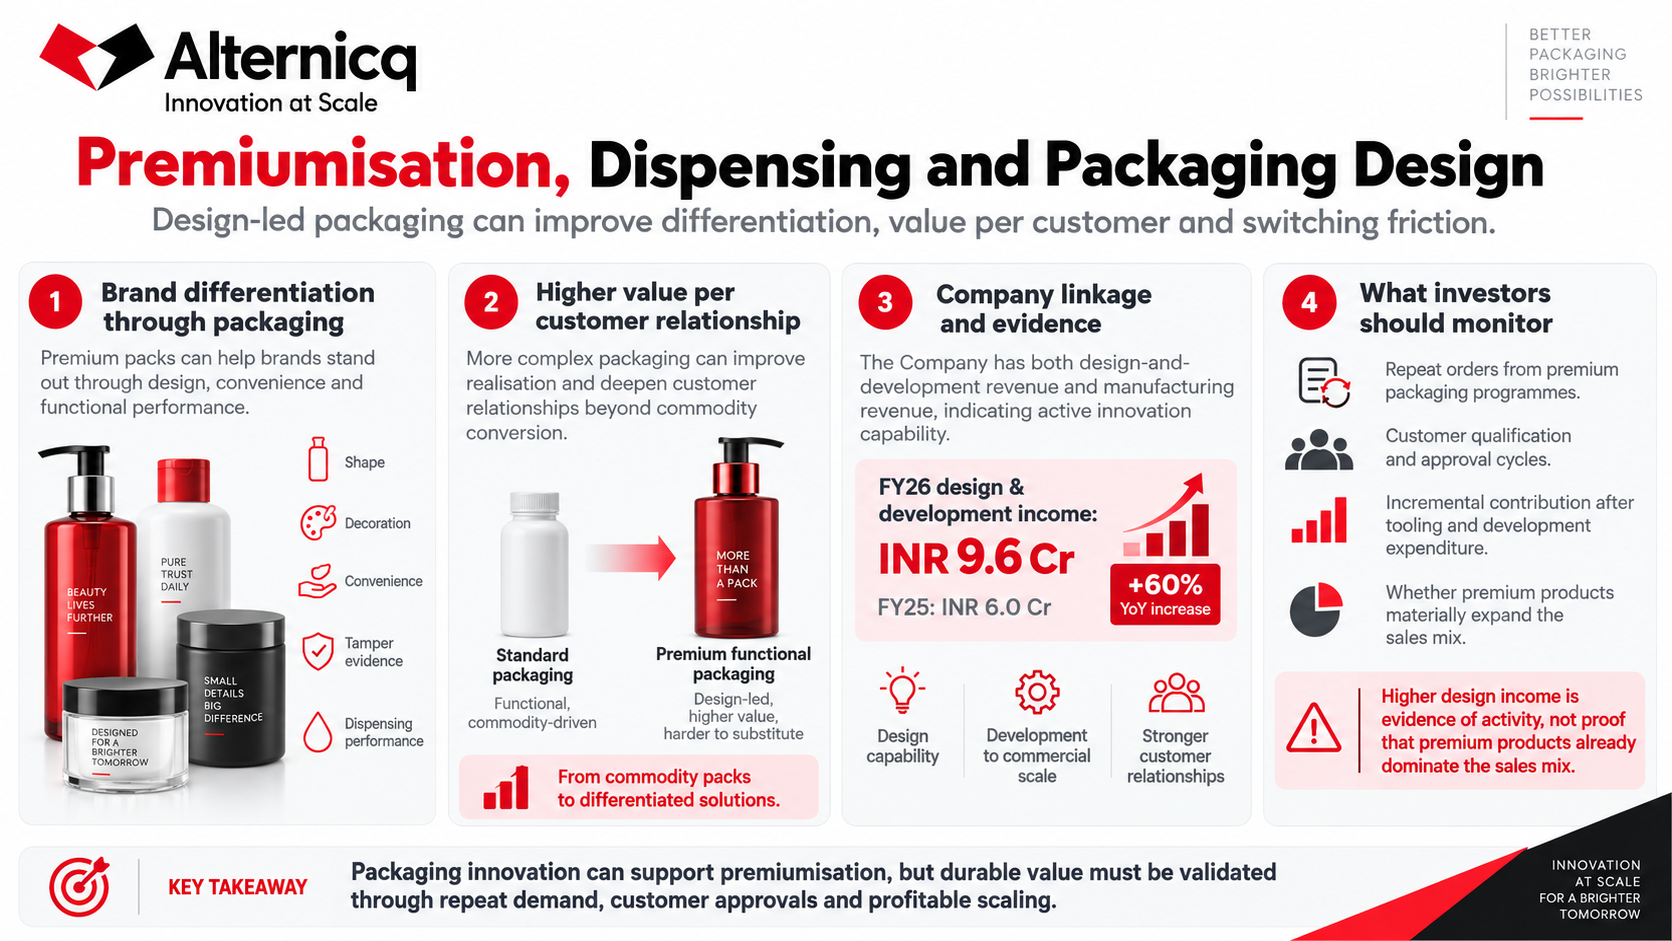
A pack can differentiate a brand through shape, decoration, convenience, tamper evidence and dispensing performance. More technically demanding products can increase the value supplied per customer relationship and reduce substitution based only on resin cost
The Company has design and development revenue as well as manufacturing revenue, and its historical sustainability report describes innovation and tool-development capabilities. FY26 design and development income increased to INR 9.6 Cr from INR 6.0 Cr. This is evidence of activity, not proof that premium products already dominate the sales mix. The necessary commercial evidence is repeat orders, customer qualification and incremental contribution after tooling and development expenditure
Government Policy Support
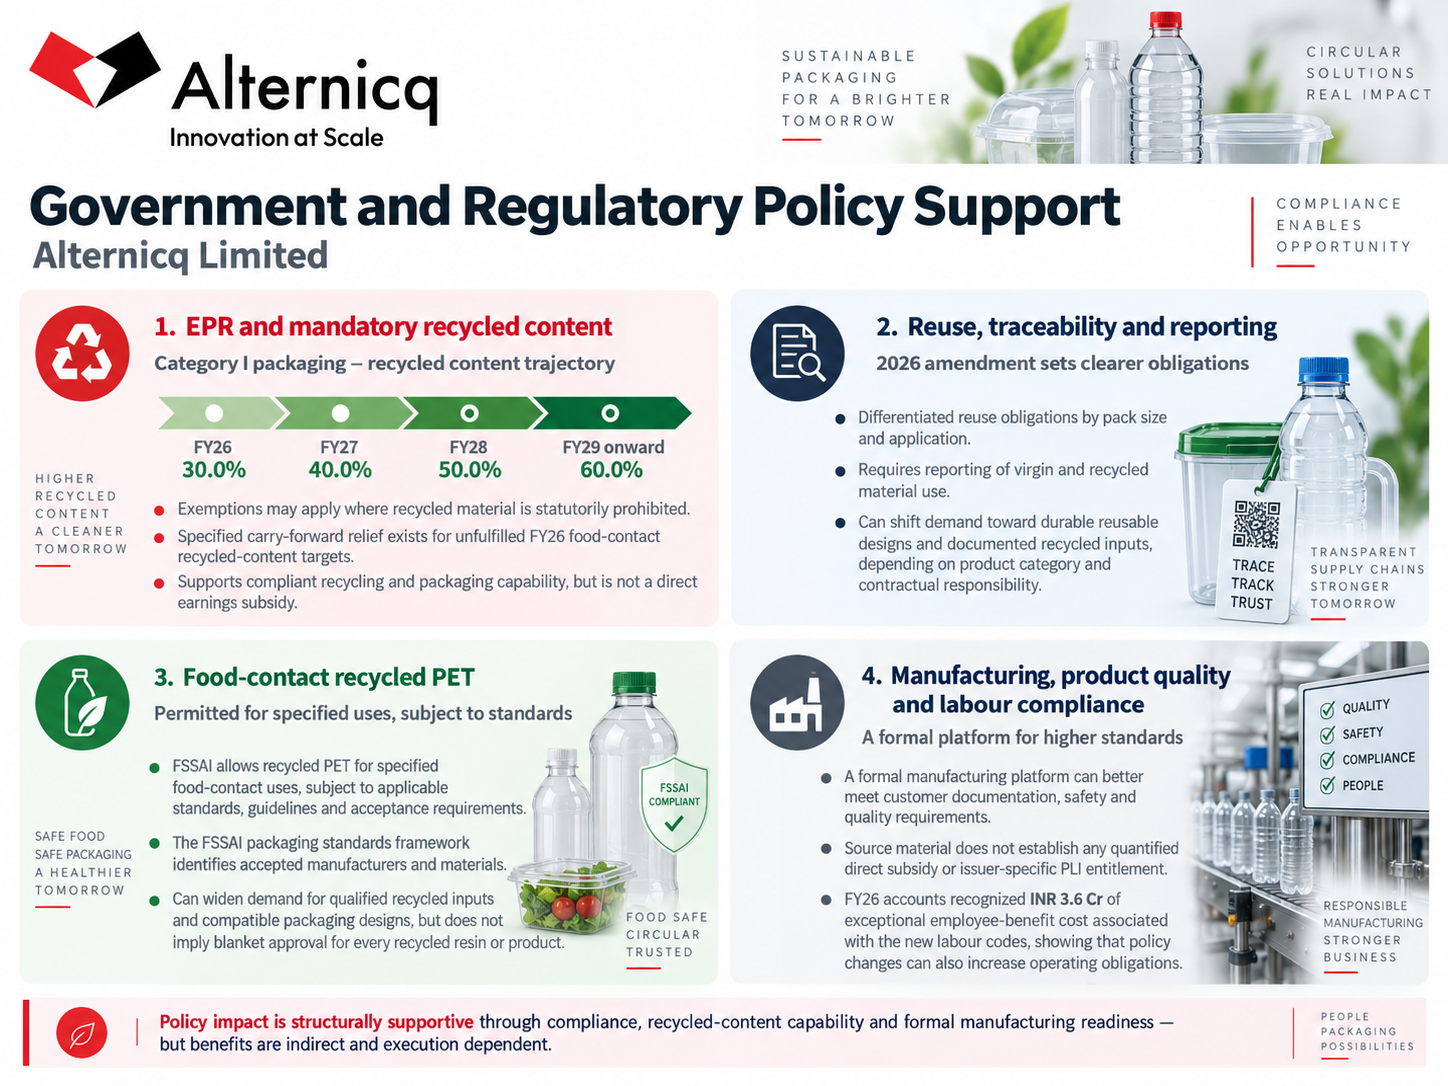
The March 2026 amendment specifies Category I recycled-content targets of 30.0% in FY26, 40.0% in FY27, 50.0% in FY28 and 60.0% from FY29. Statutory prohibitions on recycled material can provide exemptions, subject to disclosure. The amendment also permits specified carry-forward relief for unfulfilled FY26 food-contact recycled-content targets. These provisions support compliant recycling and packaging capability but are not a direct earnings subsidy/
The amendment sets differentiated reuse obligations by pack size and application and requires reporting of virgin and recycled material use. For a packaging manufacturer, customer demand can shift toward durable reusable designs and documented recycled inputs. The effect depends on its contractual responsibilities and the relevant product category
FSSAI allows recycled PET for specified food-contact uses subject to applicable standards, guidelines and acceptance requirements. Its packaging standards page identifies accepted manufacturers and materials. This can widen demand for qualified recycled inputs and compatible packaging designs; it does not provide blanket permission for every recycled resin or product. No company-specific food-contact approval is assumed here without the exact approval document
The commercial benefit of a formal manufacturing platform is the ability to meet customer documentation, safety and quality requirements. The source files do not establish a quantified direct subsidy or an issuer-specific PLI entitlement, so none is included in earnings. The FY26 accounts recognised INR 3.6 Cr of exceptional employee-benefit cost associated with the new labour codes, illustrating that policy changes can also increase operating obligations
- Overview
- Business
- Financial Highlights
- Industry Overview
- Documentation
Get the Preqt App and keep in touch around the clock!
 Monitor your investments in real-time.
- Receive tailored deal suggestions.
- Get real-time updates and alerts.
