


Annu Projects
Building Utility NetworksExecuting Critical Infrastructure
IPO Review Rating
Above Avg
MainboardBuilding Critical Utility Infrastructure for India’s Growing Urban Economy
Annu Projects is a profitable, high-ROE EPC platform with strong order-book visibility and an unusually clean 100% fresh IPO structure, but the quality of its cash conversion deserves considerably more attention than the headline growth numbers. The core operating numbers are attractive: INR 241.2 Cr FY26 revenue, INR 50.2 Cr EBITDA, INR 33.0 Cr PAT, 20.8% EBITDA margin, 13.7% PAT margin, 21.3% ROE and 0.3x D/E. The INR 1,005.1 Cr June 2026 order book, equivalent to approximately 4.2x FY26 revenue, provides substantial execution visibility. The biggest weakness is working-capital intensity. Despite INR 33.0 Cr of FY26 PAT, operating cash flow remained slightly negative, following INR -35.4 Cr in FY25. Receivable accumulation is the key reason, and the fact that INR 115.0 Cr of the IPO proceeds is specifically being raised for working capital confirms that this is a structural funding requirement rather than a minor accounting fluctuation. Customer concentration is the second major concern. The mechanical framework only penalises the largest customer at 26.6%, but economically the more relevant figure is that the Top 10 account for 97.9% of FY26 revenue. Combined with 57.1% dependence on government-sector entities, this increases exposure to project delays, contract renewals, collections and tender wins.
PARAMETER
WEIGHT
SCORE
KEY FACTORS
Financial Performance
40.0%
4.0/5
Annu combines 25.2% 2 year revenue CAGR, 20.8% EBITDA margin, 13.7% PAT margin, 21.3% ROE and manageable 0.3x leverage, supported by an order book exceeding four times FY26 revenue.
Show more
Detailed Analysis
Revenue from operations increased from INR 154.0 Cr in FY24 to INR 180.1 Cr in FY25 and INR 241.2 Cr in FY26, representing a FY24–FY26 CAGR of approximately 25.2%
EBITDA increased from INR 28.5 Cr in FY24 to INR 32.2 Cr in FY25 and INR 50.2 Cr in FY26, while EBITDA margin expanded to 20.8% from 18.5% in FY24
PAT increased from INR 17.4 Cr in FY24 to INR 21.1 Cr in FY25 and INR 33.0 Cr in FY26, with FY26 PAT margin improving to 13.7%
FY26 gross borrowings were approximately INR 52.5 Cr against equity of INR 155.3 Cr, resulting in D/E of approximately 0.3x
ROE stood at 25.2% in FY24, 17.3% in FY25 and 21.3% in FY26
OCF was INR -35.4 Cr in FY25 and remained marginally negative at INR -0.2 Cr in FY26, despite FY26 PAT of INR 33.0 Cr
The largest customer contributed 26.6% of FY26 revenue, while the Top 10 customers together accounted for an exceptionally high 97.9%
Industry
15.0%
3.0/5
Annu operates in structurally attractive but competitive infrastructure verticals. The industry does not qualify as hyper-growth, but the combination of telecom fibre, wastewater, gas networks and railway signalling provides a long project runway.
Show more
Detailed Analysis
Telecom, representing 41.50% of FY26 revenue, is expected to grow at approximately 8–9% CAGR, while water/wastewater, relevant to the 52.7% sewerage vertical, is projected at approximately 10.2% CAGR
BharatNet, 5G/6G fibre rollout, wastewater treatment investment, urbanisation, natural-gas infrastructure and railway modernisation continue to create incremental project opportunities
Government infrastructure programmes support demand, while tender conditions, environmental/forest clearances, Right-of-Way and local approvals can delay execution
Management
15.0%
4.0/5
Management quality is above average. Promoters have more than two decades of relevant operating experience, the Board is 50.0% independent, there is no promoter OFS, and promoter litigation is minor.
Show more
Detailed Analysis
Sanjay Kumar Sarraf has 23+ years of experience and has been associated with Annu since inception, while Krishna Ranjan has 23+ years of telecom-industry experience
The Board has 6 Directors, including 3 Independent Directors, resulting in exactly 50.0% independent representation
The two Promoters collectively face 3 tax proceedings, with no criminal, regulatory, SEBI disciplinary or material civil proceedings disclosed
FY26 disclosed operating and remuneration-related transactions are estimated at approximately INR 13.9 Cr, or around 5.8% of FY26 revenue, excluding loans, advances and balance-sheet-only items
The entire INR 175.1 Cr issue is fresh capital, with INR 0.0 Cr OFS.
Valuation
20.0%
4.0/5
Valuation is mixed but overall reasonable. Historical P/E of 14.3x is attractive relative to the RHP peer average and RoNW of 21.3% provides earnings support.
Show more
Detailed Analysis
At INR 99.0, historical FY26 P/E is approximately 14.3x versus the RHP-disclosed peer average of approximately 20.1x, representing a discount of approximately 28.8%
Annu trades at approximately 13.8x EV/EBITDA versus a selected current peer average of approximately 12.4x, giving a peer/Annu ratio of approximately 0.9x
INR 99.0 divided by FY26 NAV of INR 32.5 implies approximately 3.0x P/B
FY26 RoNW stood at 21.27%, comfortably above the top threshold
Merchant Banker Track Record
10.0%
4.0/5
The only recent disclosed transaction performed exceptionally well on both listing return and subscription. However, one transaction is not sufficient evidence of a deep, repeatable mainboard execution franchise.
Show more
Detailed Analysis
Globe Civil Projects opened at INR 91.1 versus INR 71.0 issue price, representing approximately 28.3% listing gains
Globe Civil Projects was subscribed approximately 86.0x
The available sample has technically delivered a positive listing in 1 of 1 transactions, giving a mechanical success rate of 100.0%
The BRLM has limited disclosed recent execution history: Only one completed IPO appears in the RHP's three-year track-record table
TOTAL
100%
3.9/5
Weighted Composite Score
Issue Price
₹94.0 to ₹99.0
As of 29 Aug 2026
GMP
₹0.0
As of 29 Aug 2026
Estimated Gain / Loss
0.0%
Lot Size
151.0 Shares
Grey Market Premium (GMPs) are shared for knowledge purpose only. PrEqt doesn’t promote or execute the trades.
| Issue Size (in Cr) | |
|---|---|
| Overall | ₹175.0 Cr |
| Fresh Issue | ₹175.0 Cr |
| Offer for Sale | ₹0.0 Cr |
Minimum Investment
₹14,949.0 / 22,801 shares

Merchant Banker
Mefcom Capital Markets Ltd.
IPO Document
RHP / Anchor Document
Offer Start Date
25th Aug 2026
Offer End Date
28th Aug 2026
Valuation
₹648.4 Cr
Revenue (FY'26)
₹244.6 Cr
PAT (FY'26)
₹33.0 Cr
Issue Size (in Cr)
₹175.0 Cr
Face Value
₹ 10.0Offer Price
₹ 99.0Lot Size
151.0 sharesSale Type
Fresh capital onlyPAT (FY'26)
₹ 33.0 CrPAT Margin (FY'26)
13.7 %P/E Multiple
14.3xEBITDA (FY'26)
₹ 50.2 CrCAGR Growth 2Y
25.2 %ROE (FY'26)
21.3 %ROCE (FY'26)
22.7 %Price to Book Value
3.0xDebt/Equity
0.3xCompany Website
www.annuprojects.comExplore new deals
Overview
Fund Allocation
Total: ₹0 CrSource:Company DRHP
Timeline
IPO Open Date
To Be Announced
IPO Close Date
To Be Announced
Tentative Allotment
To Be Announced
Initiation of Refunds
To Be Announced
Credit of Shares to Demat
To Be Announced
Tentative Listing Date
To Be Announced
Business
Business Model
Geographical Presence
Sales Channel
Key Risk Factor
Financial Highlights
Income Statement
Revenue growth with EBITDA and PAT margins
| Financial Metric | FY 2024 | FY 2025 | FY 2026 |
|---|---|---|---|
| Revenue (₹ Cr) | 155.4 | 182.4 | 244.6 |
| Growth (%) | - | 16.9% | 34.0% |
| EBITDA (₹ Cr) | 28.5 | 32.2 | 50.2 |
| EBITDA Margin (%) | 18.5% | 17.9% | 20.8% |
| PAT (₹ Cr) | 17.4 | 21.1 | 33.0 |
| PAT Margin (%) | 11.3% | 11.7% | 13.7% |
OBSERVATIONS & INSIGHTS
Revenue increased 16.9% in FY25 and 34.0% in FY26. FY26 acceleration came from higher EPC service execution, with sewerage and telecom contributing the majority of incremental billing; FY24-FY26 revenue CAGR was ~25.2%
EBITDA increased from INR 28.5 Cr in FY24 to INR 50.2 Cr in FY26. Margin dipped to 17.9% in FY25 as material/traded-goods costs rose with project mix, then recovered to 20.8% in FY26 as revenue scaled faster than operating overheads and gross profit improved
PAT increased from INR 17.4 Cr to INR 33.0 Cr over FY24-FY26. FY26 PAT grew faster than revenue because operating margin improved and finance cost increased only modestly relative to PBT growth
Balance Sheet
| Financial Metric | FY 2024 | FY 2025 | FY 2026 |
|---|---|---|---|
| Net Worth | ₹ 68.9 Cr | ₹ 122.1 Cr | ₹ 155.3 Cr |
| Total Assets | ₹ 161.3 Cr | ₹ 233.4 Cr | ₹ 341.8 Cr |
| Total Borrowing | ₹ 19.7 Cr | ₹ 22.3 Cr | ₹ 52.5 Cr |
| Reserves & Surplus | ₹ 66.4 Cr | ₹ 74.3 Cr | ₹ 107.5 Cr |
OBSERVATIONS & INSIGHTS
Total Equity increased from INR 68.9 Cr in FY24 to INR 122.1 Cr in FY25 due to equity allotments, bonus capitalisation and retained earnings. It rose further to INR 155.3 Cr in FY26 primarily through retained PAT, improving the absolute equity cushion despite higher leverage
Total Assets expanded from INR 161.3 Cr to INR 341.8 Cr over two years. The main driver was trade receivables and unbilled revenue, while FY26 also included a large increase in PPE following approximately INR 22.9 Cr of capital expenditure
Total Borrowings increased from INR 19.7 Cr in FY24 to INR 52.5 Cr in FY26, with most of the FY26 increase in current borrowings. The rise funded a much larger receivable/unbilled-revenue base and the FY26 capex programme
Reserves & Surplus increased from INR 66.4 Cr to INR 74.2 Cr in FY25 despite PAT because a large portion of reserves was capitalised into bonus equity shares; it then rose to INR 107.5 Cr in FY26 as profits were retained and share capital remained unchanged
Cash Flow
| Financial Metric | FY 2024 | FY 2025 | FY 2026 |
|---|---|---|---|
CFO (₹ Cr) Cash generated from core business operations. | +8.2 Cr | -35.4 Cr | -0.2 Cr |
CFI (₹ Cr) Cash used for investments and long-term assets. | -3.9 Cr | -1.4 Cr | -23.4 Cr |
CFF (₹ Cr) Cash flow related to funding and borrowings. | -4.0 Cr | +34.3 Cr | +26.1 Cr |
Working Capital
| Efficiency Metric | FY 2023 | FY 2024 | FY 2025 |
|---|---|---|---|
Debtor Days Average number of days taken to collect customer payments. | - | - | - |
Creditor Days Average time taken to pay suppliers and vendors. | - | - | - |
Inventory Days Average number of days inventory remains unsold. | - | - | - |
CCC (Cash Conversion Cycle) (Debtor Days + Inventory Days - Creditor Days) | - | - | - |
Financial Ratios
Measures the company’s leverage relative to shareholder equity.
OBSERVATIONS & INSIGHTS
ROE fell from 25.2% to 17.3% in FY25 because total equity expanded sharply following share allotments and capitalisation into bonus shares; it recovered to 21.3% in FY26 as PAT grew 56.5% while share capital stayed unchanged
Debt to Equity improved to 0.2x in FY25 because equity increased faster than borrowings; it rose to 0.3x in FY26 as debt more than doubled to fund receivables, working capital and capex
Interest Coverage: improved from 7.9x to 11.8x because PBT/EBIT expanded materially while finance cost rose only from INR 3.6 Cr to INR 4.3 Cr.
Current Ratio increased to 1.8x in FY25 as receivables and unbilled revenue grew faster than current liabilities; it eased to 1.7x in FY26 because short-term borrowings, trade payables and other current liabilities rose with project scale
ROA remained near 10.7% in FY24-FY25 and improved to 11.5% in FY26 as PAT growth slightly outpaced the increase in average assets despite a large receivable build
ROCE dropped in FY25 because the capital base expanded faster than operating profit; it recovered in FY26 on stronger EBIT but remained below FY24 due to the substantially larger capital employed and borrowing base
Industry Overview
Industry Drivers
Public Infrastructure Capex and EPC Formalisation
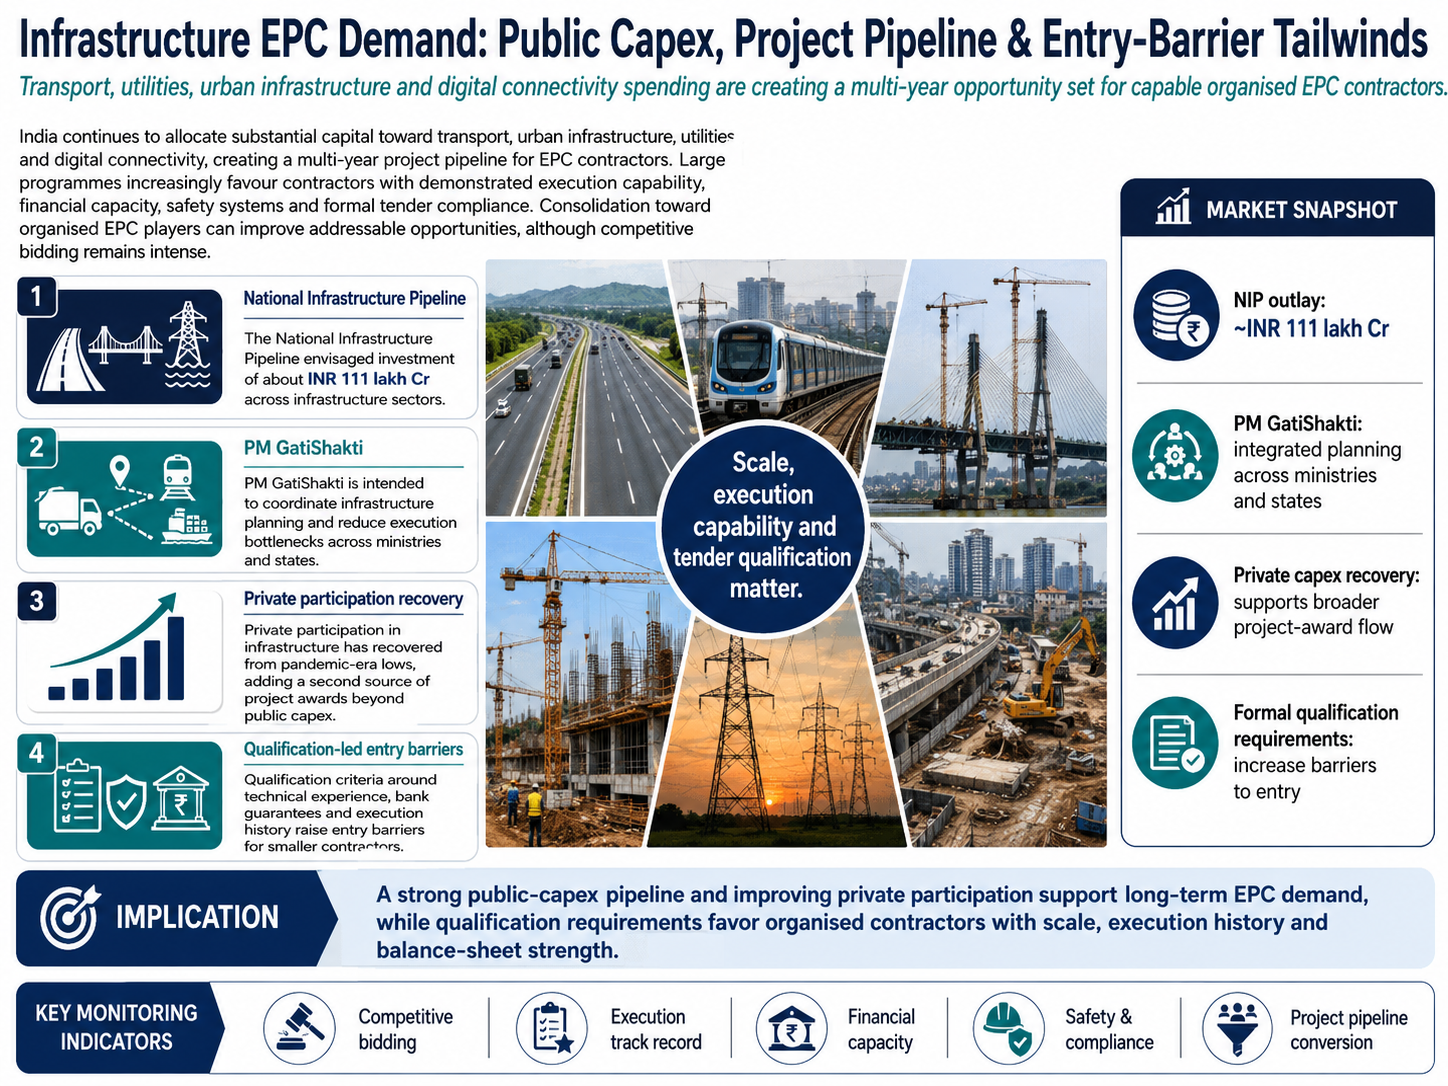
India continues to allocate substantial capital toward transport, urban infrastructure, utilities and digital connectivity, creating a multi-year project pipeline for EPC contractors. Large programmes increasingly favour contractors with demonstrated execution capability, financial capacity, safety systems and formal tender compliance. Consolidation toward organised EPC players can improve addressable opportunities, although competitive bidding remains intense.
The key drivers are:
The National Infrastructure Pipeline envisaged investment of about INR 111 lakh Cr across infrastructure sectors
PM GatiShakti is intended to coordinate infrastructure planning and reduce execution bottlenecks across ministries and states
Private participation in infrastructure has recovered from pandemic-era lows, adding a second source of project awards beyond public capex
Qualification criteria around technical experience, bank guarantees and execution history raise entry barriers for smaller contractors
Fibreisation, 5G Densification and BharatNet
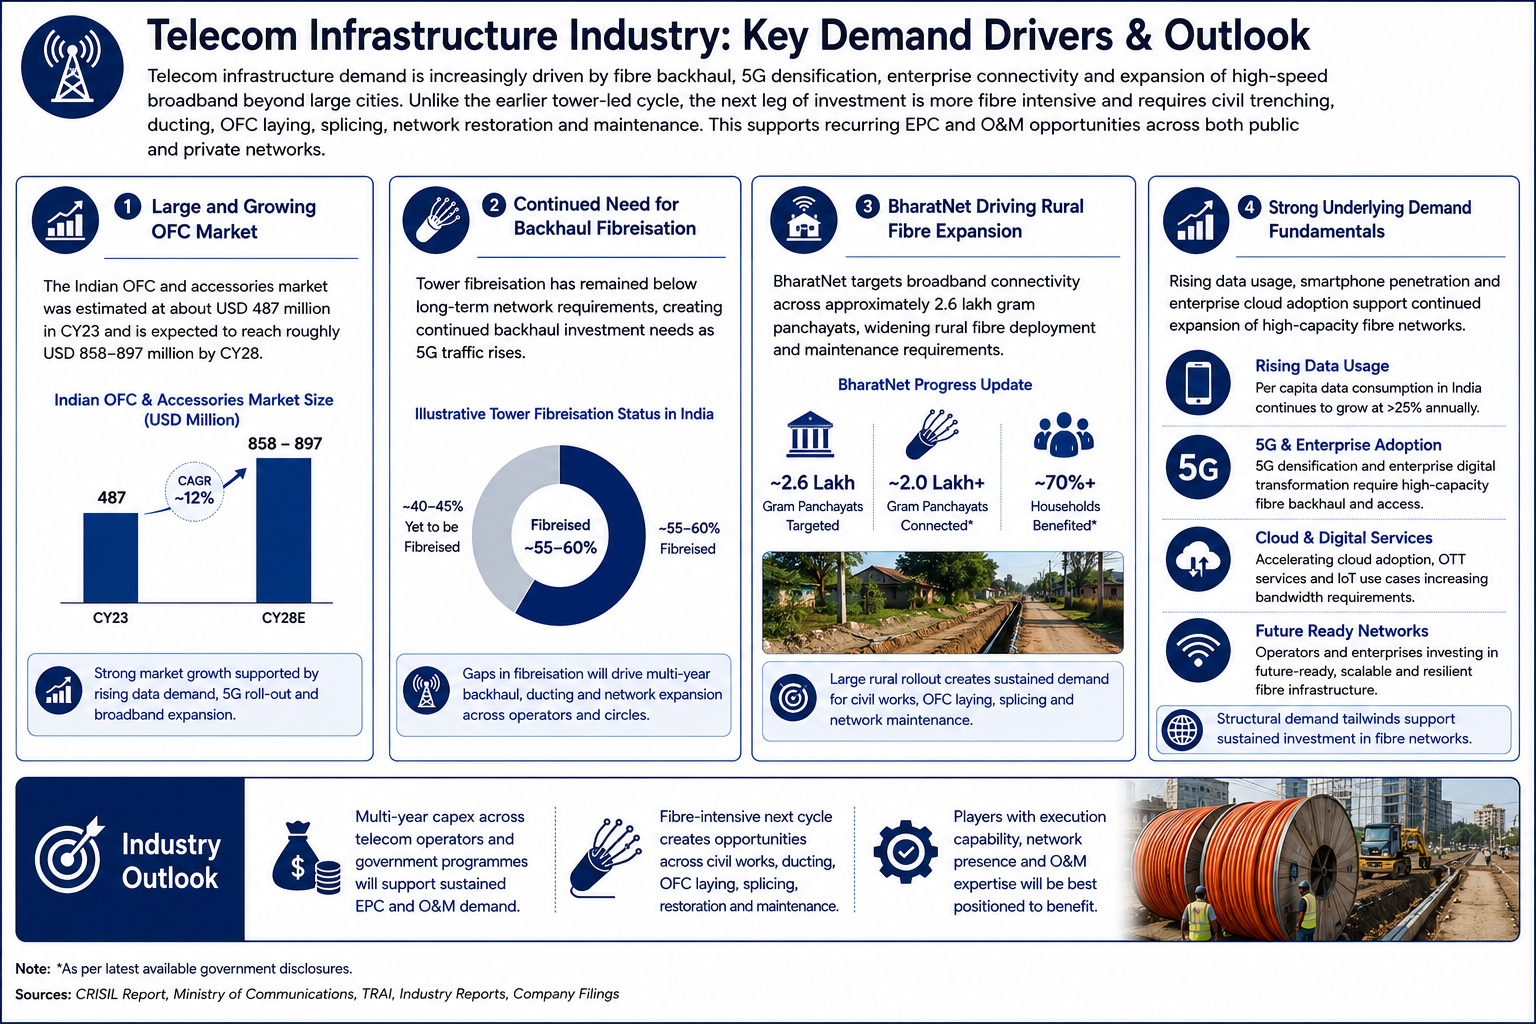
Telecom infrastructure demand is increasingly driven by fibre backhaul, 5G densification, enterprise connectivity and expansion of high-speed broadband beyond large cities. Unlike the earlier tower-led cycle, the next leg of investment is more fibre intensive and requires civil trenching, ducting, OFC laying, splicing, network restoration and maintenance. This supports recurring EPC and O&M; opportunities across both public and private networks.
The key details are:
The Indian OFC and accessories market was estimated at about USD 487 million in CY23 and is expected to reach roughly USD 858-897 million by CY28
Tower fibreisation has remained below long-term network requirements, creating continued backhaul investment needs as 5G traffic rises
BharatNet targets broadband connectivity across approximately 2.6 lakh gram panchayats, widening rural fibre deployment and maintenance requirements
Rising data usage, smartphone penetration and enterprise cloud adoption support continued expansion of high-capacity fibre networks
Urban Water, Sewerage and Wastewater Treatment
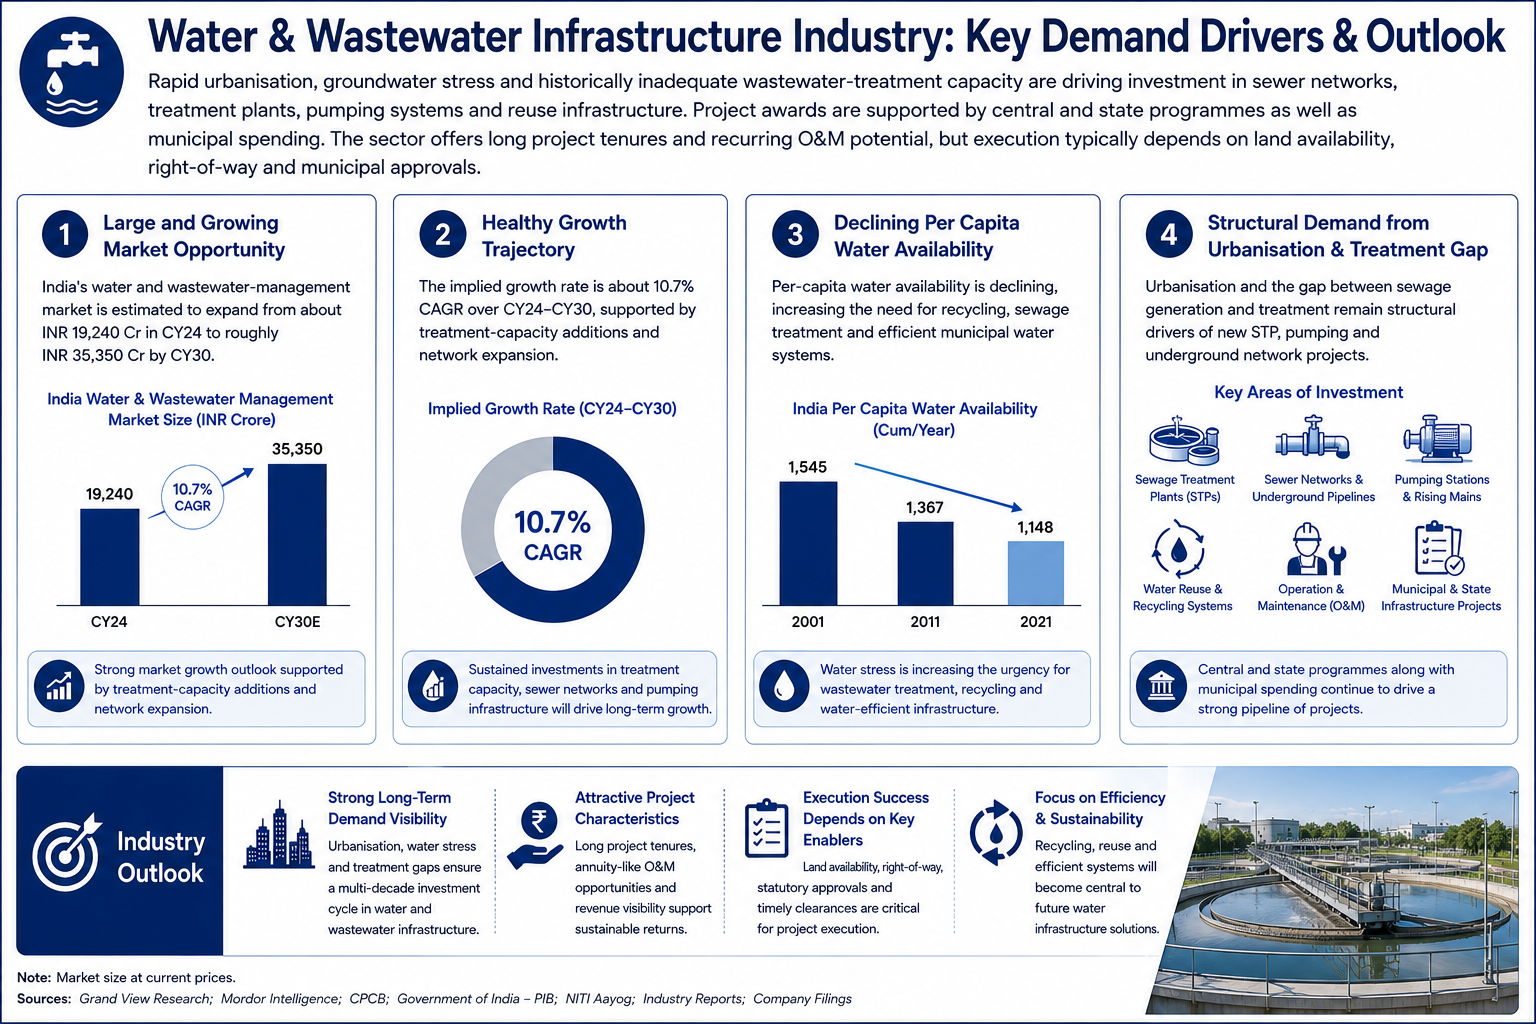
Rapid urbanisation, groundwater stress and historically inadequate wastewater-treatment capacity are driving investment in sewer networks, treatment plants, pumping systems and reuse infrastructure. Project awards are supported by central and state programmes as well as municipal spending. The sector offers long project tenures and recurring O&M; potential, but execution typically depends on land availability, right-of-way and municipal approvals.
The key details are:
India's water and wastewater-management market is estimated to expand from about INR 19,240 Cr in CY24 to roughly INR 35,350 Cr by CY30
The implied growth rate is about 10.7% CAGR over CY24-CY30, supported by treatment-capacity additions and network expansion
Per-capita water availability is declining, increasing the need for recycling, sewage treatment and efficient municipal water systems
Urbanisation and the gap between sewage generation and treatment remain structural drivers of new STP, pumping and underground network projects
Risks in the Industry
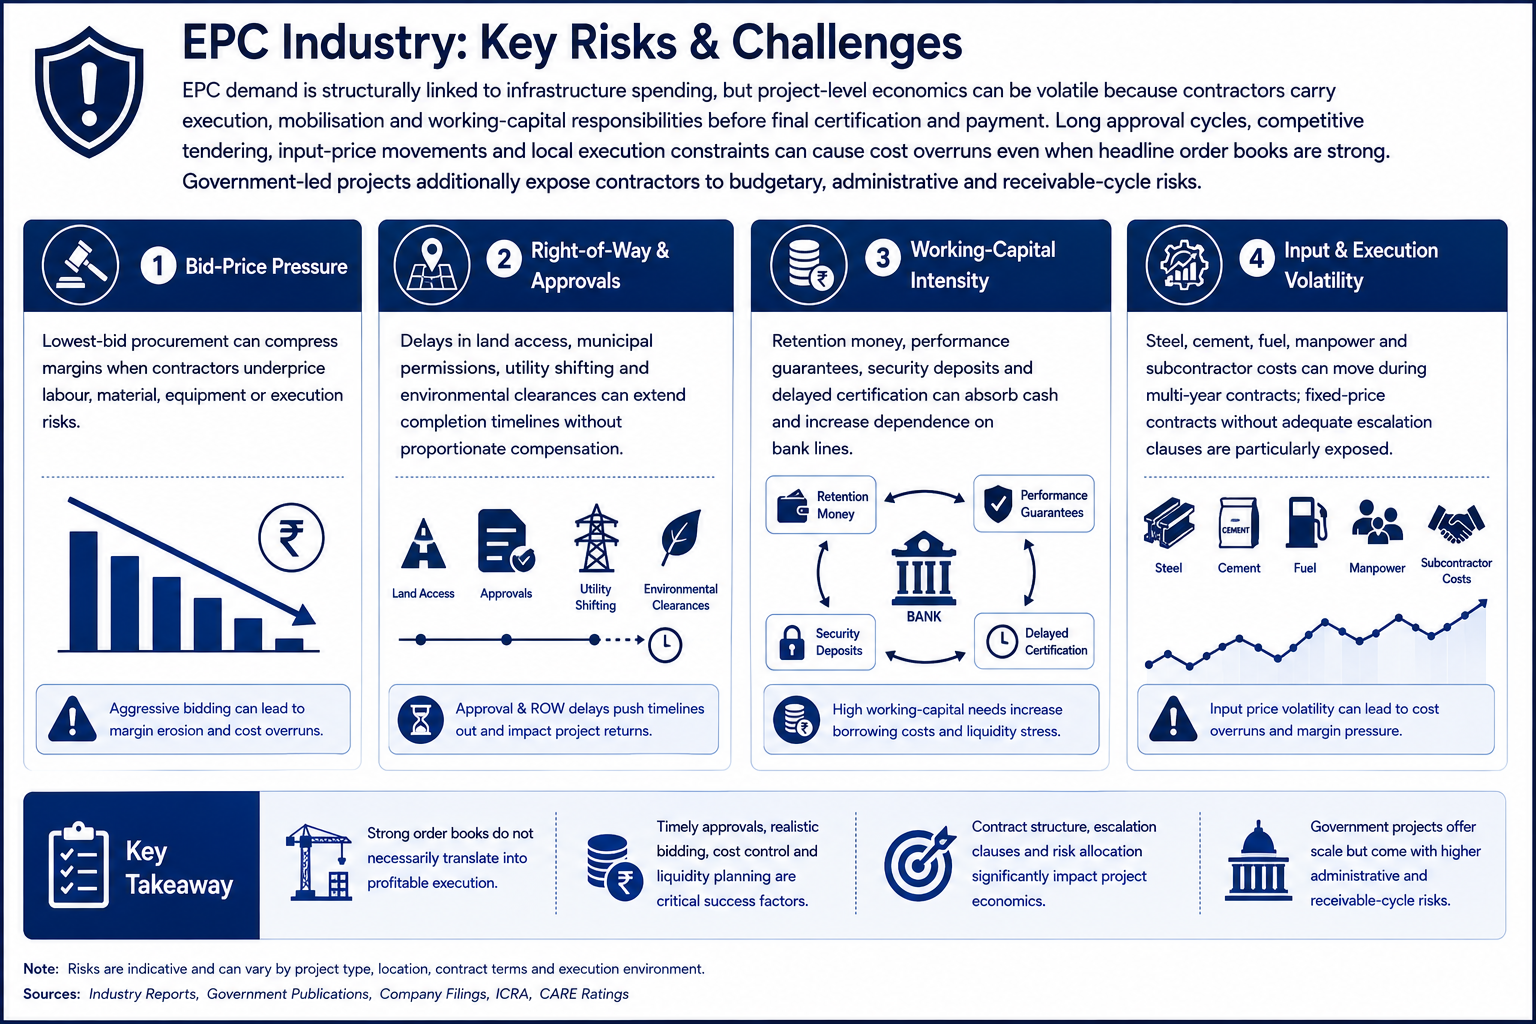
EPC demand is structurally linked to infrastructure spending, but project-level economics can be volatile because contractors carry execution, mobilisation and working-capital responsibilities before final certification and payment. Long approval cycles, competitive tendering, input-price movements and local execution constraints can cause cost overruns even when headline order books are strong. Government-led projects additionally expose contractors to budgetary, administrative and receivable-cycle risks.
The key risks are:
Lowest-bid procurement can compress margins when contractors underprice labour, material, equipment or execution risks
Delays in land access, municipal permissions, utility shifting and environmental clearances can extend completion timelines without proportionate compensation
Retention money, performance guarantees, security deposits and delayed certification can absorb cash and increase dependence on bank lines
Steel, cement, fuel, manpower and subcontractor costs can move during multi-year contracts; fixed-price contracts without adequate escalation clauses are particularly exposed
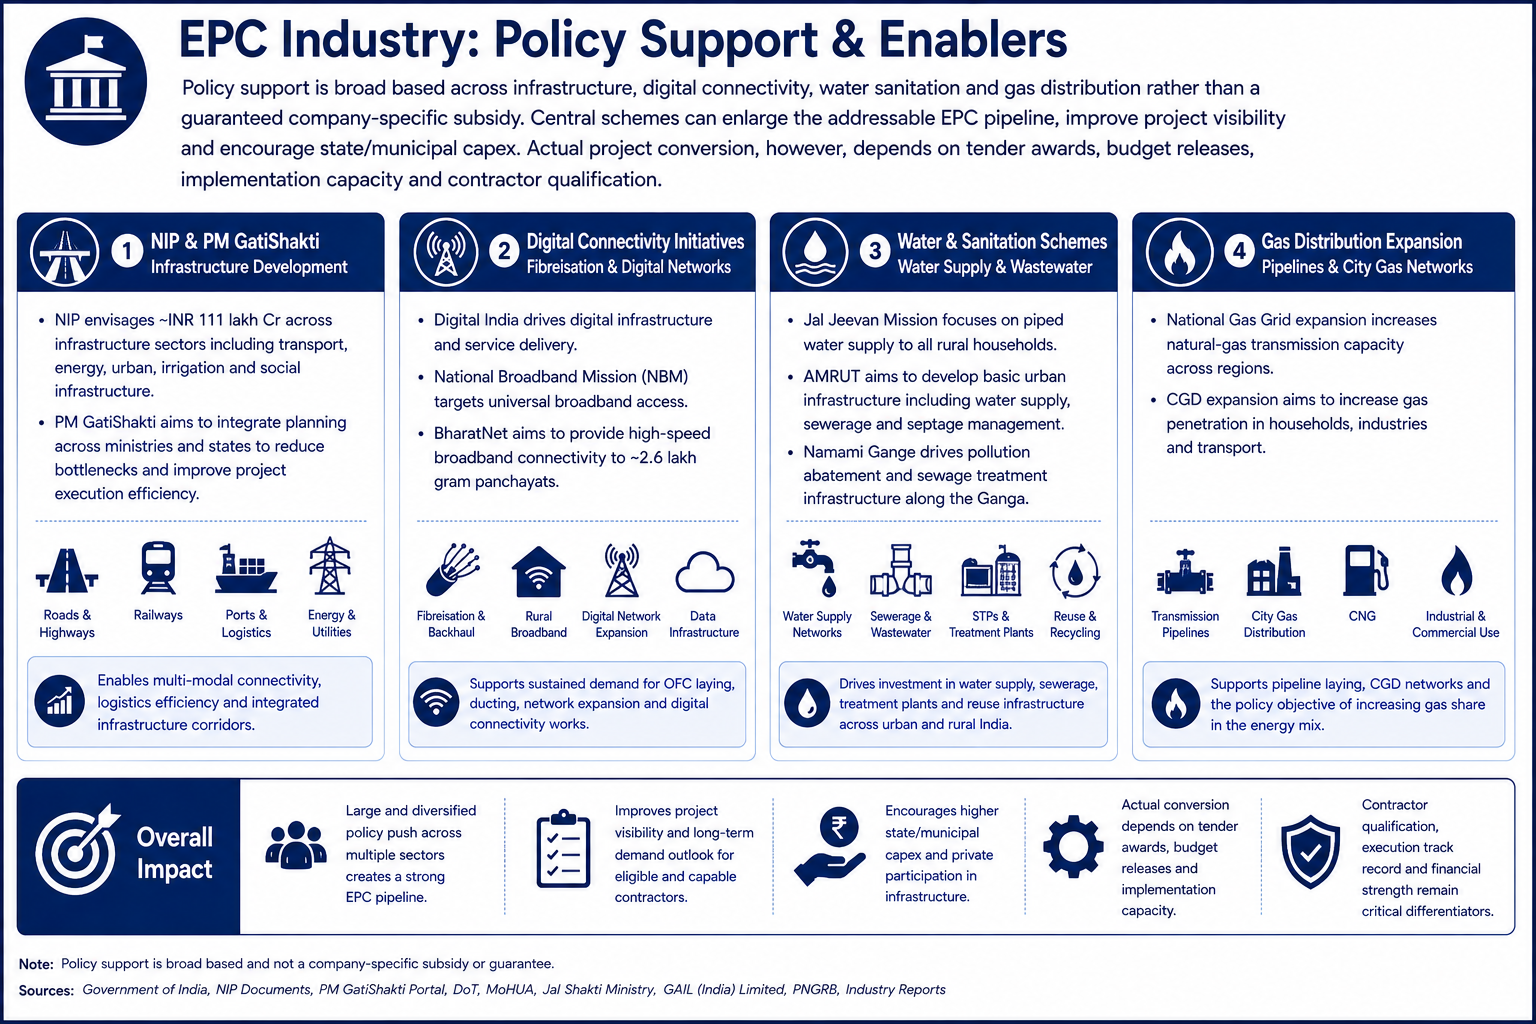
Government Policy Support
Policy support is broad based across infrastructure, digital connectivity, water sanitation and gas distribution rather than a guaranteed company-specific subsidy. Central schemes can enlarge the addressable EPC pipeline, improve project visibility and encourage state/municipal capex. Actual project conversion, however, depends on tender awards, budget releases, implementation capacity and contractor qualification.
The key policies are:
NIP and PM GatiShakti support integrated infrastructure development and coordinated execution across transport, logistics and utility corridors
Digital India, National Broadband Mission and BharatNet support fibreisation, rural broadband and digital-network expansion
Jal Jeevan Mission, AMRUT and Namami Gange support water-supply, sewerage, sanitation and wastewater-treatment infrastructure
National Gas Grid and CGD expansion support transmission pipelines, city-gas networks and the policy objective of increasing gas penetration in the energy mix
Fundraise/Future Plans
Shareholding
Pre-issue shareholding
Promoter Holding 0.0%
Post-Issue Shareholding
Promoter Holding 0.0%
Category
Pre-Issue%Post-Issue%
Promoters
Sanjay Kumar Sarraf
60.8%44.4%
Krishna Ranjan
26.9%19.6%
Total Promoter Holding
87.7%64.0%
Additional Shareholders
0.0%0.0%
Total Additional Holding
0.0%0.0%
Total Shareholding
87.7%64.0%
- Overview
- Business
- Financial Highlights
- Industry Overview
- Fundraise/Future Plans
- Documentation
Get the Preqt App and keep in touch around the clock!
 Monitor your investments in real-time.
- Receive tailored deal suggestions.
- Get real-time updates and alerts.
