

Apollo Green
Building Renewable FuturesDriving Energy Transition
Unlisted Review and Rating
Speculative
DRHP Not FiledOverall Recommendation
Apollo Green is repositioning toward renewable EPC at a time when India's solar, storage and hybrid infrastructure spending is expanding rapidly; it already has meaningful solar execution credentials and a INR 3,000 Cr+ stated project pipeline. The current unlisted valuation of around INR 67–69 also looks inexpensive on headline P/E and P/B. However, we should not treat the low valuation as sufficient reason to buy yet. FY25 consolidated revenue fell 34.7%, core EBITDA margin deteriorated to roughly 2.9%, ROE was only ~5.6%, and ₹33.7 Cr of PAT generated just INR 2.00 Cr of operating cash flow. More importantly, the financial statements contain significant investment and related-party complexity. The biggest diligence issue is the transfer of substantial businesses and investments to promoter-controlled entities against long-dated NCD consideration, with auditors explicitly stating that recoverability depends on the counterparty's future financial position. Seven entities included in consolidation were also based on management-certified unaudited financial statements, adding another layer of complexity. Apollo Green becomes materially more attractive if FY26/FY27 shows three things simultaneously: strong growth from the renewable EPC business after the legacy-business reset, much better operating cash conversion, and evidence that the related-party/NCD receivables are being realised on schedule.
PARAMETER
WEIGHT
SCORE
KEY FACTORS
Financial Performance
25.0%
2.0/5
Apollo has a reasonable capital base and improving reported margins, but weak core operating profitability, low ROE and poor cash conversion materially reduce financial quality
Show more
Detailed Analysis
Consolidated revenue declined 34.7% to INR 806.5 Cr. The decline is substantially restructuring-led rather than purely operational, but FY25 still does not demonstrate growth on the new business base
Reported EBITDA margin improved to ~9.2%, but core EBITDA margin excluding INR 50.9 Cr other income fell sharply to ~2.9% from ~5.8%
PAT margin improved from 3.1% to 4.2%, but absolute PAT fell 12.8% to ₹33.7 Cr and earnings were materially supported by non-operating income
D/E remained manageable at ~0.7x, but borrowings increased 22.7% to ₹493.3 Cr, with current borrowings rising sharply
FY25 PAT on average equity produces only approximately 5.6% ROE, weak relative to the capital now employed in the business
Industry
25.0%
4.0/5
Strong solar, storage and hybrid-energy tailwinds provide substantial runway, although tender competition and execution intensity constrain sector economics
Show more
Detailed Analysis
India's renewable build-out remains exceptionally strong, with non-fossil capacity already above 300 GW and a 500 GW target by 2030
Utility-scale solar EPC is established but still in a major expansion cycle, while BESS, hybrid projects and green hydrogen remain earlier-stage opportunities
Policy support is strong, although project awards, DISCOM health, land/transmission availability, tariffs and tender rules remain relevant risks
Apollo has historical international EPC credentials, but the current renewable-energy strategy remains predominantly India-led
Management
25.0%
4.0/5
Experienced promoters and an independent board are positives, but complex related-party restructuring and recoverability of promoter-linked consideration materially weaken governance comfort
Show more
Detailed Analysis
Raaja Kanwar leads the Apollo International Group and Apollo has more than two decades of EPC/project experience. The promoter has substantial corporate operating experience
The four-member board includes two independent directors, but FY25/FY26 saw considerable CFO, CS and board-member turnover
Significant asset/business transfers to promoter-controlled entities, often against long-dated NCD consideration whose recoverability depends on the buyer, are a material governance concern
Valuation Metrics
25.0%
3.0/5
Headline multiples appear inexpensive, but weak core earnings quality and investment-asset recoverability justify a substantial discount to cleaner renewable-EPC peers
Show more
Detailed Analysis
11.1x FY25 P/E looks inexpensive versus Waaree Renewable Technologies at ~18.1x, although Apollo's earnings quality is materially weaker
10.9x reported EV/EBITDA looks reasonable versus Waaree ~12.9x and Sterling & Wilson ~18.4x; however, excluding other income pushes Apollo above 30x
0.5x book value looks optically cheap, but a large portion of assets comprises investments/NCDs whose recoverability requires diligence
TOTAL
100%
3.3/5
Weighted Composite Score
Per Share Price
₹75.0
As of 24 Oct 2026
Lot Size
1,000.0 Shares
Minimum Investment
₹75,000.0 / 1,000 shares
Market Cap. (₹ Cr)
Revenue FY’25
PAT FY’25
P/E Multiple
Face Value
₹ 10.0Lot Size
1,000.0 sharesSale Type
Secondary SalePAT FY’25
₹ 33.7 CrPAT Margin (%)
4.2 %P/E Multiple
8.2xCAGR Growth 3Y
3.5 %ROE (FY’25)
5.6 %ROCE (FY’25)
6.5 %Price to Book Value ratio
0.4xDebt/Equity (FY’25)
0.7xMerchant banker appointed
❌ NoCompany Website
apollo-greenenergy.comDisclaimer: Unlisted shares are unregulated & illiquid. This is NOT investment advice. Please do your own due diligence before investing.
Minimum Investment
₹75,000.0 / 1,000 sharesShares Lot 1000 X 1
Investment amount
₹75,000.0
Overview
Business
Business Model
Geographical Presence
Sales Channel
Financial Highlights
Income Statement
Revenue growth with EBITDA and PAT margins
| Financial Metric | FY 2023 | FY 2024 | FY 2025 |
|---|---|---|---|
| Revenue (₹ Cr) | 753.4 | 1,234.3 | 806.5 |
| Growth (%) | 0.0% | 63.8% | -34.7% |
| EBITDA (₹ Cr) | 65.4 | 107.3 | 74.6 |
| EBITDA Margin (%) | 8.7% | 8.7% | 9.2% |
| PAT (₹ Cr) | 24.7 | 38.6 | 33.7 |
| PAT Margin (%) | 3.3% | 3.1% | 4.2% |
OBSERVATIONS & INSIGHTS
Revenue peaked at INR 1,234.3 Cr in FY24 and fell 34.7% in FY25 after portfolio divestments and lower project-goods and trading activity; the two-year CAGR was only 3.5%
The swing from 63.8% growth to a 34.7% decline shows that historical top-line momentum is not a reliable forward run rate, The EBITDA proxy declined 30.5% in FY25 but remained above FY23, producing a 6.8% two-year CAGR
Margin improved by 0.6 percentage points to 9.2% despite the revenue contraction, suggesting a better mix or lower operating costs, Finance cost fell to INR 25.1 Cr, improving reported coverage, although total borrowings increased and the later credit rating deteriorated sharply
PAT declined 12.8% in FY25 but achieved a 16.7% two-year CAGR, PAT margin increased to 4.2%; the improvement must be assessed alongside INR 50.9 Cr of other income and weak operating cash conversion
Balance Sheet
| Financial Metric | FY 2023 | FY 2024 | FY 2025 |
|---|---|---|---|
| EQUITY & LIABILITIES | ₹ 1,202.9 Cr | ₹ 1,483.3 Cr | ₹ 1,580.5 Cr |
| Net Worth | ₹ 469.4 Cr | ₹ 532.3 Cr | ₹ 664.9 Cr |
| Share Capital | ₹ 19.0 Cr | ₹ 19.0 Cr | ₹ 32.0 Cr |
| Reserves & Surplus | ₹ 450.4 Cr | ₹ 513.3 Cr | ₹ 632.9 Cr |
| Total Liabilities | ₹ 733.5 Cr | ₹ 951.0 Cr | ₹ 915.6 Cr |
| Current Liabilities | ₹ 489.1 Cr | ₹ 659.2 Cr | ₹ 631.0 Cr |
| Borrowings | ₹ 141.8 Cr | ₹ 128.6 Cr | ₹ 223.2 Cr |
| Trade Payables | ₹ 121.7 Cr | ₹ 218.7 Cr | ₹ 201.8 Cr |
| Other Current Liabilities | ₹ 225.6 Cr | ₹ 311.9 Cr | ₹ 206.0 Cr |
| Non-Current Liabilities | ₹ 244.4 Cr | ₹ 291.8 Cr | ₹ 284.6 Cr |
| Borrowings | ₹ 198.7 Cr | ₹ 273.3 Cr | ₹ 270.0 Cr |
| Other Non-Current Liabilities | ₹ 45.7 Cr | ₹ 18.5 Cr | ₹ 14.6 Cr |
| ASSETS | ₹ 1,202.8 Cr | ₹ 1,483.3 Cr | ₹ 1,580.6 Cr |
| Current Assets | ₹ 632.1 Cr | ₹ 832.3 Cr | ₹ 710.6 Cr |
| Trade Receivables | ₹ 208.7 Cr | ₹ 396.2 Cr | ₹ 239.0 Cr |
| Inventory | ₹ 42.7 Cr | ₹ 53.8 Cr | ₹ 0.1 Cr |
| Cash & Cash Equivalents | ₹ 69.4 Cr | ₹ 54.1 Cr | ₹ 59.3 Cr |
| Other Current Assets | ₹ 311.3 Cr | ₹ 328.2 Cr | ₹ 412.2 Cr |
| Non-Current Assets | ₹ 570.7 Cr | ₹ 651.0 Cr | ₹ 870.0 Cr |
| Fixed Assets | ₹ 112.0 Cr | ₹ 120.5 Cr | ₹ 110.6 Cr |
| Other Non-Current Assets | ₹ 458.7 Cr | ₹ 530.5 Cr | ₹ 759.4 Cr |
OBSERVATIONS & INSIGHTS
Equity increased to INR 664.9 Cr through retained earnings and fresh capital, providing balance-sheet capacity but diluting per-share earnings
Share capital rose to INR 32.0 Cr and reserves to INR 632.9 Cr; the partially paid share structure and future conversions require fully diluted reconciliation
Payables fell to INR 201.8 Cr despite longer calculated creditor days because the cost base contracted, Short-term borrowings increased by INR 94.6 Cr to INR 223.2 Cr, adding liquidity and refinancing pressure
Long-term borrowings remained elevated at INR 270.0 Cr, taking total debt to INR 493.3 Cr, Cash and bank balances were INR 59.3 Cr, while inventory fell to INR 0.1 Cr after the portfolio restructuring
Other non-current assets increased by INR 228.9 Cr to INR 759.4 Cr and became the largest asset category, concentrating valuation and recoverability risk
Cash Flow
| Financial Metric | FY 2023 | FY 2024 | FY 2025 |
|---|---|---|---|
CFO (₹ Cr) Cash generated from core business operations. | -79.4 Cr | +14.2 Cr | +2 Cr |
CFI (₹ Cr) Cash used for investments and long-term assets. | +381.0 Cr | -35.1 Cr | -179.7 Cr |
CFF (₹ Cr) Cash flow related to funding and borrowings. | -304.6 Cr | +5.6 Cr | +182.9 Cr |
Working Capital
| Efficiency Metric | FY 2023 | FY 2024 | FY 2025 |
|---|---|---|---|
Debtor Days Average number of days taken to collect customer payments. | - | - | - |
Creditor Days Average time taken to pay suppliers and vendors. | - | - | - |
Inventory Days Average number of days inventory remains unsold. | - | - | - |
CCC (Cash Conversion Cycle) (Debtor Days + Inventory Days - Creditor Days) | - | - | - |
Financial Ratios
Measures the company’s leverage relative to shareholder equity.
OBSERVATIONS & INSIGHTS
ROE declined from 7.7% to 5.6% because the enlarged equity base outpaced PAT, ROCE fell to 6.5% as capital employed expanded and EBIT declined, weakening the efficiency of the growth investment
ROA remained low at 2.2%, reflecting a large asset base relative to earnings, Debt to equity improved slightly to 0.7x only because equity issuance offset higher absolute borrowings
Debt to EBITDA rose to 6.6x after EBITDA declined and borrowings increased, Reported coverage improved to 2.7x because finance cost fell, but this accounting ratio conflicts with the later default-grade lender signal
Industry Overview
Industry Drivers
Utility-Scale Renewable Pipeline
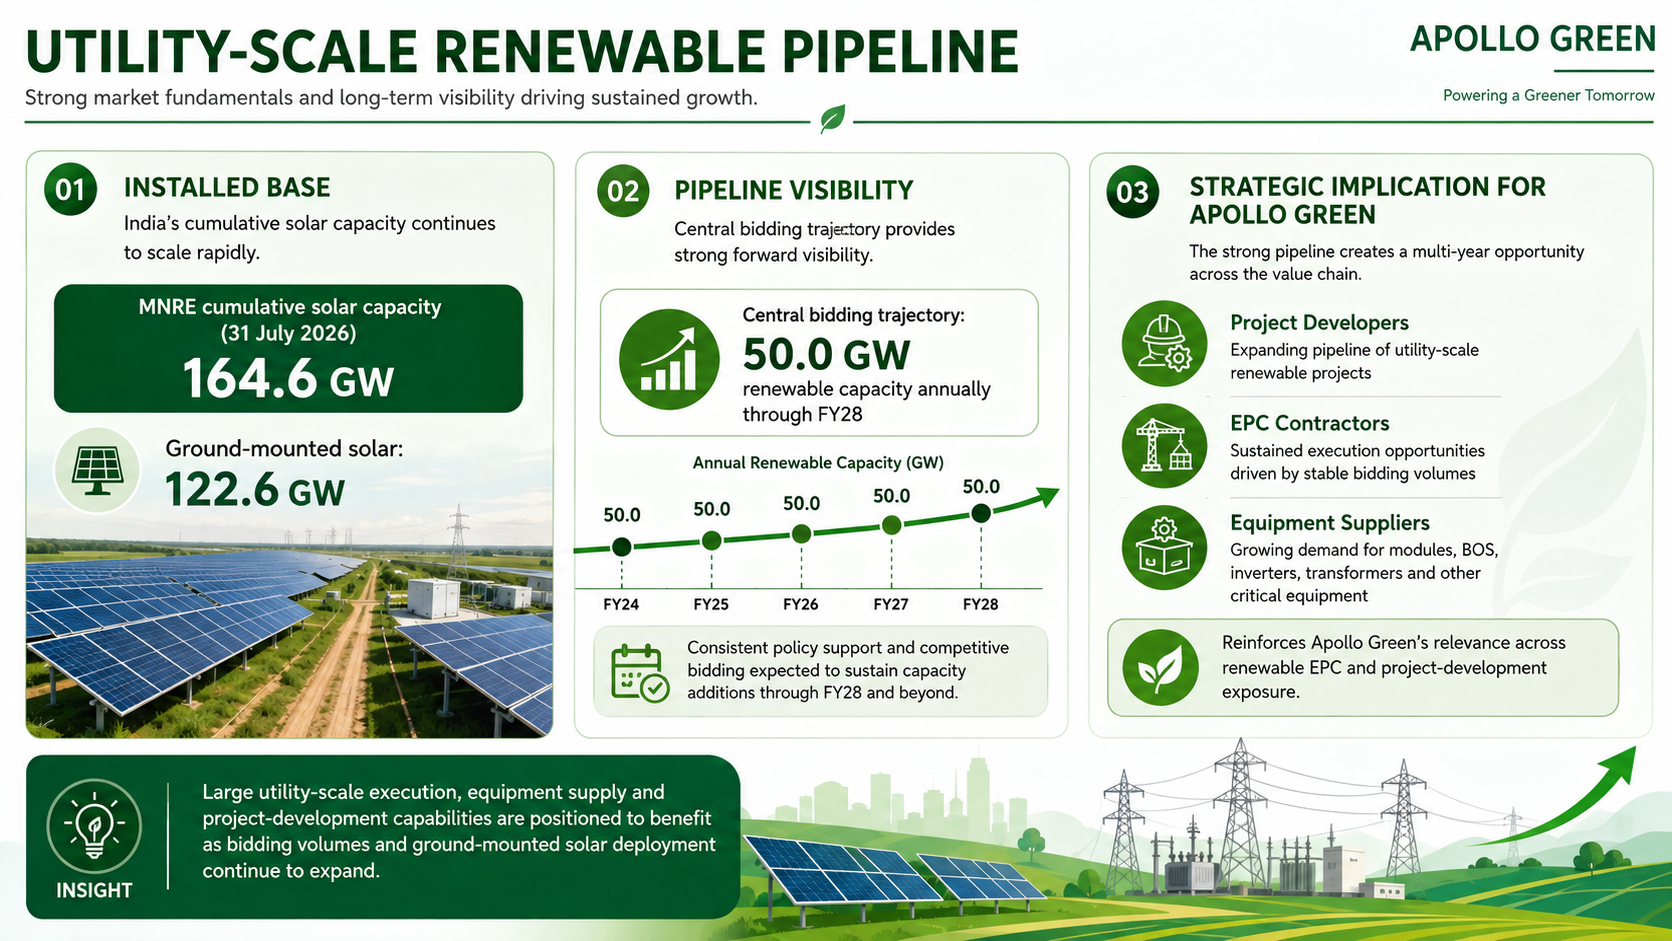
MNRE reported cumulative solar capacity of 164.6 GW at 31 July 2026, including 122.6 GW of ground-mounted solar
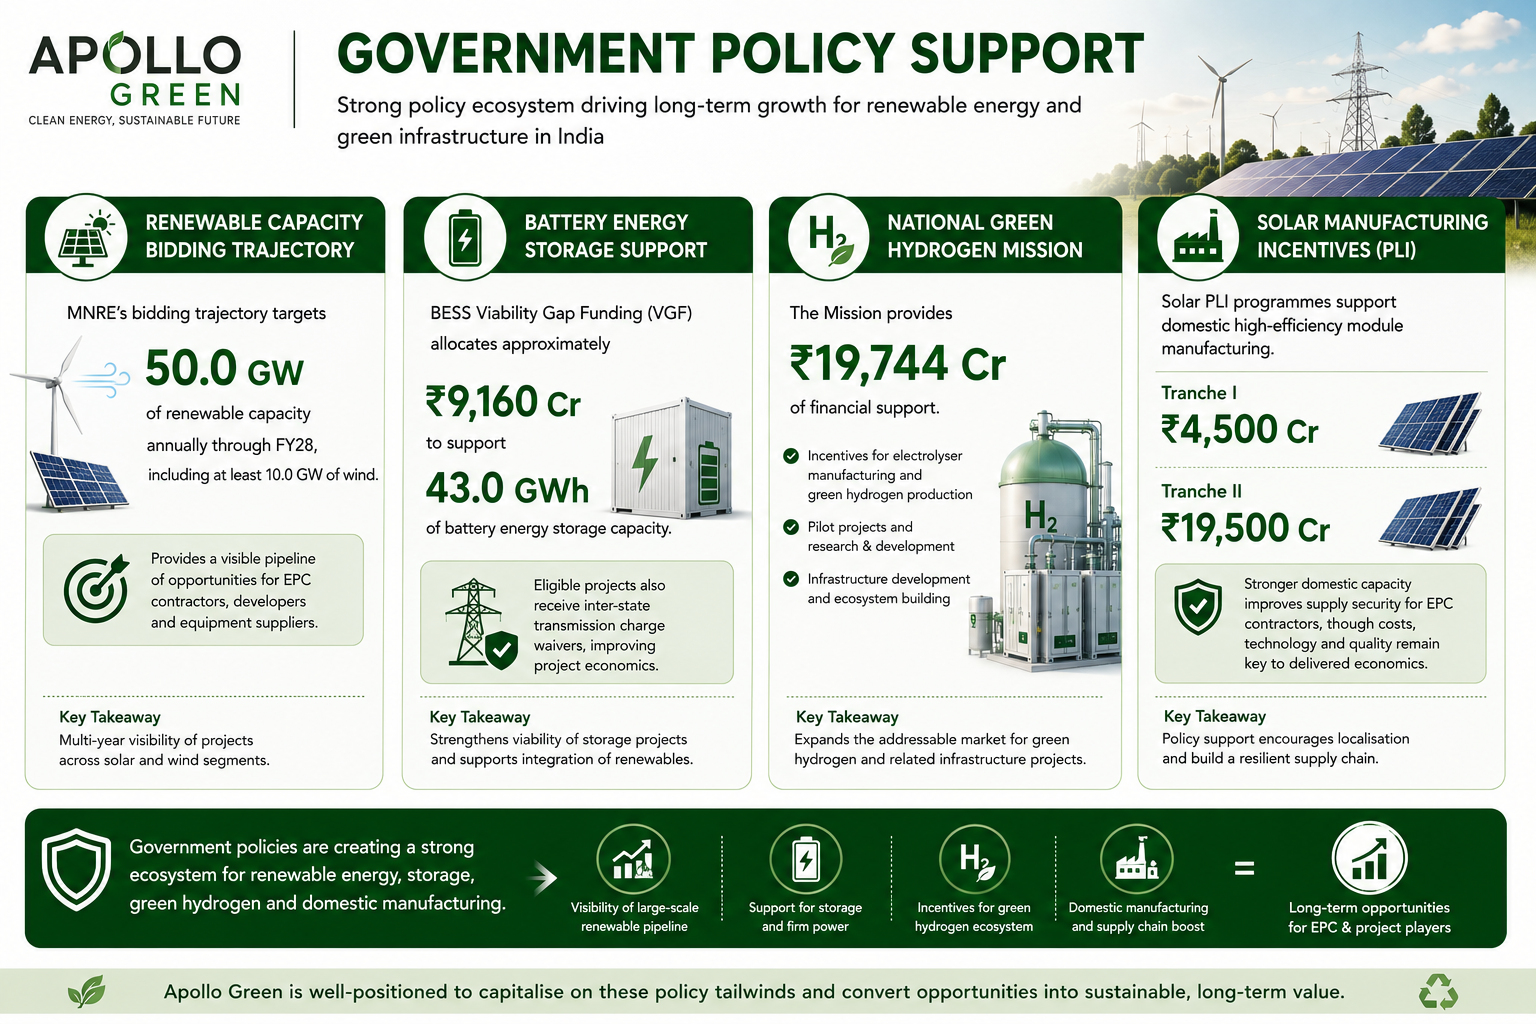
The central bidding trajectory of 50.0 GW of renewable capacity annually through FY28 supports a multi-year opportunity for project developers, EPC contractors and equipment suppliers
Hybrid Power and Battery Storage
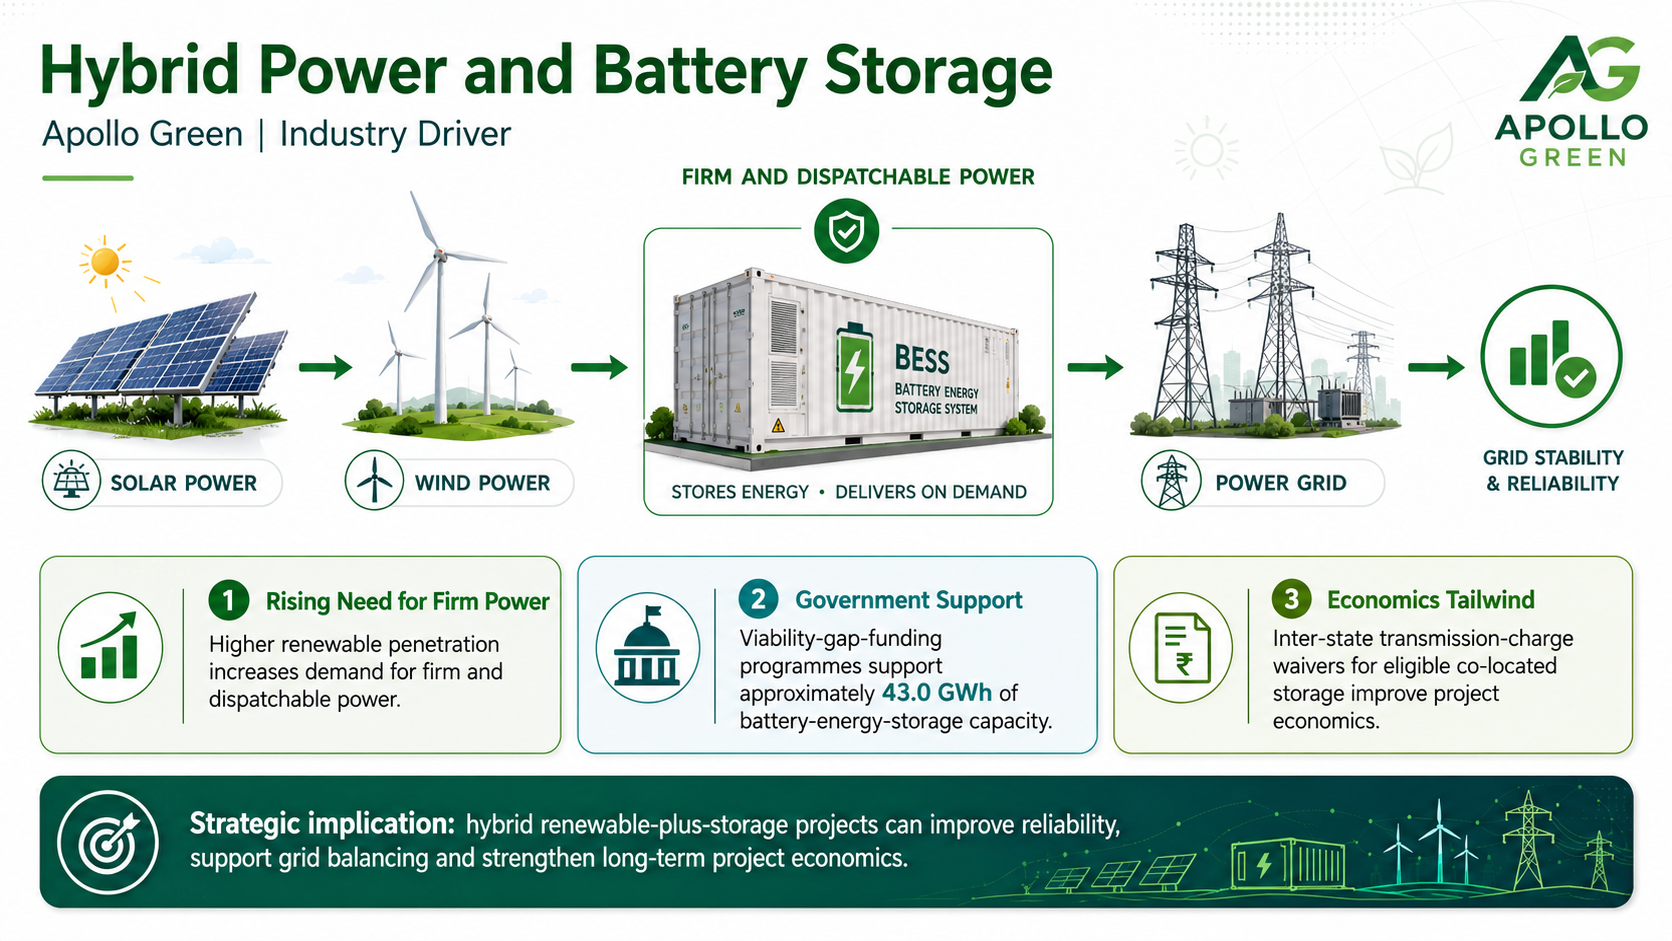
Higher renewable penetration increases demand for firm and dispatchable power
Government viability-gap-funding programmes support approximately 43.0 GWh of battery-energy-storage capacity, while inter-state transmission-charge waivers for eligible co-located storage improve project economics
Domestic Supply Chain and EPC Capacity
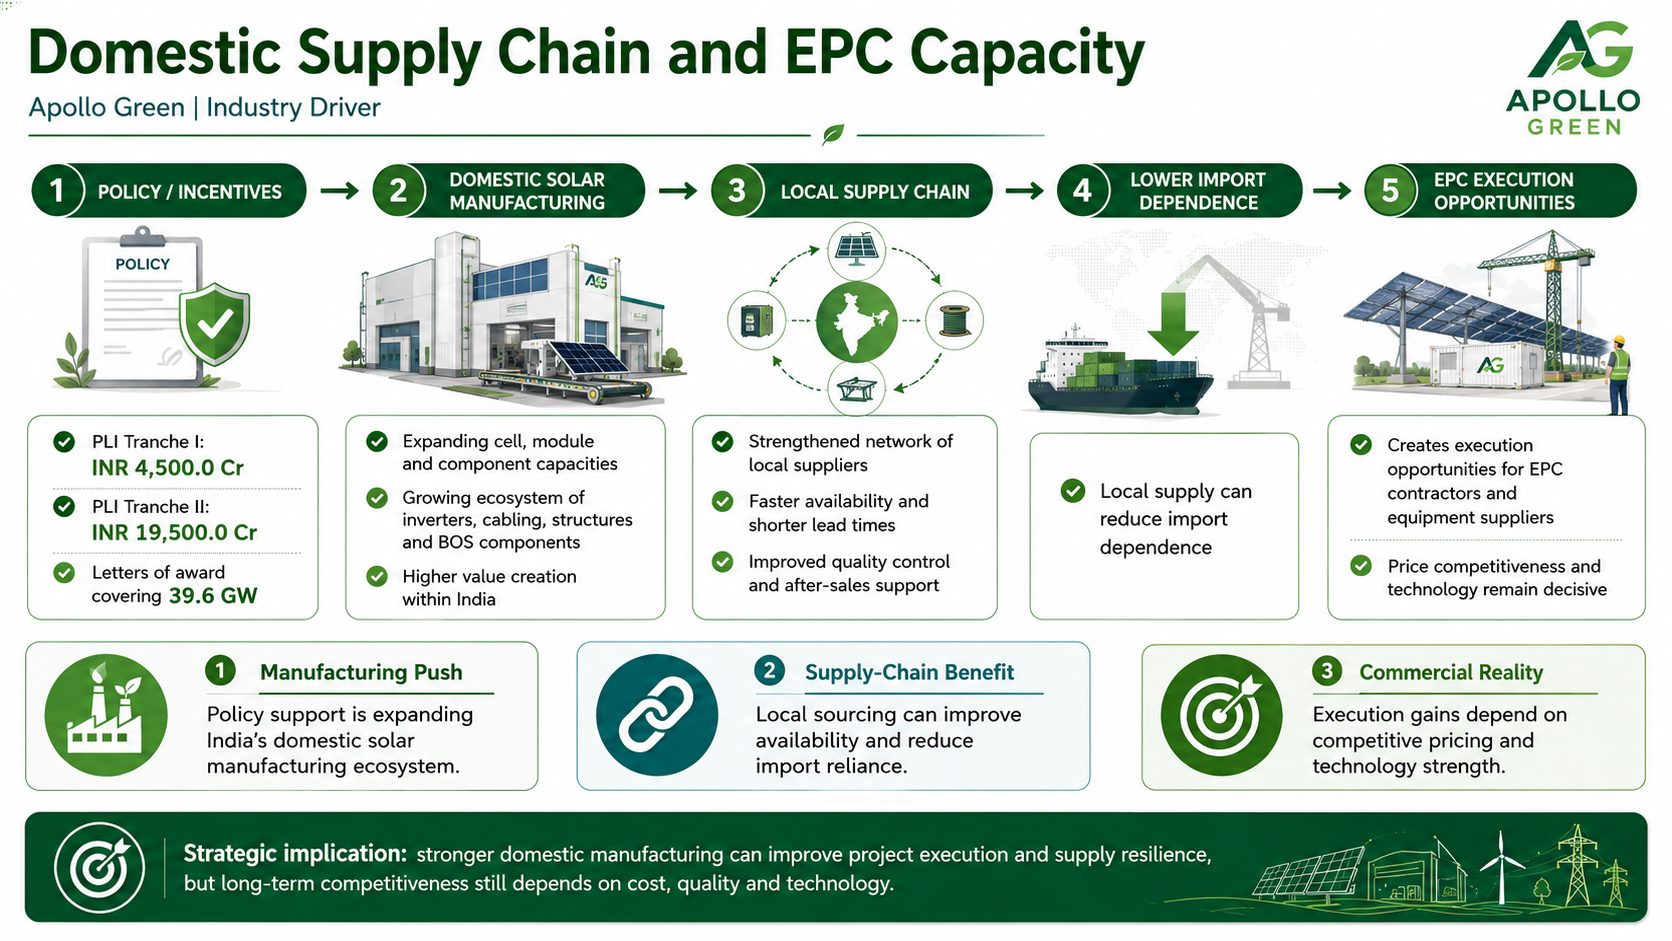
Solar manufacturing incentives include INR 4,500.0 Cr under PLI Tranche I and INR 19,500.0 Cr under Tranche II, with letters of award covering 39.6 GW
Local supply can reduce import dependence and create execution opportunities, although price competitiveness and technology remain decisive
Green Hydrogen and Process Infrastructure
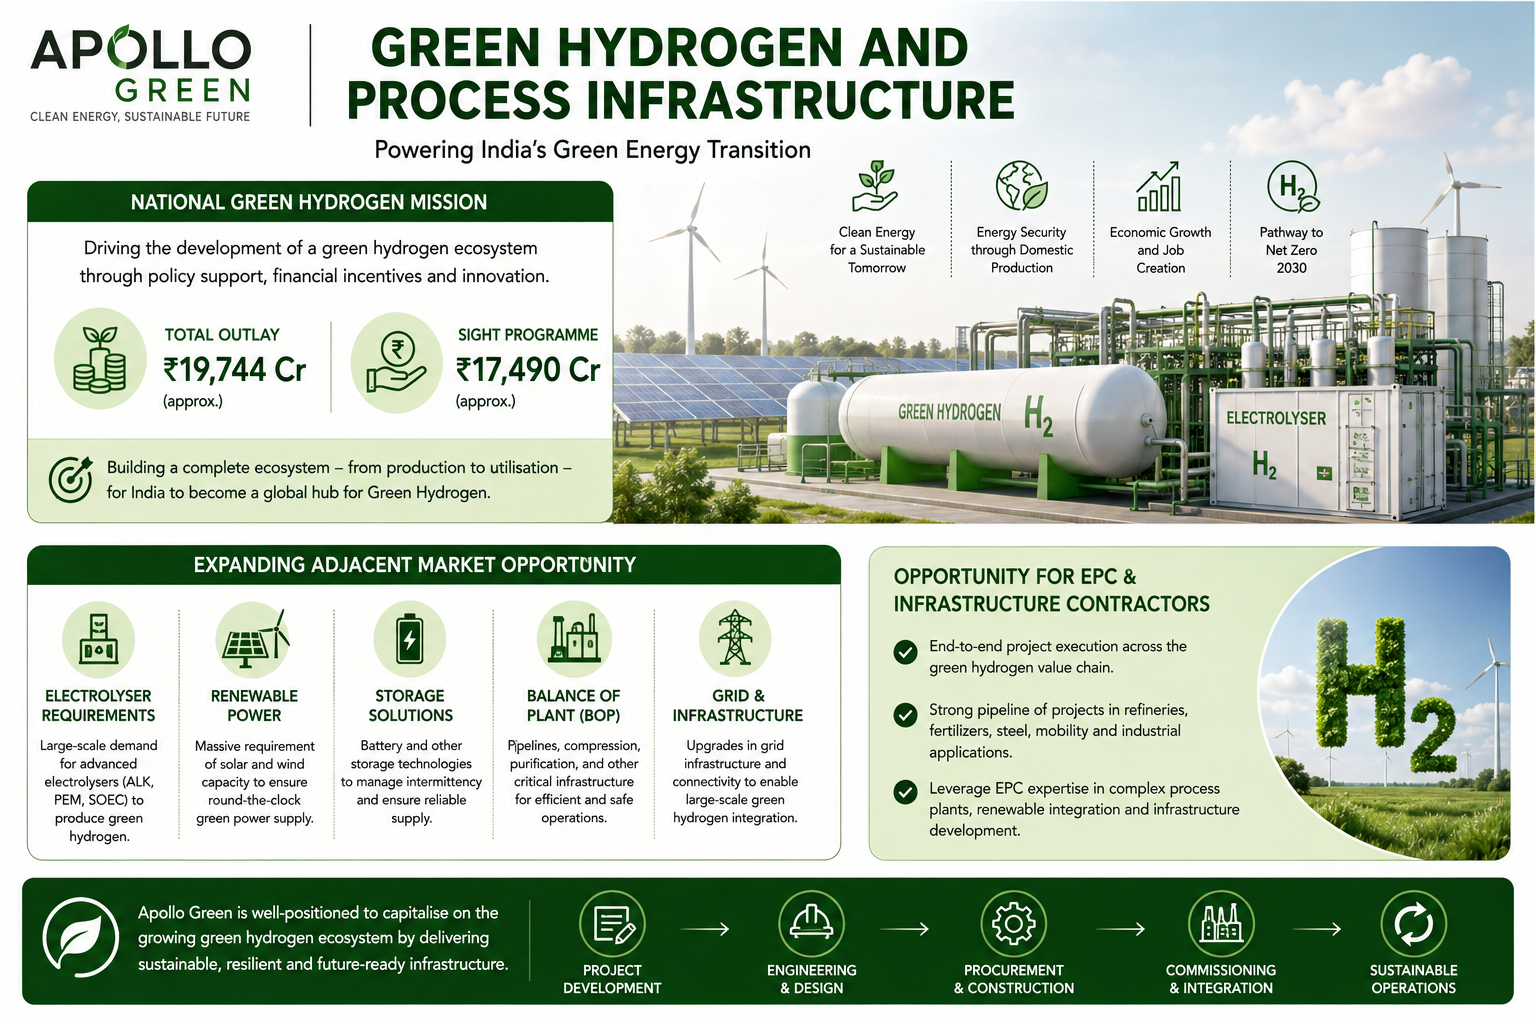
The National Green Hydrogen Mission has an outlay of INR 19,744.0 Cr, including INR 17,490.0 Cr for the SIGHT programme
Electrolyser, renewable-power, storage and balance-of-plant requirements expand the adjacent market for experienced project and infrastructure contractors
Government Policy Support
MNRE’s bidding trajectory targets 50.0 GW of renewable capacity annually through FY28, including at least 10.0 GW of wind. It provides a visible pipeline but no company-specific award or margin assurance
BESS VGF allocates about INR 9,160.0 Cr to 43.0 GWh; eligible projects also receive transmission-charge waivers
The National Green Hydrogen Mission provides INR 19,744.0 Cr of support, including incentives for electrolyser manufacturing and green-hydrogen production, pilots and research. Apollo Green’s opportunity depends on converting policy momentum into bankable contracts with credible counterparties and financing
Solar PLI programmes support domestic high-efficiency module manufacturing, with INR 4,500.0 Cr under Tranche I and INR 19,500.0 Cr under Tranche II. Domestic capacity can improve supply security for EPC contractors, but input prices, technology and quality still determine delivered economics
- Overview
- Business
- Financial Highlights
- Industry Overview
- Documentation
Get the Preqt App and keep in touch around the clock!
 Monitor your investments in real-time.
- Receive tailored deal suggestions.
- Get real-time updates and alerts.
