

Ardee Industries
Recycling Metals ResponsiblyRecovering Value Responsibly
IPO Summary (PrEqt)
Ardee Industries is an integrated secondary-lead recycler producing refined lead and customised lead alloys from battery and metal scrap, with a 156,950 MTPA facility in Andhra Pradesh and exports to eight countries. FY26 revenue was INR 1,167.6 Cr, EBITDA INR 147.1 Cr and PAT INR 84.7 Cr, with RoNW of 57.5%. The IPO comprises a ₹320 crore fresh issue and an OFS of 1.9 Cr shares. Primary proceeds are intended for working capital and debt repayment, while key risks include customer concentration, scrap sourcing, LME-price volatility and environmental compliance.
IPO Review and Rating
Buy
MainboardDelivering High-Purity Lead Through Sustainable Recycling and Manufacturing Excellence
Ardee Industries Limited, incorporated in 1993 and controlled by its present promoters since 2021, manufactures pure lead and multiple lead-alloy grades using recyclable battery and metal scrap. The Company operates a circular manufacturing process that covers scrap procurement, segregation, battery breaking, smelting, refining, alloying, casting, testing and delivery. Its products are supplied to battery and metal-industry customers in India and overseas and are customised for purity and alloy composition.
PARAMETER
WEIGHT
SCORE
KEY FACTORS
Financial Performance
40.0%
5.0/5
Financial performance is supported by 58.8% revenue CAGR, 12.6% EBITDA margin and 57.5% RoNW, but customer concentration remains high at 40.6% for the largest customer and 91.6% for the top ten customers.
Show more
Detailed Analysis
Revenue increased from INR 462.9 Cr in FY24 to INR 1,167.6 Cr in FY26, representing a CAGR of 58.8% and FY26 growth of 57.2%
EBITDA increased from INR 28.1 Cr in FY24 to INR 147.1 Cr in FY26, while EBITDA margin expanded from 6.06% to 12.6%
PAT increased from INR 8.9 Cr in FY24 to INR 84.7 Cr in FY26, while PAT margin improved from 1.93% to 7.2%
Debt-to-equity reduced from 4.9x in FY24 to 2.6x in FY25 and 1.2x in FY26, despite FY26 borrowings of INR 182.7 Cr
RoNW increased from 30.6% in FY24 to 53.1% in FY25 and 57.5% in FY26, supported by PAT of INR 84.7 Cr on net worth of INR 147.4 Cr
Operating cash flow improved from negative INR 25.3 Cr in FY24 to positive INR 7.8 Cr in FY25 and positive INR 29.8 Cr in FY26
Industry
15.0%
2.0/5
The industry has a large FY26 market size of INR 30,933.0 Cr and Ardee derives 39.8% of revenue from exports, but sector growth is moderate at 6.1% and Ardee’s domestic market share is only 2.1%
Show more
Detailed Analysis
The Indian recycled-lead-ingot market is projected to increase from INR 30,933.0 Cr in FY26 to INR 39,200.0 Cr in FY30, representing a CAGR of 6.1%
The estimated HHI is approximately 1,011, with the market leader at 19.6%, the top three at 41.0%, and Ardee Industries at 2.1% market share
The industry operates under the Battery Waste Management Rules, 2022, CPCB registration requirements and import licences, with more than 650 registered recycling units
Management
15.0%
4.0/5
Management is supported by more than 30 years of lead-promoter experience, 50.00% board independence, zero pledged promoter shares and related-party sales of only 1.74%, although promoters are selling 8.60% of their pre-offer holding
Show more
Detailed Analysis
Sandeep Aggarwal has more than 30 years of industry experience, compared with more than 8 years for Nikunj Aggarwal and more than 4 years for Esha Gupta
The Board has 6 directors, comprising 3 executive directors and 3 independent directors, resulting in exactly 50.00% independence
Promoters hold 232,301,700 shares, with 0 shares pledged, while one promoter direct-tax case involves approximately INR 0.01 Cr
Related-party sale of goods was INR 20.27 Cr, representing 1.74% of FY26 revenue, compared with 1.09% in FY25 and 1.70% in FY24
Promoters are selling 19,975,000 shares, equal to 8.60% of their pre-offer holding of 232,301,700 shares, while the Company is raising INR 320.00 Cr through the fresh issue
Valuation
20.0%
4.0/5
The valuation is inexpensive on P/E and EV/EBITDA relative to selected peers, with discounts of 53.33% and 50.40%, but expensive on book value at 9.17x
Show more
Detailed Analysis
At INR 53, Ardee’s FY26 P/E is 15.9x versus the selected peer average of 34.2x, representing a discount of 53.3%
Ardee’s estimated EV/EBITDA is 12.5x versus the selected peer average of 25.2x, placing the issuer multiple approximately 50.4% below peers
At INR 53 and FY26 NAV of INR 5.8, the IPO is priced at 9.2x book value
FY26 RoNW is 57.5%, calculated from PAT of INR 84.7 Cr and net worth of INR 147.4 Cr
At INR 53, the offer comprises a fresh issue of INR 320.0 Cr and an OFS of approximately INR 105.9 Cr, making the fresh component 75.1% of the total issue
Merchant Banker Track Record
10.0%
3.0/5
The BRLM sample attracted average subscription of 52.24x, but generated average listing gains of only 1.08% and a positive-listing success rate of 40.00%
Show more
Detailed Analysis
The five-IPO sample generated an average listing return of 1.1%, with outcomes ranging from negative 34.9% to positive 38.2%
Average subscription across the five sampled IPOs was 52.2x, while the median subscription was 26.2x
Two of five sampled IPOs listed above their issue price, producing a positive-listing success rate of 40.0%
TOTAL
100%
4.0/5
Weighted Composite Score
Issue Price
₹50.0 to ₹53.0
As of 12 Sep 2026
GMP
₹7.0
As of 12 Sep 2026
Estimated Gain / Loss
+12.7%
Lot Size
281.0 Shares
Grey Market Premium (GMPs) are shared for knowledge purpose only. PrEqt doesn’t promote or execute the trades.
| Issue size | |
|---|---|
| Overall | ₹426.0 Cr |
| Fresh Issue | ₹320.0 Cr |
| Offer for Sale | ₹106.0 Cr |
Minimum Investment
₹14,893.0 / 78,961 shares

Merchant Banker
Pantomath Capital Advisors Pvt.Ltd.
Pantomath Capital Advisors Pvt.Ltd.
IPO Document
Offer Start Date
Offer End Date
Valuation
Revenue
PAT (FY'26)
Issue Size
Face Value
₹ 2.0Offer Price
₹ 53.0Lot Size
281.0 sharesSale Type
Fresh capital cum OFSPAT (FY'26)
₹ 84.7 CrPAT Margin (FY'26)
7.3 %P/E Multiple
15.9xEBITDA (FY'26)
₹ 147.1 CrCAGR Growth 2Y
58.8 %ROE (FY'26)
81.0 %ROCE (FY'26)
44.3 %Price to Book Value
9.2xDebt/Equity
1.3xCompany Website
ardeeindustries.comExplore new deals
Overview
Fund Allocation
Total: ₹0 CrSource:Company DRHP
Timeline
IPO Open Date
To Be Announced
IPO Close Date
To Be Announced
Tentative Allotment
To Be Announced
Initiation of Refunds
To Be Announced
Credit of Shares to Demat
To Be Announced
Tentative Listing Date
To Be Announced
Business
Products
Business Model
Geographical Presence
Sales Channel
Financial Highlights
Income Statement
Revenue growth with EBITDA and PAT margins
| Financial Metric | FY 2024 | FY 2025 | FY 2026 |
|---|---|---|---|
| Revenue (₹ Cr) | 463.4 | 743.5 | 1,168.9 |
| Growth (%) | - | 60.4% | 57.2% |
| EBITDA (₹ Cr) | 28.1 | 65.9 | 147.1 |
| EBITDA Margin (%) | 6.1% | 8.9% | 12.6% |
| PAT (₹ Cr) | 9.0 | 33.3 | 84.7 |
| PAT Margin (%) | 1.9% | 4.5% | 7.2% |
OBSERVATIONS & INSIGHTS
Revenue increased by 57.21% in FY26 to ₹1,167.65 crore after growing 60.43% in FY25
EBITDA more than doubled to ₹147.08 crore in FY26 and margin expanded from 8.88% to 12.60%
PAT increased from ₹33.27 crore in FY25 to ₹84.68 crore in FY26; PAT margin rose to 7.25%
Balance Sheet
| Financial Metric | FY 2024 | FY 2025 | FY 2026 |
|---|---|---|---|
| Net Worth | ₹ 29.3 Cr | ₹ 62.6 Cr | ₹ 147.4 Cr |
| Total Assets | ₹ 196.1 Cr | ₹ 262.1 Cr | ₹ 363.3 Cr |
| Total Borrowing | ₹ 142.4 Cr | ₹ 165.8 Cr | ₹ 182.8 Cr |
| Reserves & Surplus | ₹ 26.1 Cr | ₹ 59.4 Cr | ₹ 96.4 Cr |
Cash Flow
| Financial Metric | FY 2024 | FY 2025 | FY 2026 |
|---|---|---|---|
CFI in Cr Cash used in / generated from investing activities. | -27.2 Cr | -22.9 Cr | -19.8 Cr |
CFF in Cr Cash from / used in financing activities. | +54.3 Cr | +13.3 Cr | +3.8 Cr |
CFO in Cr Cash generated from core business operations. | -25.3 Cr | +7.8 Cr | +30.0 Cr |
Working Capital
| Efficiency Metric | FY 2023 | FY 2024 | FY 2025 |
|---|---|---|---|
Debtor Days Average number of days taken to collect customer payments. | - | - | - |
Creditor Days Average time taken to pay suppliers and vendors. | - | - | - |
Inventory Days Average number of days inventory remains unsold. | - | - | - |
CCC (Cash Conversion Cycle) (Debtor Days + Inventory Days - Creditor Days) | - | - | - |
Financial Ratios
Measures the company’s leverage relative to shareholder equity.
OBSERVATIONS & INSIGHTS
Debt-to-equity improved from 2.65x in FY25 to 1.25x in FY26
Interest coverage increased from 4.92x to 6.13x due to stronger EBITDA
The current ratio improved from 1.04x to 1.41x as current assets expanded faster than current liabilities
ROCE increased from 25.17% to 44.26%, showing stronger operating returns on capital employed
ROA increased to 23.31%
Industry Overview
Industry Drivers
Lead-Acid Battery and Backup-Power Demand
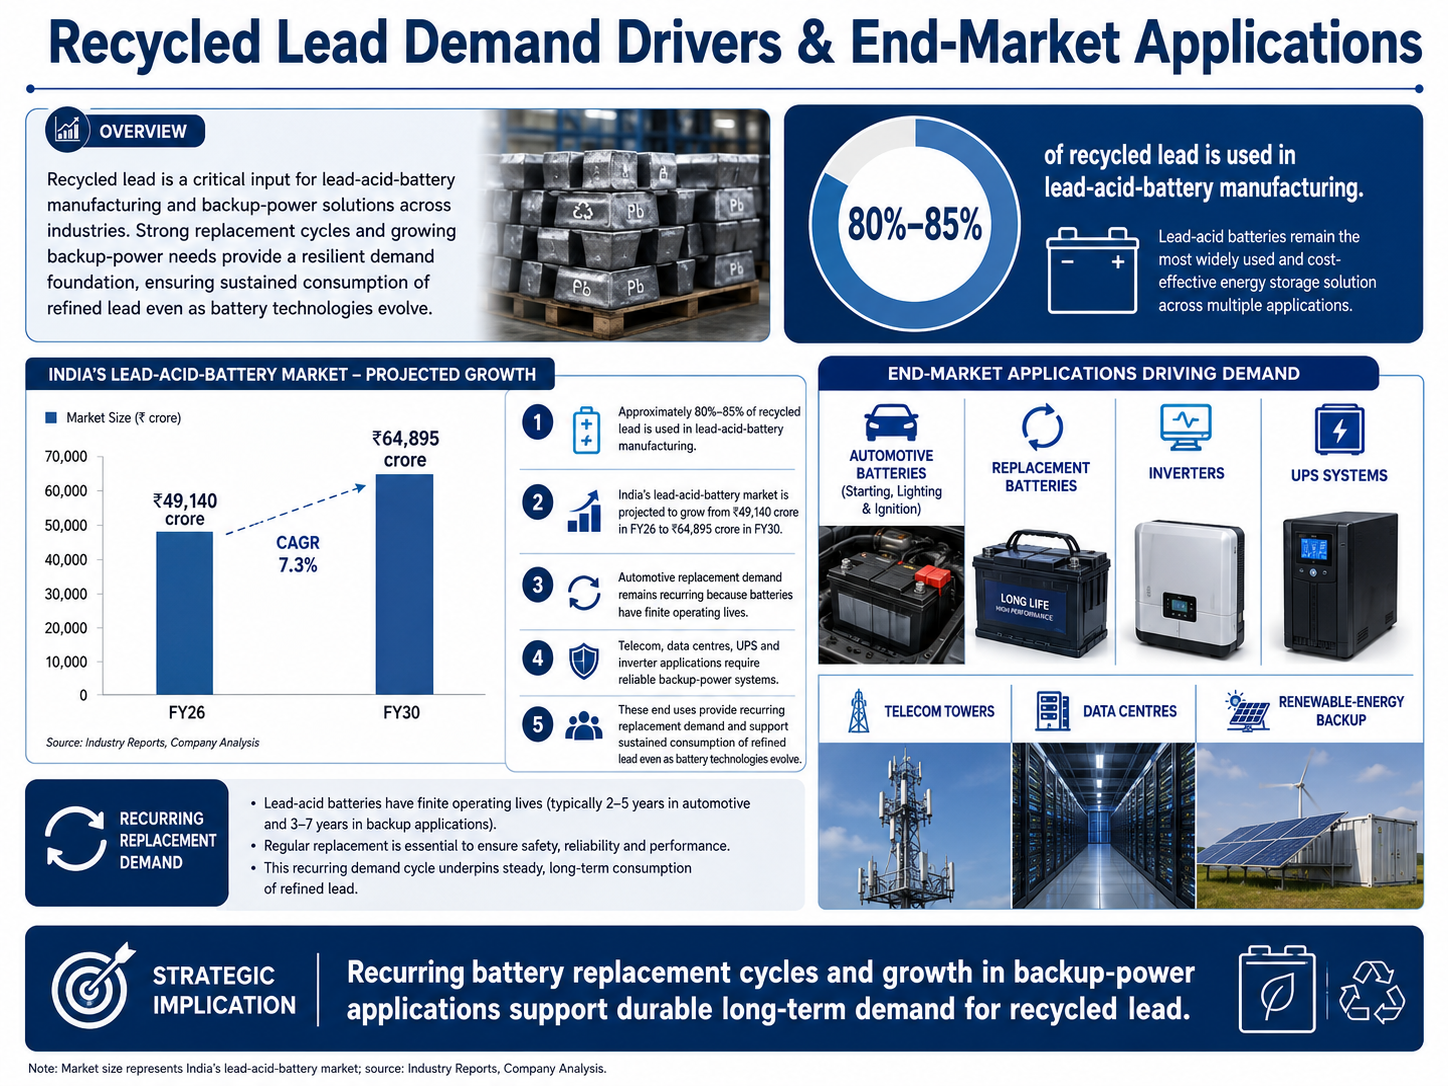
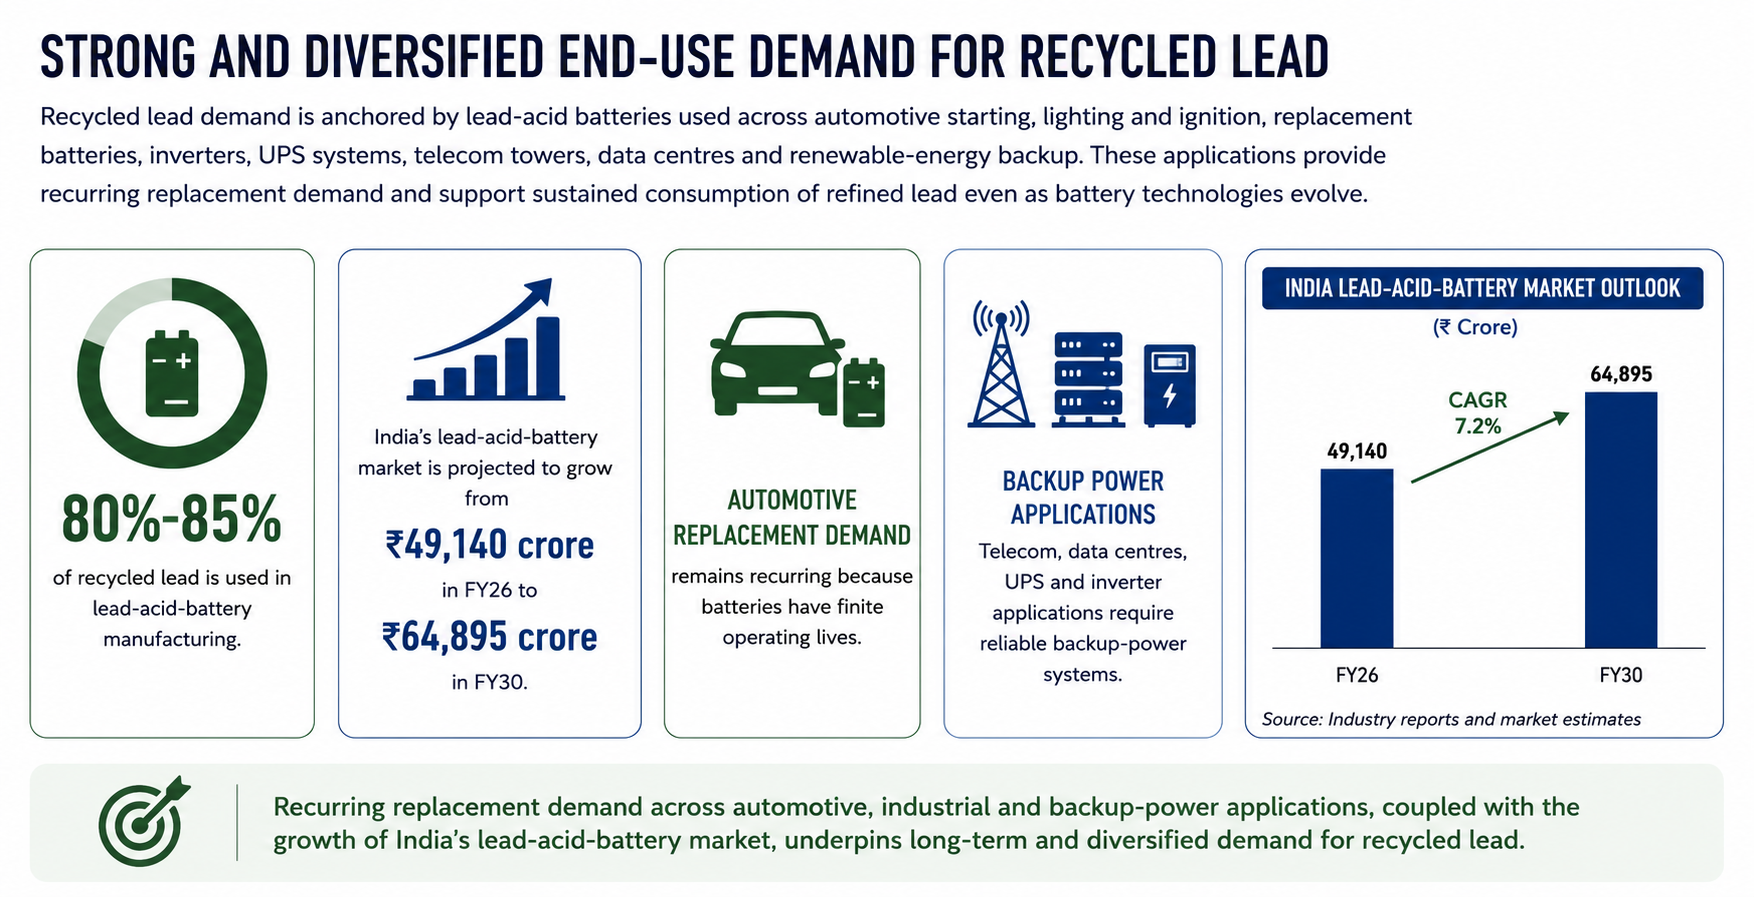
Recycled lead demand is anchored by lead-acid batteries used across automotive starting, lighting and ignition, replacement batteries, inverters, UPS systems, telecom towers, data centres and renewable-energy backup. These applications provide recurring replacement demand and support sustained consumption of refined lead even as battery technologies evolve.
The key details are:
Approximately 80%-85% of recycled lead is used in lead-acid-battery manufacturing
India’s lead-acid-battery market is projected to grow from ₹49,140 crore in FY26 to ₹64,895 crore in FY30
Automotive replacement demand remains recurring because batteries have finite operating lives
Telecom, data centres, UPS and inverter applications require reliable backup-power systems
Lead-acid batteries continue to be used for auxiliary functions in several electric-vehicle platforms
Circular Economy, Recycling Economics and Resource Security
Lead is highly recyclable and secondary lead can substitute mined primary metal in many battery and industrial applications. Recycling conserves natural resources, consume less energy than primary extraction and support domestic raw-material security, making organised recycling increasingly relevant to manufacturers and policymakers.
The key details are:
Recycled- lead production is estimated to be 30%-40% more cost effective than mining and refining primary lead
Used lead- acid batteries create a recurring feedstock pool through replacement cycles
Closed- loop recycling reduces dependence on virgin- metal extraction and imported refined lead
Organised recyclers can achieve higher recovery, traceability and pollution- control standards
Formalisation, EPR and Compliance-Led Entry Barriers
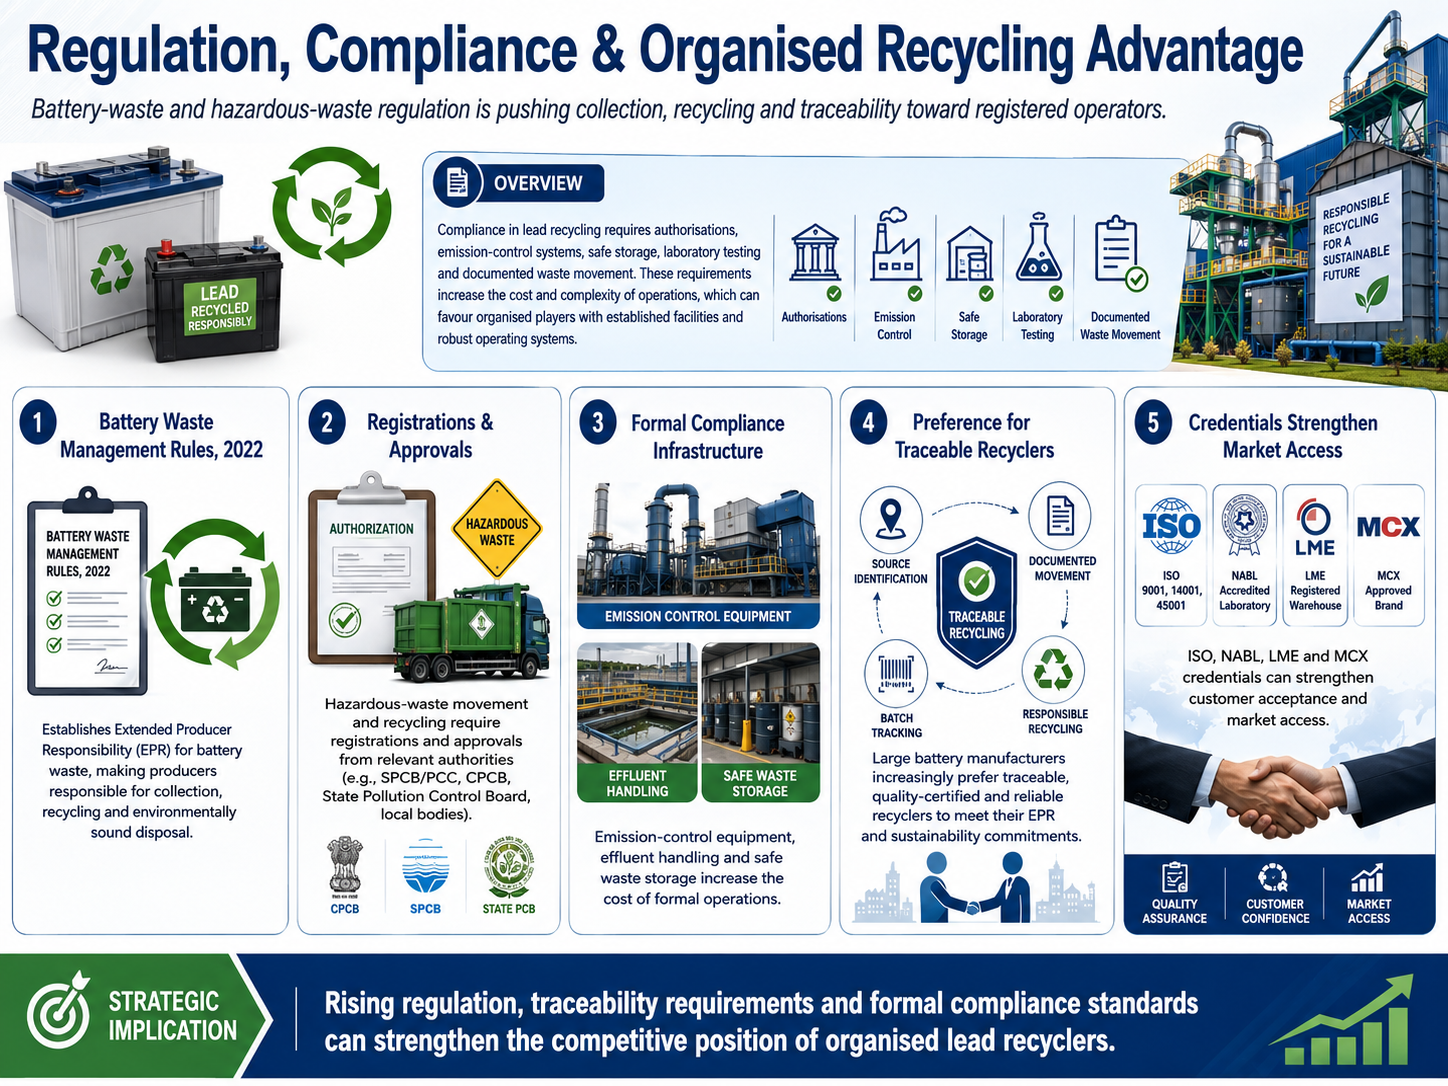
Battery-waste and hazardous-waste regulation is pushing collection, recycling and traceability toward registered operators. Compliance requires authorisations, emission-control systems, safe storage, laboratory testing and documented waste movement, which can favour organised players with established facilities and operating systems.
The key details are:
Battery Waste Management Rules, 2022 introduced extended producer responsibility for battery waste
Hazardous-waste movement and recycling require registrations and approvals from relevant authorities
Emission-control equipment, effluent handling and safe waste storage increase the cost of formal operations
Large battery manufacturers increasingly prefer traceable, quality-certified and reliable recyclers
ISO, NABL, LME and MCX credentials can strengthen customer acceptance and market access
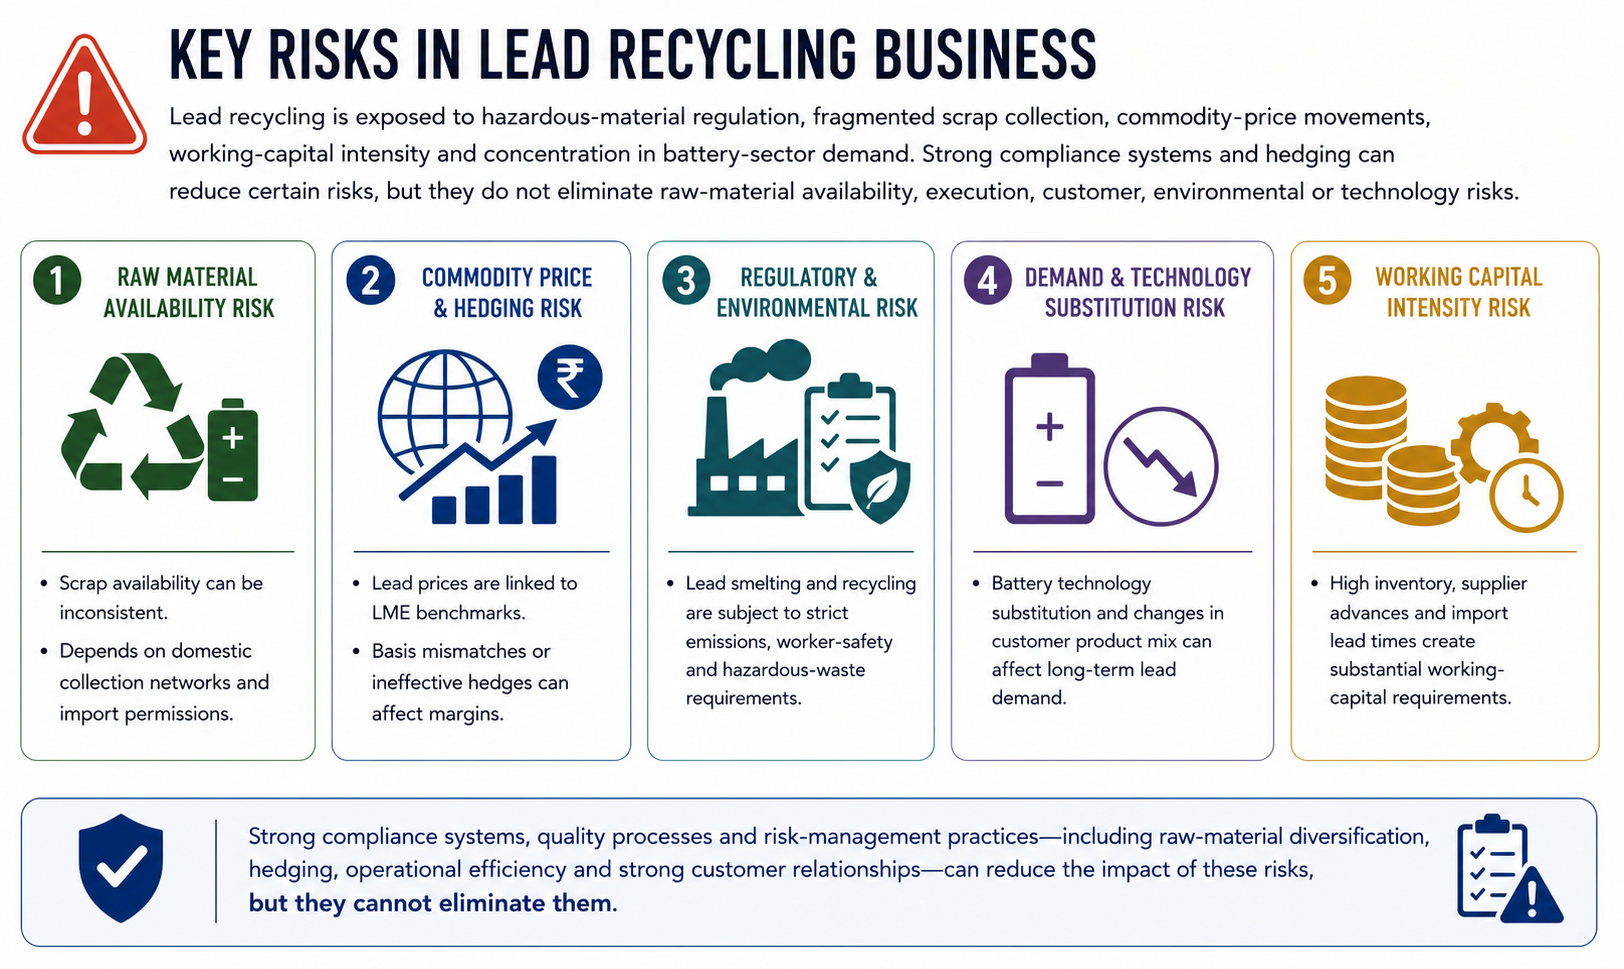
Risks in the Industry
Lead recycling is exposed to hazardous-material regulation, fragmented scrap collection, commodity-price movements, working-capital intensity and concentration in battery-sector demand. Strong compliance systems and hedging can reduce certain risks, but they do not eliminate raw-material availability, execution, customer, environmental or technology risks.
The key details are:
Scrap availability can be inconsistent and depends on domestic collection networks and import permissions
Lead prices are linked to LME benchmarks; basis mismatches or ineffective hedges can affect margins
Lead smelting and recycling are subject to strict emissions, worker-safety and hazardous-waste requirements
Battery technology substitution and changes in customer product mix can affect long-term lead demand
High inventory, supplier advances and import lead times create substantial working-capital requirements
Government Policy Support
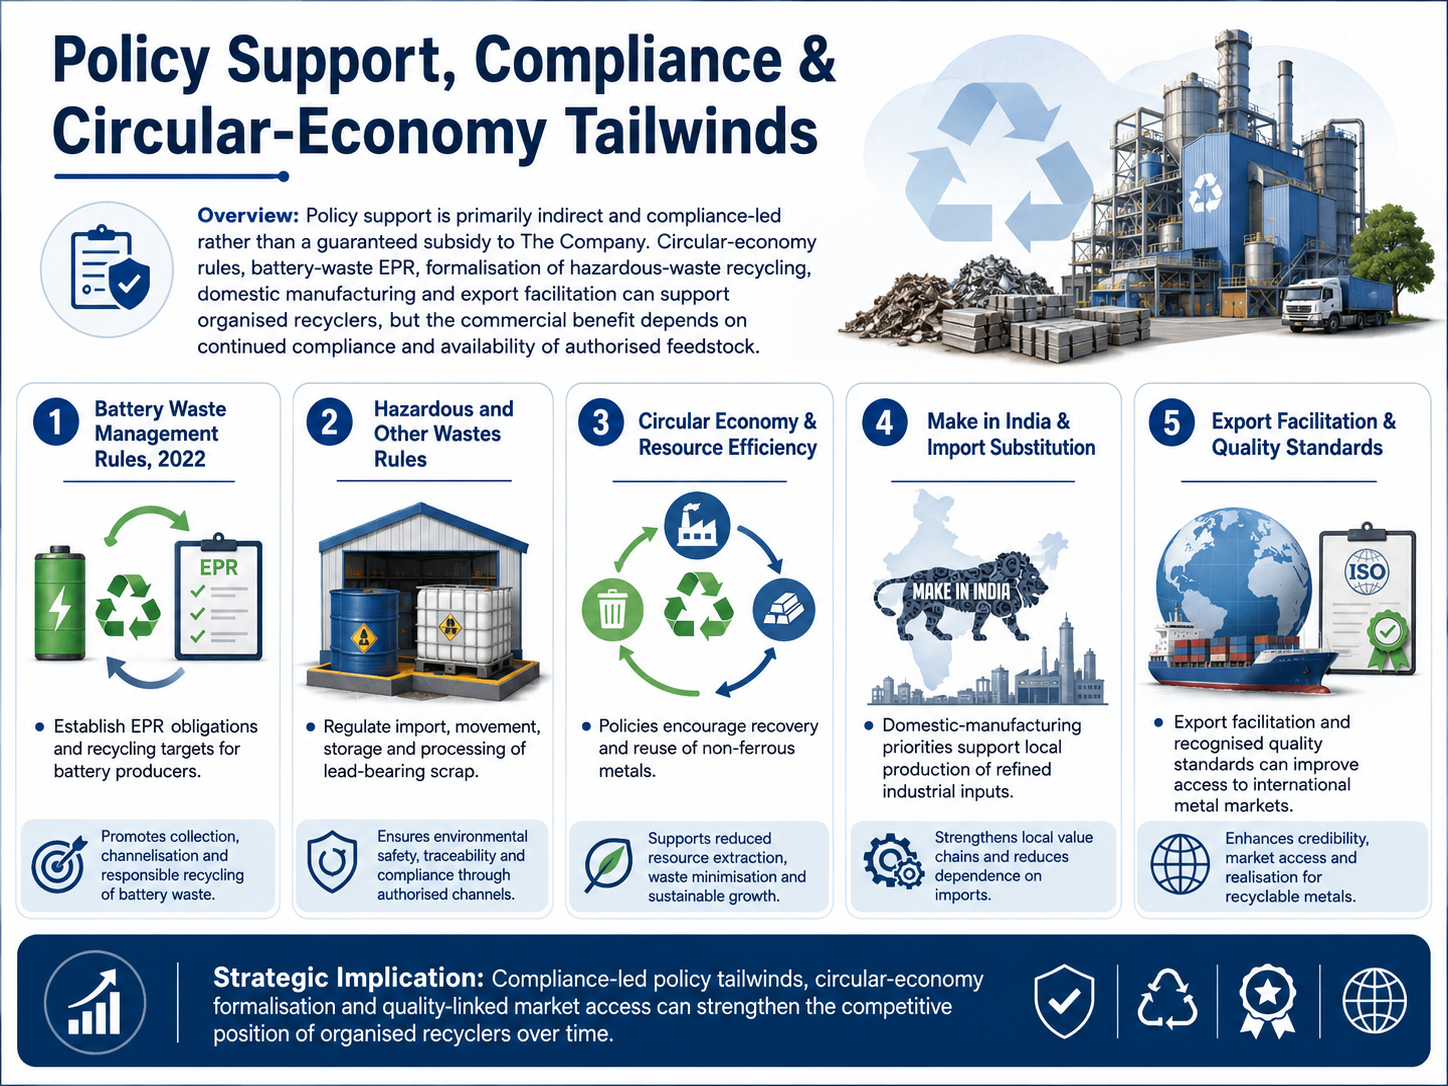
Policy support is primarily indirect and compliance-led rather than a guaranteed subsidy to the Company. Circular-economy rules, battery-waste EPR, formalisation of hazardous-waste recycling, domestic manufacturing and export facilitation can support organised recyclers, but the commercial benefit depends on continued compliance and availability of authorised feedstock.
The key details are:
Battery Waste Management Rules, 2022 establish EPR obligations and recycling targets for battery producers
Hazardous and Other Wastes Rules regulate import, movement, storage and processing of lead-bearing scrap
Circular-economy and resource-efficiency policies encourage recovery and reuse of non-ferrous metals
Make in India and import-substitution objectives support domestic production of refined industrial inputs
Export facilitation and recognised quality standards can improve access to international metal markets
Fundraise/Future Plans
Shareholding
Pre-issue shareholding
Promoter Holding 0.0%
Post-Issue Shareholding
Promoter Holding 0.0%
Category
Pre-Issue%Post-Issue%
Promoters
Sandeep Aggarwal
45.7%33.8%
Nikunj Aggarwal
45.4%33.6%
Esha Gupta
0.0%0.0%
Total Promoter Holding
91.1%67.4%
Additional Shareholders
0.0%0.0%
Total Additional Holding
0.0%0.0%
Total Shareholding
91.1%67.4%
Documentation
Documents & Filings
No documents available
- Overview
- Business
- Financial Highlights
- Industry Overview
- Fundraise/Future Plans
- Documentation
Get the Preqt App and keep in touch around the clock!
 Monitor your investments in real-time.
- Receive tailored deal suggestions.
- Get real-time updates and alerts.
