

Asset Reconstruction Co.(India)
Resolving Stress, Restoring ValueRecovering Value Responsibly
IPO Summary (PrEqT)
ARCIL is India's first asset reconstruction company and operates across Corporate, Retail and SME & Other stressed assets. FY26 AUM reached INR 20,150.0 Cr and acquisitions INR 5,958.8 Cr, while recoveries moderated to INR 3,484.4 Cr. On the RHP restated standalone basis, revenue from operations was INR 753.0 Cr, EBITDA INR 588.9 Cr and PAT INR 407.8 Cr; Debt/Equity was 0.39x. The IPO is a 100% OFS of 5,27,31,946 shares, aggregating INR 696.1-733.0 Cr, with no fresh proceeds to the Company. At INR 132.0-INR 139.0, FY26 P/E is 12.8x; recovery conversion, acquisition pricing and leverage remain the principal monitorables
IPO Review Rating
Average
MainboardResolving Stressed Assets Through Expertise, Discipline, and Structured Recovery
ARCIL is a well-established, profitable and strongly capitalised ARC with meaningful scale, institutional promoter backing and a growing Retail franchise. FY26 standalone PAT reached INR 407.8 Cr, AUM crossed INR 20,000.0 Cr, margins remain exceptionally high and cash generation is positive. The Company's balance sheet still carries manageable leverage despite a substantial FY26 increase in borrowing used to support acquisitions. The biggest positives for the IPO are the reasonable absolute valuation of 11.1x FY26 and 1.5x book value, strong merchant-banker track record, high operating profitability and ARCIL's established market position. The more important negatives are the 100.0% OFS structure, lack of fresh capital, moderate underlying Revenue growth, rising leverage, heavy regulatory dependence and material transaction flows with managed trusts.
PARAMETER
WEIGHT
SCORE
KEY FACTORS
Financial Summary
40.0%
4.0/5
Operating cash flow remained positive at INR 320.2 Cr in FY25 and INR 153.6 Cr in FY26
Show more
Detailed Analysis
Revenue from Operations increased from INR 570.1 Cr in FY24 to INR 596.4 Cr in FY25 and INR 753.0 Cr in FY26, translating to a 14.9% FY24–FY26 CAGR
FY26 EBITDA was INR 588.9 Cr, with EBITDA Margin of 78.2%, versus 82.5% in FY25 and 73.0% in FY24
PAT increased from INR 305.3 Cr in FY24 to INR 355.3 Cr in FY25 and INR 407.8 Cr in FY26; FY26 PAT Margin stood at 52.0%
D/E increased to 0.4x in FY26, from 0.1x in FY25 and 0.1x in FY24, but remains moderate
ROE improved gradually from 13.0% in FY24 to 13.6% in FY25 and 14.0% in FY26
Operating cash flow remained positive at INR 320.2 Cr in FY25 and INR 153.6 Cr in FY26
Industry
15.0%
3.0/5
The ARC industry is established rather than emerging, but a new growth cycle may develop through Retail, MSME and early-stage stressed assets
Show more
Detailed Analysis
Retail stressed assets have expanded at approximately 13.5% CAGR, while MSME stress grew at approximately 7.6% CAGR over FY22–FY26
ARCs have operated in India for over two decades, but the opportunity is shifting structurally toward Retail/MSME and early-stress assets
ARCs operate under a detailed RBI/SARFAESI regulatory framework covering capital, sponsors, KYC, governance, acquisition and resolution activities
Management
15.0%
3.0/5
ARCIL benefits from strong institutional sponsorship, an independent-majority Board and a professional management model
Show more
Detailed Analysis
ARCIL is promoted by Avenue India Resurgence, an Avenue Capital affiliate, and State Bank of India, combining global distressed-credit expertise and a major listed Indian banking institution
4 of 7 Directors are Independent, giving independent representation of approximately 57.1%
No material promoter encumbrance concern was identified, although SBI is involved in ordinary-course litigation and Avenue India has a pending tax matter
Standalone RPTs are high relative to Revenue because transactions with ARC-managed trusts form an inherent part of the operating model
Valuation
20.0%
3.0/5
ARCIL's absolute valuation is not aggressive on headline metrics: approximately 12.8x FY26 P/E and 1.5x P/B at the upper price band, alongside a 12.5% RoNW
Show more
Detailed Analysis
ARCIL is valued at 11.1x P/E at the upper band
FY26 EV/EBITDA is approximately 10.4x at the cap price
FY26 consolidated NAV is INR 91.0 per share, giving 1.5x P/B at INR 139.0
FY26 consolidated RoNW stood at 12.5%
Merchant Banker Track Record
10.0%
4.0/5
The merchant-banker consortium is a clear strength, recent deal cohorts have generated strong listing performance
Show more
Detailed Analysis
Average opening return of the three BRLMs across the 27 latest IPOs is approximately 16.8%
Representative recent issues recorded very strong demand, averaging approximately 94.3x across Tempsens, Augmont, Milky Mist and Gaja AAM
21 of 27, or approximately 77.8%, of the latest issues opened above issue price
IIFL, JM Financial and IDBI Capital provide a well-established Mainboard institutional syndicate
TOTAL
100%
3.5/5
Weighted Composite Score
Issue Price
₹132.0 to ₹139.0
As of 7 Sep 2026
GMP
₹0.0
As of 7 Sep 2026
Estimated Gain / Loss
0.0%
Lot Size
107.0 Shares
Grey Market Premium (GMPs) are shared for knowledge purpose only. PrEqt doesn’t promote or execute the trades.
| Issue Size (in Cr) | |
|---|---|
| Overall | ₹733.0 Cr |
| Fresh Issue | - |
| Offer for Sale | ₹733.0 Cr |
Minimum Investment
₹14,873.0 / 11,449 shares

Merchant Banker
IIFL Capital Services Ltd.; JM Financial; IDBI Capital
IPO Document
RHP / Anchor Document
Offer Start Date
9th Sept 2026
Offer End Date
11th Sept 2026
Valuation
₹4,516.1 Cr
Revenue
₹753.0 Cr
PAT (FY'26)
₹407.8 Cr
Issue Size (in Cr)
₹733.0 Cr
Face Value
₹ 10.0Offer Price
₹ 139.0Lot Size
107.0 sharesSale Type
OFS onlyPAT (FY'26)
₹ 407.8 CrPAT Margin (FY'26)
52.0 %P/E Multiple
11.1xEBITDA (FY'26)
₹ 588.9 CrCAGR Growth 2Y
14.9 %ROE (FY'26)
14.0 %ROCE (FY'26)
12.0 %Price to Book Value
1.5xDebt/Equity
0.4xCompany Website
www.arcil.co.inExplore new deals
Overview
Fund Allocation
Total: ₹0 CrSource:Company DRHP
Timeline
IPO Open Date
To Be Announced
IPO Close Date
To Be Announced
Tentative Allotment
To Be Announced
Initiation of Refunds
To Be Announced
Credit of Shares to Demat
To Be Announced
Tentative Listing Date
To Be Announced
Business
Business Model
Geographical Presence
Sales Channel
Key Risk Factor
Financial Highlights
Income Statement
Revenue growth with EBITDA and PAT margins
| Financial Metric | FY 2024 | FY 2025 | FY 2026 |
|---|---|---|---|
| Revenue (₹ Cr) | 570.1 | 596.4 | 753.0 |
| Growth (%) | - | 4.6% | 26.2% |
| EBITDA (₹ Cr) | 416.4 | 491.9 | 588.9 |
| EBITDA Margin (%) | 73.0% | 82.5% | 78.2% |
| PAT (₹ Cr) | 305.3 | 355.3 | 407.8 |
| PAT Margin (%) | 53.2% | 57.0% | 52.0% |
OBSERVATIONS & INSIGHTS
Revenue from Operations in FY25 increased 4.6% as higher investment income and fair-value gains outweighed lower recoveries / write-backs. FY26 rose 26.3% as fees and other income increased 62.9% and fair-value gains increased 64.8%
EBITDA increased from 18.1% in FY25 to 19.7% in FY26 as fee, investment and fair-value income scaled faster than core operating costs
EBITDA Margin expanded to 82.5% in FY25, then moderated to 78.2% in FY26 as SR / fee write-offs, impairment and other operating expenses rose faster than revenue
PAT rose to 16.4% in FY25 and 14.8% in FY26; FY26 growth was supported by higher operating income, but partly offset by sharply higher finance costs, write-offs and deferred tax
PAT Margin improved to 57.0% in FY25 but declined to 52.0% in FY26 because total expenses rose 61.0%, including a 136.5% increase in SR / fee write-offs and a 189.7% increase in finance costs
Balance Sheet
| Financial Metric | FY 2024 | FY 2025 | FY 2026 |
|---|---|---|---|
| Net Worth | ₹ 2,462.5 Cr | ₹ 2,767.8 Cr | ₹ 3,079.4 Cr |
| Total Assets | ₹ 2,795.3 Cr | ₹ 3,263.8 Cr | ₹ 4,460.9 Cr |
| Total Borrowing | ₹ 149.9 Cr | ₹ 305.9 Cr | ₹ 1,205.5 Cr |
| Reserves & Surplus | ₹ 2,137.6 Cr | ₹ 2,442.9 Cr | ₹ 2,754.5 Cr |
OBSERVATIONS & INSIGHTS
Total Assets increased 36.7% in FY26, primarily due to growth in the stressed-asset portfolio and higher security-receipt investments
Investments rose to INR 4,024.7 Cr as acquisitions of security receipts net of redemptions increased materially in FY26
Cash & Bank Balances reduced as funds were deployed into stressed-asset acquisitions and temporary deposits were released / distributed after litigation or court-related restrictions were resolved
Total Equity increased to INR 3,079.4 Cr, primarily due to retained earnings, but declined as a share of total assets as leverage increased
Borrowings rose to INR 1,205.5 Cr, including INR 818.9 Cr due within 12 months and INR 386.6 Cr due after 12 months, as working-capital term loans and term loans were raised to fund acquisitions
Cash Flow
| Financial Metric | FY 2024 | FY 2025 | FY 2026 |
|---|---|---|---|
CFO (₹ Cr) Cash generated from core business operations. | +203.5 Cr | +320.2 Cr | +153.6 Cr |
CFI (₹ Cr) Cash used for investments and long-term assets. | -16.3 Cr | -609.9 Cr | -1,024 Cr |
CFF (₹ Cr) Cash flow related to funding and borrowings. | -55.1 Cr | +94.2 Cr | +766.3 Cr |
Financial Ratios
Measures the company’s leverage relative to shareholder equity.
OBSERVATIONS & INSIGHTS
ROE improved to 14.0% in FY26 as standalone PAT grew 14.8% while average net worth expanded more gradually
ROA moderated to 10.6% because total assets increased sharply with security-receipt investments and acquisitions, outpacing profit growth
Debt / Equity rose to 0.39x from 0.11x as borrowings increased to INR 1,205.5 Cr to fund working-capital and acquisition requirements
ROCE fell to 13.7% as capital employed expanded materially through debt-funded acquisitions faster than EBIT
Industry Overview
Industry Drivers
Retail Credit Expansion and Shift Toward Granular Stress
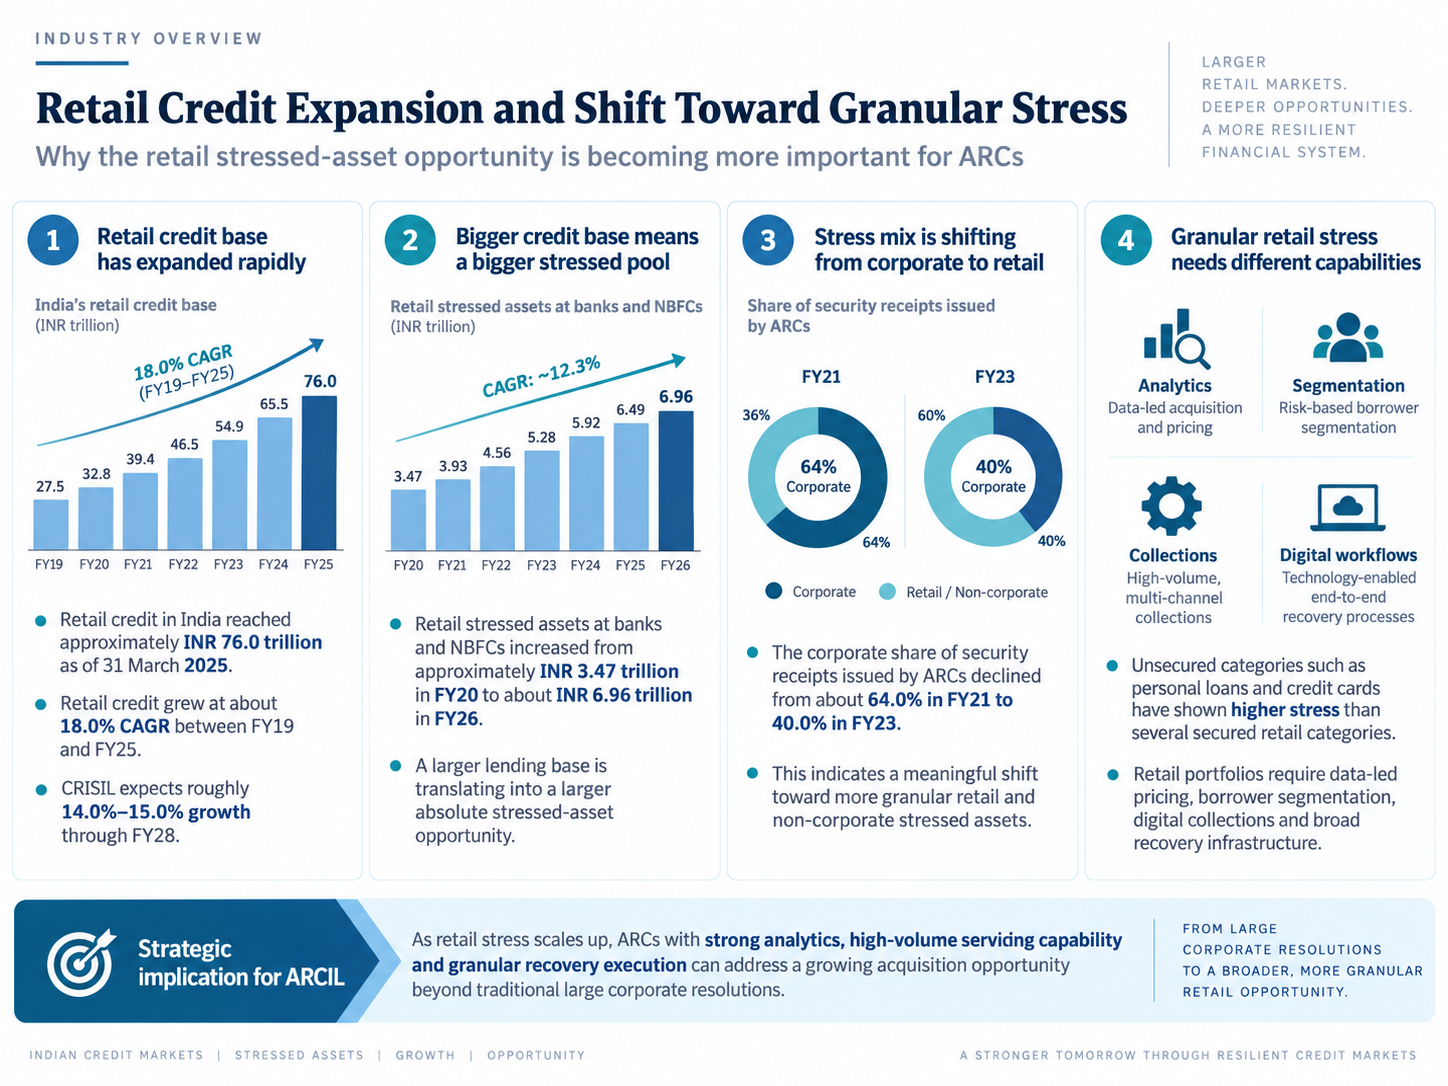
Retail credit has expanded rapidly across banks and NBFCs, increasing the absolute pool from which future delinquencies, write-offs and stressed-asset sales can emerge. Unlike traditional large corporate NPA resolutions, Retail portfolios involve high volumes of small-ticket secured and unsecured accounts, making data-led pricing, borrower segmentation, digital collections and broad recovery infrastructure increasingly important for ARCs
Retail credit in India reached approximately INR 76.0 trillion as of March 31, 2025 after growing at about 18.0% CAGR between FY19 and FY25; CRISIL expects roughly 14.0%-15.0% growth through FY28
Overall Retail stressed assets at banks and NBFCs increased from approximately INR 3.47 trillion in FY20 to about INR 6.96 trillion in FY26, indicating that a larger credit base is translating into a larger absolute stressed pool
The stressed-asset mix is already shifting away from corporates: the corporate share of security receipts issued by ARCs declined from about 64.0% in FY21 to 40.0% in FY23
Unsecured categories such as personal loans and credit cards have shown higher stress than several secured Retail categories, increasing the need for specialised high-volume recovery capabilities
MSME / MFI Stress Expands the Non-Corporate Opportunity
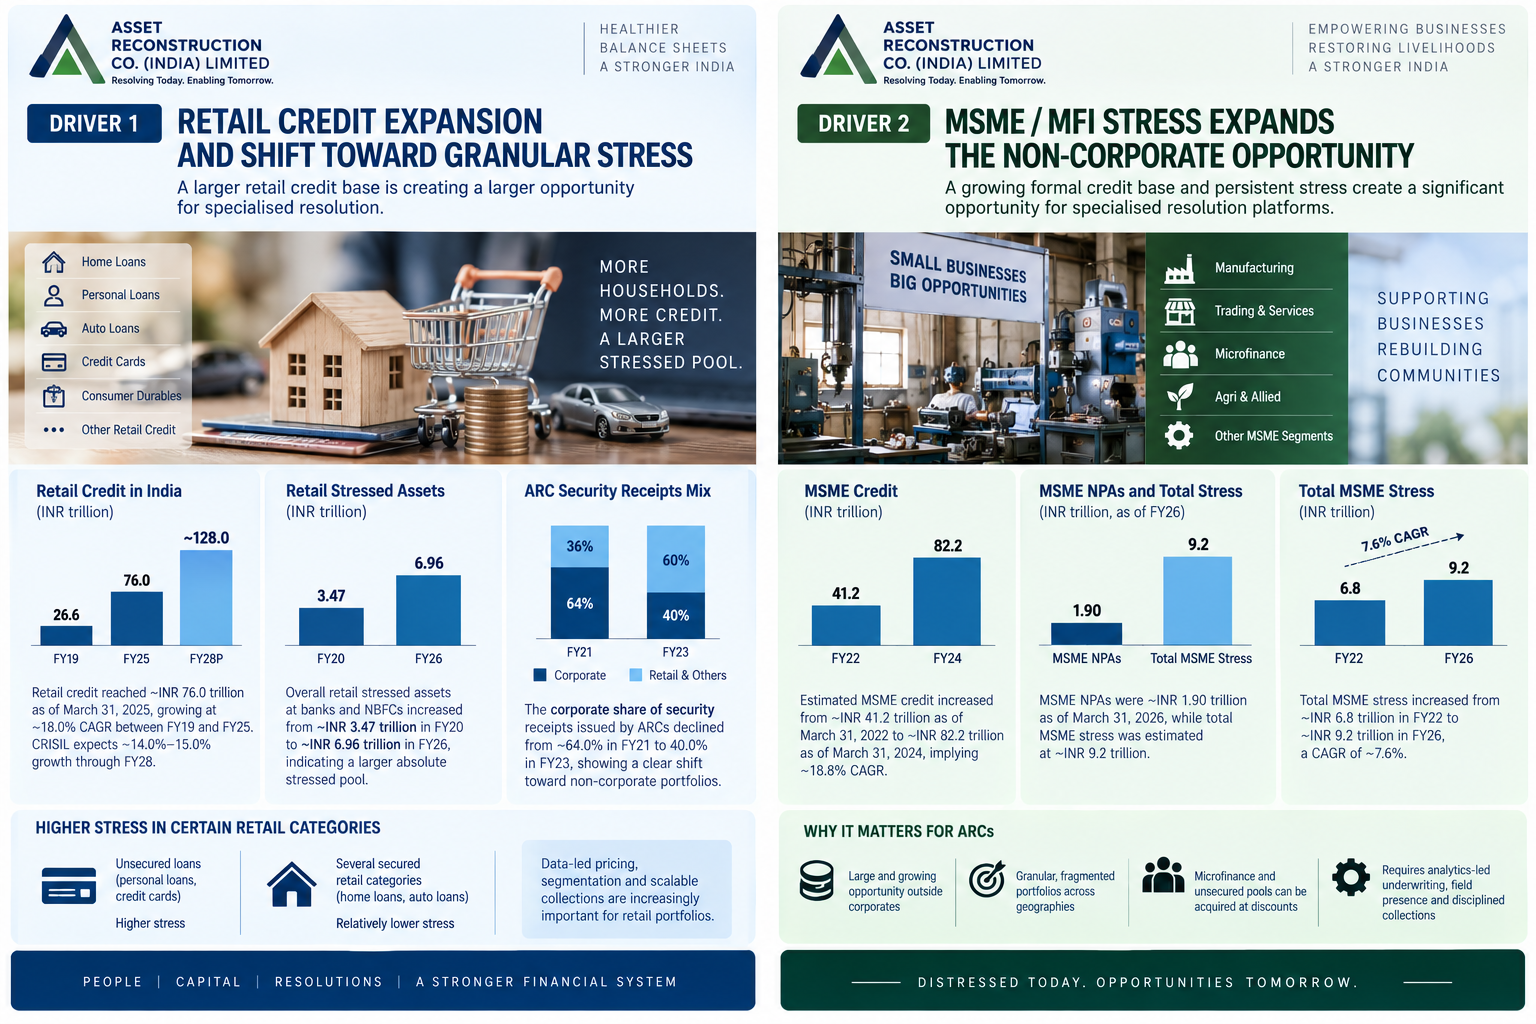
MSME and microfinance credit add a second granular opportunity outside Retail. These portfolios are fragmented across borrowers and geographies and can include weaker collateral or fully unsecured exposures, so acquisition economics depend on disciplined portfolio-level underwriting and scalable field collections. As formal credit penetration rises, even moderate delinquency rates can create a substantial stressed-asset pool for specialised resolution platforms
Estimated MSME credit increased from approximately INR 41.2 trillion as of March 31, 2022 to INR 82.2 trillion as of March 31, 2024, implying about 18.8% CAGR
MSME NPAs were approximately INR 1.90 trillion as of March 31, 2026, while total MSME stress was estimated at approximately INR 9.2 trillion
Total MSME stress increased from approximately INR 6.8 trillion in FY22 to INR 9.2 trillion in FY26, a CAGR of about 7.6%
Microfinance and unsecured pools create additional acquisition opportunities because portfolios can be purchased at discounts, but successful economics require borrower-level analytics, field presence and collection discipline
Earlier Stress Recognition and Improving Recovery Economics
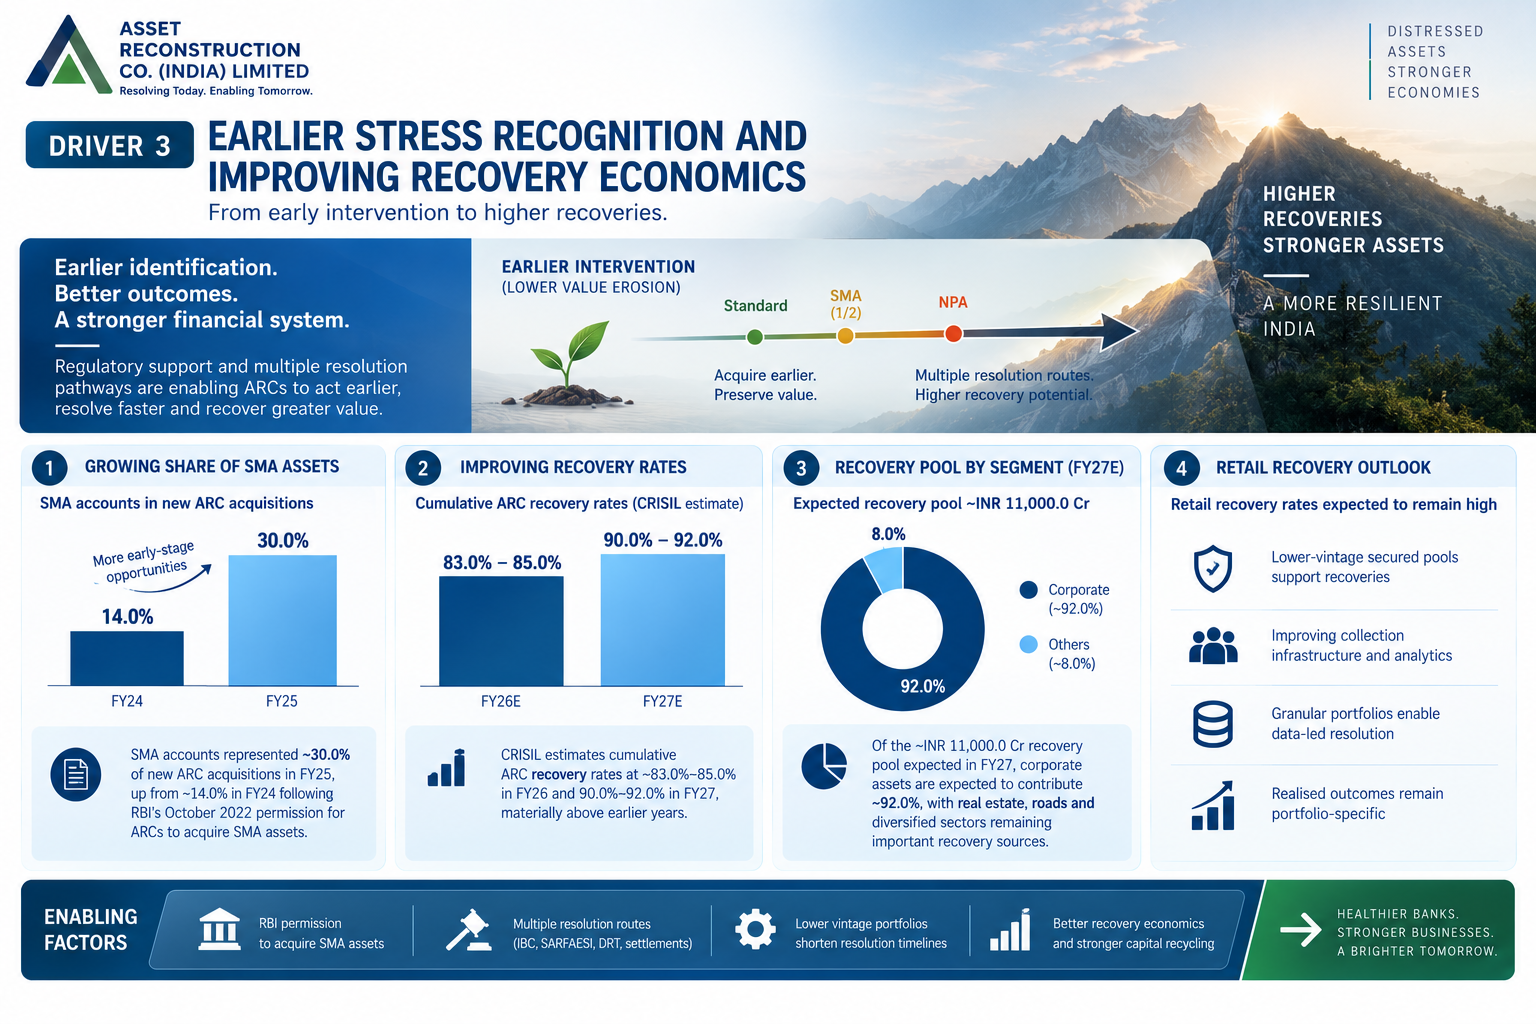
The industry is gradually moving from late-stage NPA resolution toward earlier intervention. RBI permission to acquire SMA accounts allows ARCs to enter before value erosion becomes severe, while IBC, SARFAESI, DRT and negotiated settlement routes provide multiple recovery pathways after acquisition. Lower-vintage portfolios can shorten resolution timelines and improve the probability of recovering value before collateral or borrower economics deteriorate further
SMA accounts represented approximately 30.0% of new ARC acquisitions in FY25, up from about 14.0% in FY24 following RBI's October 2022 permission for ARCs to acquire SMA assets
CRISIL estimates cumulative ARC recovery rates at approximately 83.0%-85.0% in FY26 and 90.0%-92.0% in FY27, materially above earlier years
Of the approximately INR 11,000.0 Cr recovery pool expected in FY27, corporate assets are expected to contribute about 92.0%, with real estate, roads and diversified sectors remaining important recovery sources
Retail cumulative recovery rates are expected to remain high, supported by lower-vintage secured pools and improving collection infrastructure, although realised outcomes remain portfolio-specific
Government Policy Support
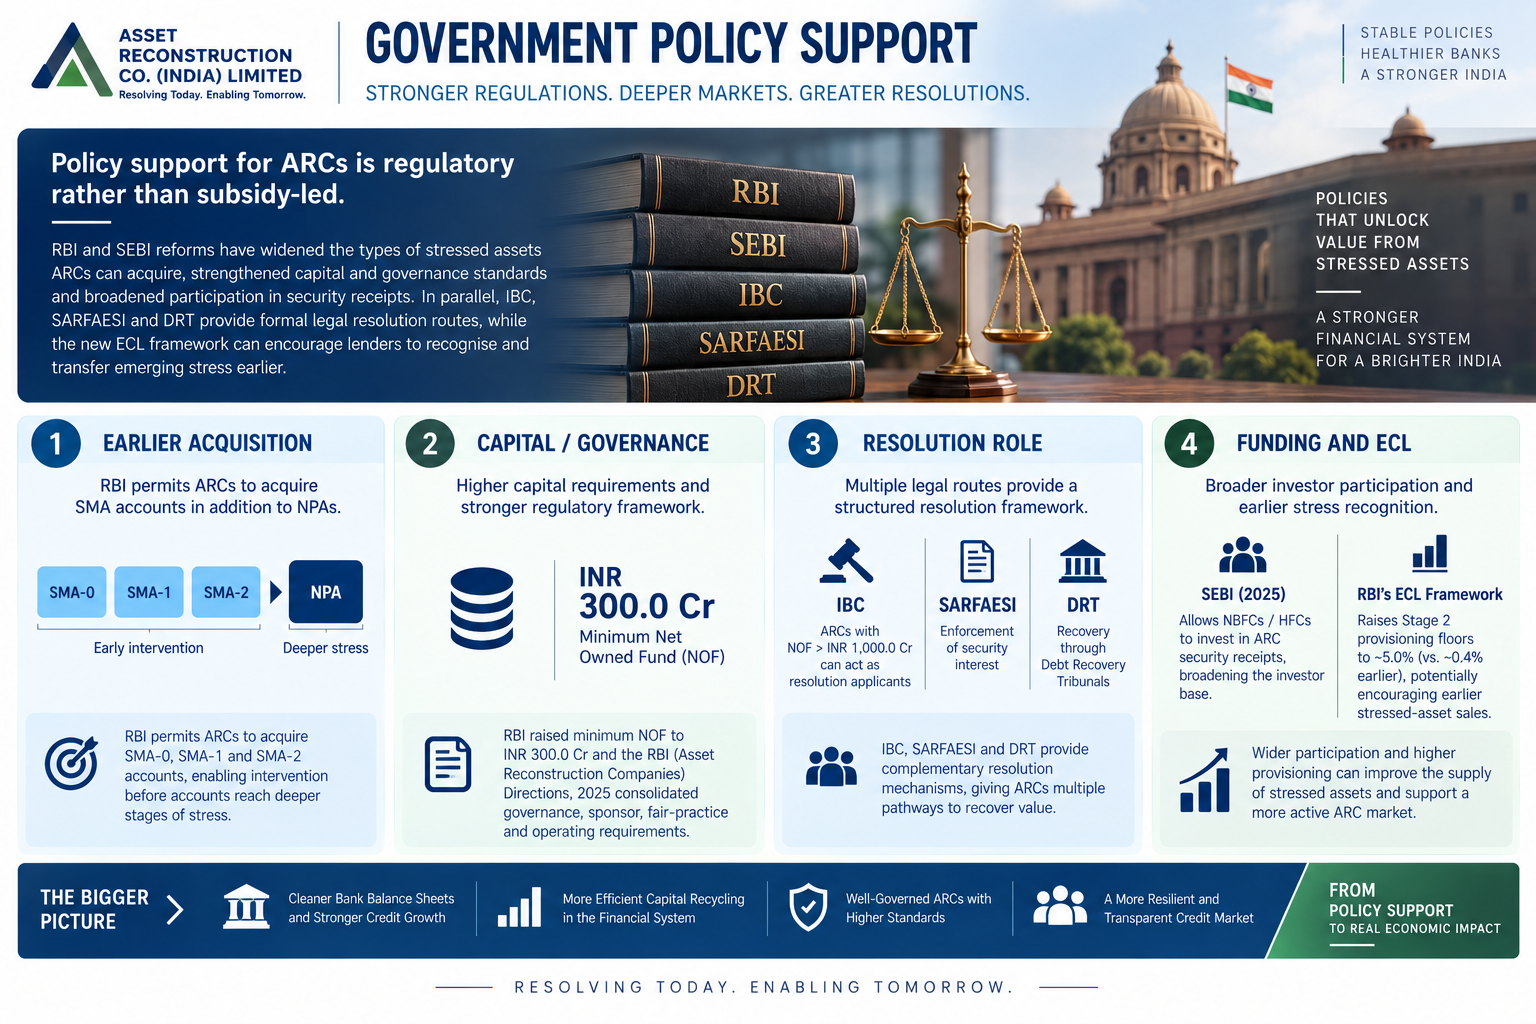
Policy support for ARCs is regulatory rather than subsidy-led. RBI and SEBI reforms have widened the types of stressed assets ARCs can acquire, strengthened minimum capital and governance standards and broadened participation in security receipts. In parallel, IBC, SARFAESI and DRT provide formal legal resolution routes, while the new ECL framework can encourage lenders to recognise and transfer emerging stress earlier
Earlier acquisition: RBI permits ARCs to acquire SMA-0, SMA-1 and SMA-2 accounts in addition to NPAs, enabling intervention before accounts reach deeper stages of stress
Capital / governance: RBI raised minimum Net Owned Fund to INR 300.0 Cr and the RBI (Asset Reconstruction Companies) Directions, 2025 consolidated governance, sponsor, fair-practice and operating requirements
Resolution role: ARCs with NOF above INR 1,000.0 Cr can act as resolution applicants under IBC, while SARFAESI and DRT remain established enforcement and recovery mechanisms
Funding and ECL: SEBI's 2025 framework allows NBFCs / HFCs to invest in ARC security receipts, while RBI's ECL framework raises Stage 2 provisioning floors to about 5.0% versus roughly 0.4% earlier, potentially encouraging earlier stressed-asset sales
Fundraise/Future Plans
Shareholding
Pre-issue shareholding
Promoter Holding 0.0%
Category
Pre-Issue%
Promoters
0.0%
Total Promoter Holding
0.0%
Additional Shareholders
0.0%
Total Additional Holding
0.0%
Total Shareholding
0.0%
- Overview
- Business
- Financial Highlights
- Industry Overview
- Fundraise/Future Plans
- Documentation
Get the Preqt App and keep in touch around the clock!
 Monitor your investments in real-time.
- Receive tailored deal suggestions.
- Get real-time updates and alerts.
