

Augmont Enterprises
Gold Made AccessiblePurity. Trust. Value.
IPO Summary (PrEqT)
Augmont is an integrated gold and silver platform spanning B2B bullion trading, refining, digital gold, investment products, jewellery and international sales. The platform combines procurement, two refineries, physical delivery, real-time B2B price discovery, digital consumer distribution and recycling, reducing dependence on any single point in the value chain. FY26 revenue from operations was INR 94,186.2 Cr and PAT was INR 348.3 Cr, with FY24-FY26 revenue CAGR of ~64.2% and PAT CAGR of ~114.1%, borrowings declined to INR 12.7 Cr in FY26 and the Group remained net cash; however, the operating model itself requires significant short-duration liquidity for margins, doré imports and bullion inventory. EBITDA margin is only 0.4% because bullion trading is a scale/spread business. FY26 operating cash flow turned negative despite strong profits, largely due to working-capital movements and tax payments. The core economic engine is the high-volume, low-unit-margin Augmont SPOT business, while the consumer stack is expanding rapidly through Gold For All and partner distribution. The IPO is primarily growth capital: INR 465.0 Cr is earmarked for working capital rather than debt repayment.
IPO Review Rating
May Apply
MainboardDelivering Trusted Precious Metal Solutions Across India’s Growing Market
Augmont is a high-growth, high-ROE and near-debt-free bullion platform, but the headline INR 94,186.2 Cr revenue needs to be viewed against extremely thin margins and a working-capital-intensive model. The strongest structural positives are scale, formalisation tailwinds and the 75.1% fresh issue; the biggest concerns are RPT dependence, customer concentration and FY26 negative OCF. Valuation cannot yet be called cheap or expensive on relative multiples because there is no valid listed peer set.
PARAMETER
WEIGHT
SCORE
KEY FACTORS
Financial Performance
40.0%
3.0/5
Augmont has exceptional revenue growth, almost no financial leverage and very high ROE, but these strengths need to be interpreted in the context of a bullion-trading model with only 0.4% EBITDA margin and 0.4% PAT margin.
Show more
Detailed Analysis
Revenue increased from INR 34,921.5 Cr in FY24 to INR 66,230.8 Cr in FY25 and INR 94,186.2 Cr in FY26, representing a FY24–FY26 CAGR of approximately 64.2%
EBITDA increased from INR 103.9 Cr in FY24 to INR 304.1 Cr in FY25 and INR 386.0 Cr in FY26, but FY26 EBITDA margin remained only 0.4% because bullion value largely passes through revenue
PAT increased from INR 76.0 Cr in FY24 to INR 227.2 Cr in FY25 and INR 348.3 Cr in FY26, but FY26 PAT margin was only 0.4%
Total borrowings declined from INR 54.9 Cr in FY24 to INR 21.5 Cr in FY25 and INR 12.7 Cr in FY26, while FY26 D/E fell to 0.01x
ROE remained extremely strong at 49.9% in FY24, 74.2% in FY25 and 51.0% in FY26
OCF was INR 96.7 Cr in FY24, INR 105.4 Cr in FY25 and INR -42.2 Cr in FY26, resulting in weaker FY26 cash conversion
Industry
15.0%
3.0/5
The industry backdrop is structurally favourable, supported by a 17.0% market CAGR and movement from unorganised to organised bullion channels.
Show more
Detailed Analysis
India's bullion trading market is estimated to grow from approximately INR 2,35,900.0 Cr in FY25 to INR 5,17,300.0 Cr by FY30, implying CAGR of approximately 17.0%
Organised bullion penetration is expected to increase from approximately 41% in FY25 to 44–46% by FY30, supported by formalisation, hallmarking, digital trading and IIBX
Bullion procurement, imports, refining, digital gold and related financial products operate across DGFT, BIS, RBI, SEBI and IFSCA-linked frameworks, with import-duty changes capable of altering economics materially
Management
15.0%
3.0/5
Management continuity, board independence and the absence of promoter pledges are positives. However, related-party dependence is unusually high, particularly because a Promoter Group company is also Augmont's largest customer.
Show more
Detailed Analysis
Ketan Kothari and Mahendra Bafna have each been associated with the Company since incorporation and have more than 13 years of bullion-industry operating experience within Augmont
The Board consists of 8 directors, including 4 Independent Directors, representing exactly 50.0% independence
No promoter shares are pledged, and the RHP states there are no outstanding criminal, material civil or regulatory proceedings against the Promoters and no SEBI/stock-exchange disciplinary action in the last five fiscals
OFS represents only 24.8% of the IPO. Promoter ownership is estimated to decline from 92.7% pre-offer to approximately 81.9% post-offer, indicating substantial continuing promoter ownership
Valuation
20.0%
2.0/5
Augmont's standalone historical P/E of 19.5x looks optically reasonable and the 49.5% RoNW is excellent, but the stock is expensive at 7.10x book.
Show more
Detailed Analysis
The cap price of INR 788.0 represents approximately 7.1x FY26 NAV of INR 111.0 per share
Augmont trades at approximately 19.5x P/E, FY26 EPS at INR 788.0, but the RHP expressly states that no listed company in India or globally has a sufficiently similar business model for a valid peer P/E comparison
FY26 RoNW stands at 49.5%, comfortably above the framework's top threshold
Merchant Banker Track Record
10.0%
3.0/5
The BRLM consortium is institutionally strong, while the representative recent mainboard sample shows moderate average listing gains of 5.5% and subscription of 8.3x.
Show more
Detailed Analysis
The four representative recent mainboard mandates produced an average listing return of approximately 5.5%
Representative average subscription was approximately 8.3x
3 of the 4 representative IPOs opened above issue price, giving a 75% positive-listing rate
The issue is handled by a four-BRLM consortium including Nuvama, JM Financial and Motilal Oswal, alongside Intensive Fiscal Services
TOTAL
100%
2.8/5
Weighted Composite Score
Issue Price
₹750.0 to ₹788.0
As of 29 Aug 2026
GMP
₹330.0
As of 29 Aug 2026
Estimated Gain / Loss
+41.9%
Lot Size
19.0 Shares
Grey Market Premium (GMPs) are shared for knowledge purpose only. PrEqt doesn’t promote or execute the trades.
| Issue size | |
|---|---|
| Overall | ₹825.0 Cr |
| Fresh Issue | ₹620.0 Cr |
| Offer for Sale | ₹205.0 Cr |
Minimum Investment
₹14,972.0 / 361 shares

Merchant Banker
Nuvama Wealth Management Ltd.; JM Financial; Motilal Oswal; Intensive Fiscal Services
IPO Document
RHP / Anchor Document
Offer Start Date
21st Aug 2026
Offer End Date
25th Aug 2026
Valuation
₹7,200.2 Cr
Revenue (FY'26)
₹94,282.5 Cr
PAT (FY'26)
₹348.3 Cr
Issue Size
₹825.0 Cr
Face Value
₹ 5.0Offer Price
₹ 788.0Lot Size
19.0 sharesSale Type
Fresh capital cum OFSPAT (FY'26)
₹ 348.3 CrPAT Margin (FY'26)
0.4 %P/E Multiple
19.5xEBITDA (FY'26)
₹ 385.9 CrCAGR Growth 2Y
64.2 %ROE (FY'26)
51.0 %ROCE (FY'26)
40.3 %Price to Book Value
7.1xDebt/Equity
0.0xCompany Website
www.augmont.comExplore new deals
Overview
Fund Allocation
Total: ₹0 CrSource:Company DRHP
Timeline
IPO Open Date
To Be Announced
IPO Close Date
To Be Announced
Tentative Allotment
To Be Announced
Initiation of Refunds
To Be Announced
Credit of Shares to Demat
To Be Announced
Tentative Listing Date
To Be Announced
Business
Business Model
Geographical Presence
Sales Channel
Key Risk Factor
Financial Highlights
Income Statement
Revenue growth with EBITDA and PAT margins
| Financial Metric | FY 2024 | FY 2025 | FY 2026 |
|---|---|---|---|
| Revenue (₹ Cr) | 34,948.9 | 66,252.1 | 94,282.5 |
| Growth (%) | 11.6% | 89.7% | 42.2% |
| EBITDA (₹ Cr) | 103.9 | 304.1 | 386.0 |
| EBITDA Margin (%) | 0.3% | 0.5% | 0.4% |
| PAT (₹ Cr) | 76.0 | 227.2 | 348.3 |
| PAT Margin (%) | 0.2% | 0.3% | 0.4% |
OBSERVATIONS & INSIGHTS
FY25 revenue rose 89.66% on higher bullion/jewellery volumes and prices; FY26 added another 42.21%, driven by higher gold/silver bullion and jewellery sales plus higher gold prices
EBITDA increased from INR 103.9 Cr in FY24 to INR 386.0 Cr in FY26. Margin expanded in FY25 but moderated from 0.46% to 0.41% in FY26 - still an improvement over FY24’s 0.30%
PAT increased from INR 76.0 Cr to INR 348.3 Cr over FY24-FY26; FY26 PAT grew 53.31%, faster than revenue, supported by operating scale and sharply lower finance costs
Balance Sheet
| Financial Metric | FY 2024 | FY 2025 | FY 2026 |
|---|---|---|---|
| Net Worth | ₹ 187.4 Cr | ₹ 414.7 Cr | ₹ 932.8 Cr |
| Total Assets | ₹ 760.3 Cr | ₹ 1,857.3 Cr | ₹ 1,257.0 Cr |
| Total Borrowing | ₹ 54.9 Cr | ₹ 21.5 Cr | ₹ 12.7 Cr |
| Reserves & Surplus | ₹ 180.4 Cr | ₹ 398.5 Cr | ₹ 865.1 Cr |
OBSERVATIONS & INSIGHTS
Total equity increased from INR 187.2 Cr in FY24 to INR 932.8 Cr in FY26, supported by retained profits, securities premium/private placement and conversion/issuance activity
Total borrowings fell from INR 54.9 Cr in FY24 to INR 12.7 Cr in FY26, leaving the Group net cash even before IPO proceeds
Cash Flow
| Financial Metric | FY 2024 | FY 2025 | FY 2026 |
|---|---|---|---|
CFO in Cr Cash generated from core business operations. | +96.7 Cr | +105.4 Cr | -42.2 Cr |
CFI in Cr Cash used in / generated from investing activities. | +168.4 Cr | -61.0 Cr | -51.3 Cr |
CFF in Cr Cash from / used in financing activities. | -159.9 Cr | -47.0 Cr | +6.7 Cr |
Working Capital
| Efficiency Metric | FY 2023 | FY 2024 | FY 2025 |
|---|---|---|---|
Debtor Days Average number of days taken to collect customer payments. | - | - | - |
Creditor Days Average time taken to pay suppliers and vendors. | - | - | - |
Inventory Days Average number of days inventory remains unsold. | - | - | - |
CCC (Cash Conversion Cycle) (Debtor Days + Inventory Days - Creditor Days) | - | - | - |
Financial Ratios
Measures the company’s leverage relative to shareholder equity.
OBSERVATIONS & INSIGHTS
ROCE rose to 70.1% in FY25 but declined to 40.3% in FY26 despite higher EBIT because capital employed expanded materially following equity infusion / conversion and the normalisation of current liabilities. ROE shows a similar moderation to 51.0%
Current Ratio jumped to 3.8x in FY26 from 1.2x in FY25. The RHP attributes this primarily to a significant reduction in current liabilities following conversion of optionally convertible preference shares and balance-sheet restructuring
Debt/Equity declined from 0.3x to 0.0x. Derived interest coverage improved from 6.6x to 256.3x as finance cost collapsed
ROA improved from ~10.0% in FY24 to ~22.4% in FY26 as PAT growth more than offset the enlarged average asset base
Industry Overview
Industry Drivers
Industry Tailwind: Formal bullion market growth and sustained gold demand
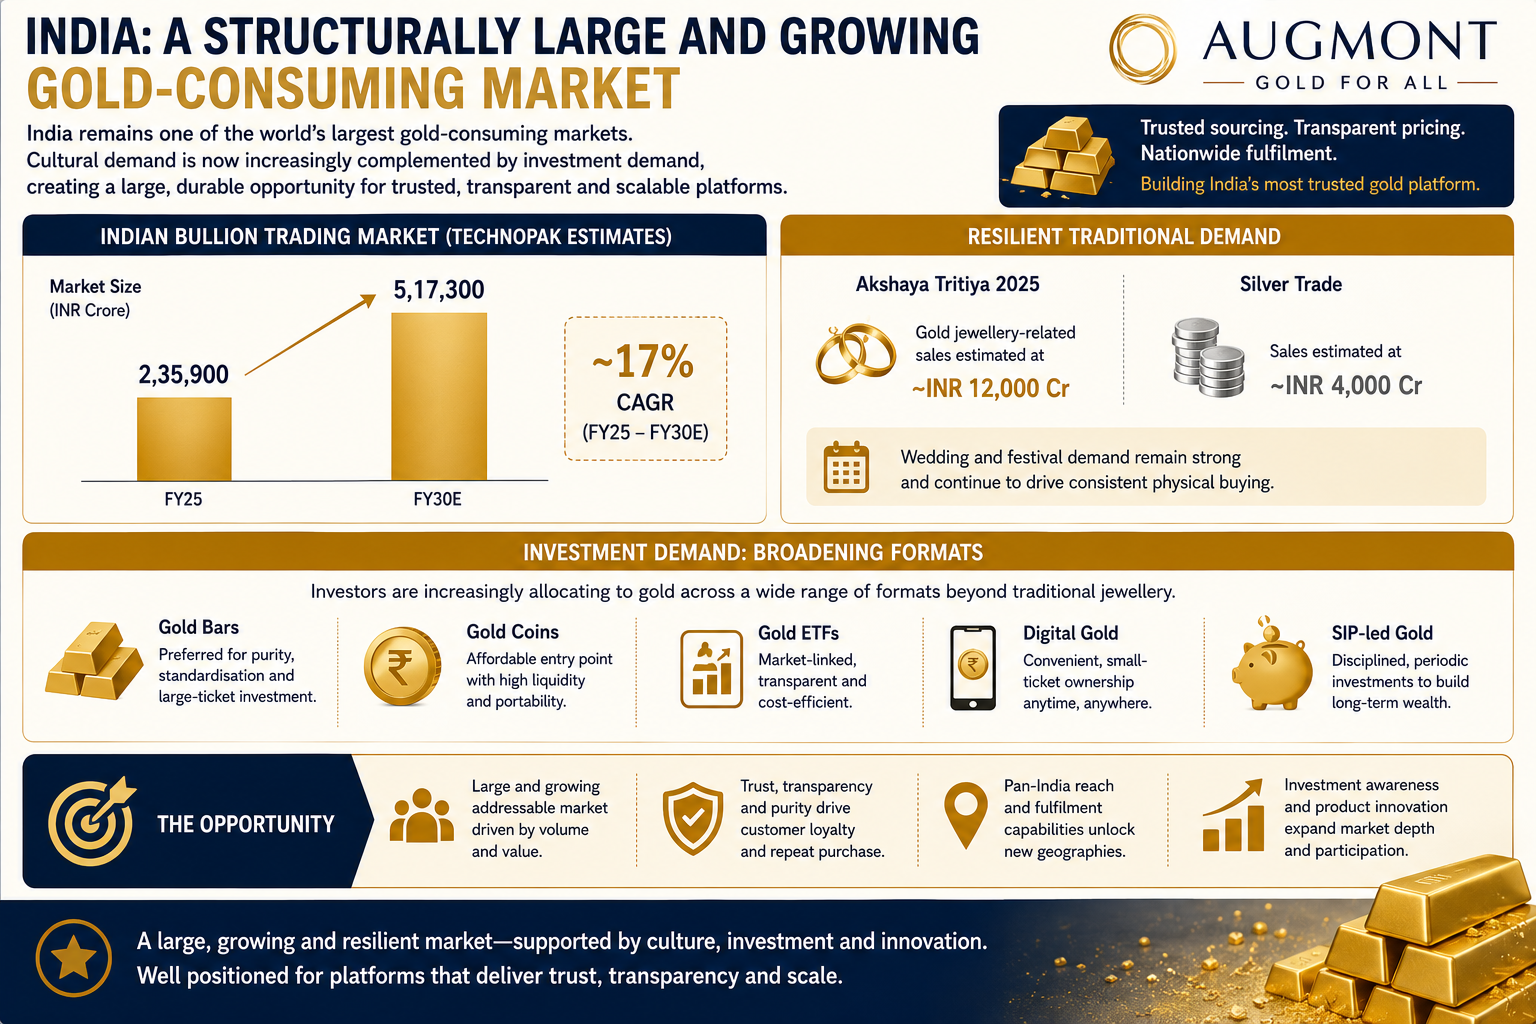
India remains structurally one of the world’s largest gold-consuming markets, with cultural demand now increasingly complemented by investment demand. Technopak estimates the Indian bullion trading market at approximately INR 2,35,900 Cr in FY25 and projects it to reach about INR 5,17,300 Cr by FY30, implying ~17% CAGR. This creates a large volume-led opportunity for platforms that can combine trusted sourcing, transparent pricing and nationwide fulfilment.
The key tailwinds are:
Bullion trading market: ~INR 2,35,900 Cr in FY25 to ~INR 5,17,300 Cr by FY30E; ~17% CAGR
Wedding/festival demand remains resilient; Akshaya Tritiya 2025 gold jewellery-related sales were estimated at ~INR 12,000 Cr, with silver trade at ~INR 4,000 Cr
Investment formats are broadening from jewellery into bars, coins, ETFs, digital gold and SIP-led products
Digitalisation, price transparency and formal electronic execution
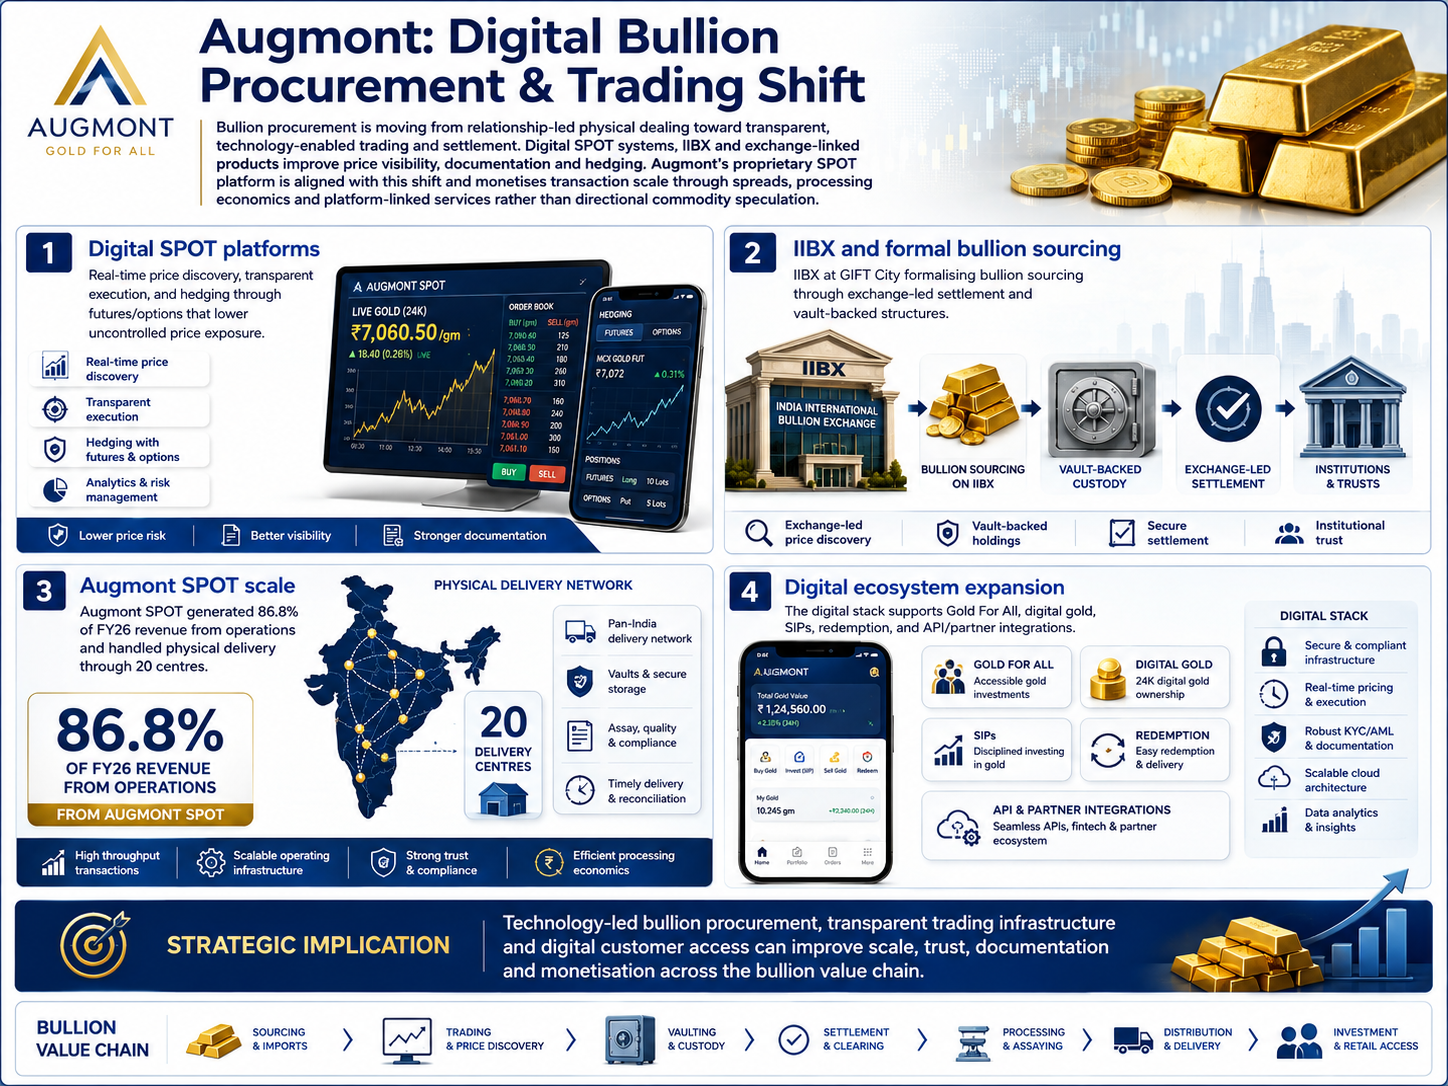
Bullion procurement is moving from relationship-led physical dealing toward transparent, technology-enabled trading and settlement. Digital SPOT systems, IIBX and exchange-linked products improve price visibility, documentation and hedging. Augmont’s proprietary SPOT platform is directly aligned with this shift and monetises transaction scale through spreads, processing economics and platform-linked services rather than directional commodity speculation.
The key drivers are:
Digital SPOT platforms provide real-time price discovery and permit hedging through futures/options, lowering uncontrolled price exposure
IIBX at GIFT City is formalising bullion sourcing through exchange-led settlement and vault-backed structures
Augmont SPOT generated 86.8% of FY26 revenue from operations and handled physical delivery through 20 centres
The Company’s digital stack also supports Gold For All, digital gold, SIPs, redemption and API/partner integrations
Organised recycling, domestic refining and lower import dependence
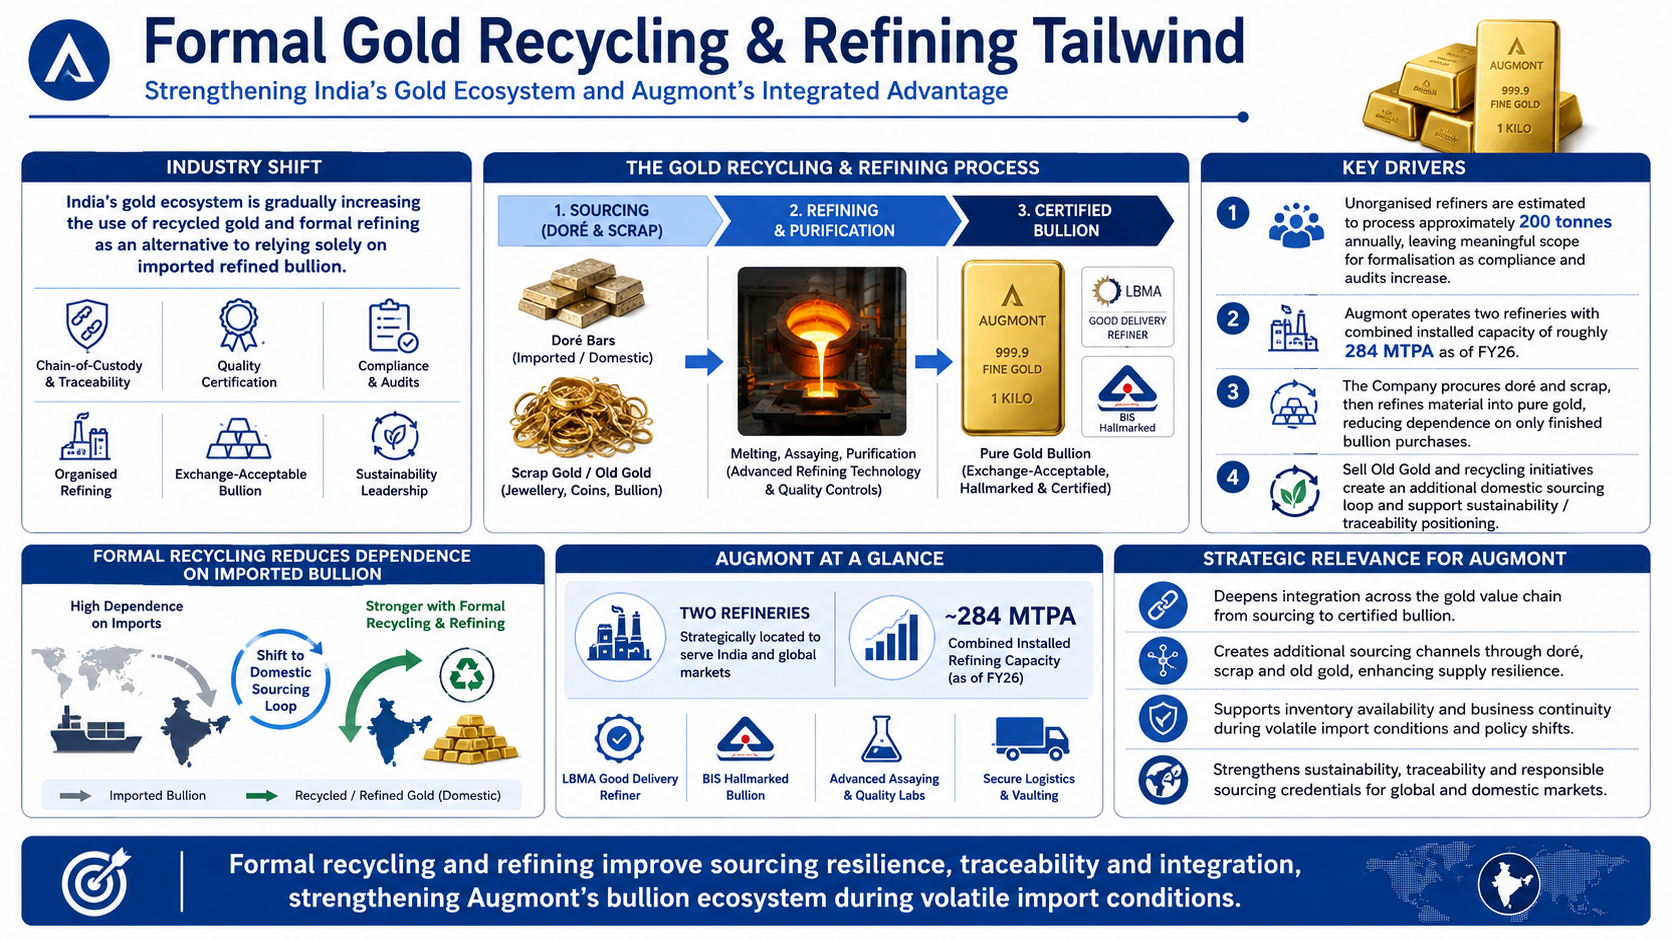
India’s gold ecosystem is gradually increasing the use of recycled gold and formal refining as an alternative to relying solely on imported refined bullion. Organised refiners benefit from chain-of-custody, quality certification and the ability to process doré and scrap into exchange-acceptable bullion. For Augmont, recycling and refining deepen integration, create additional sourcing channels and support inventory availability during volatile import conditions.
Unorganised refiners are estimated to process ~200 tonnes annually, leaving meaningful scope for formalisation as compliance and audits increase
Augmont operates two refineries with combined installed capacity of roughly 284 MTPA as of FY26
The Company procures doré and scrap, then refines material into pure gold, reducing dependence on only finished bullion purchases
Sell Old Gold and recycling initiatives create an additional domestic sourcing loop and support sustainability/traceability positioning
Risks in the Industry
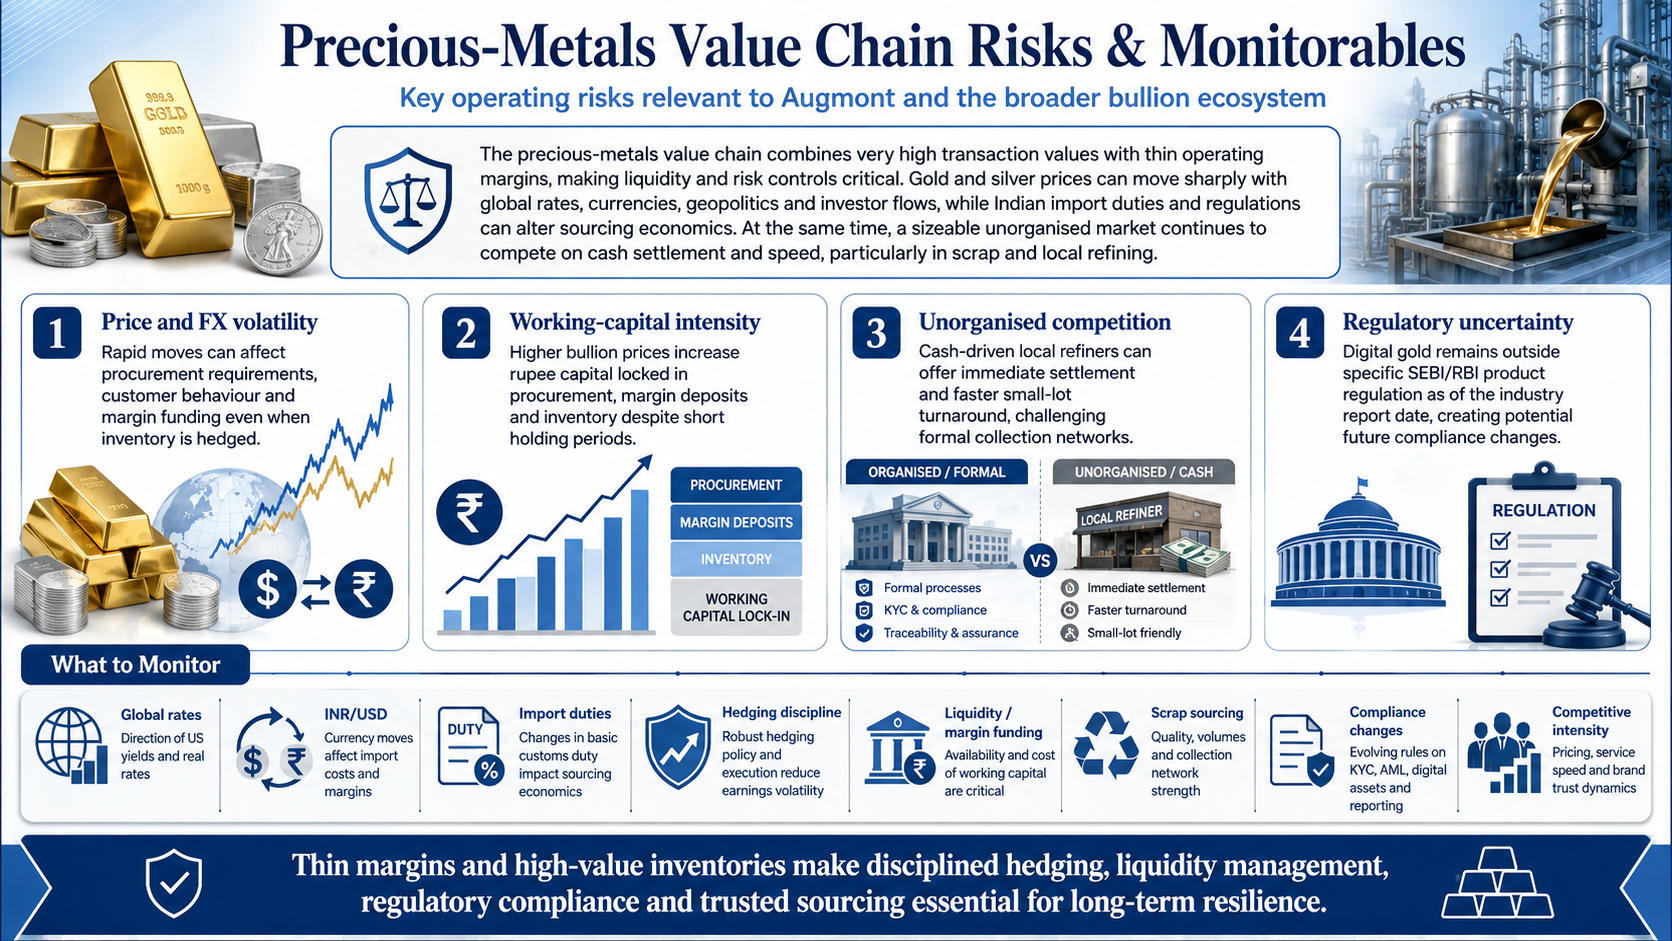
The precious-metals value chain combines very high transaction values with thin operating margins, making liquidity and risk controls critical. Gold and silver prices can move sharply with global rates, currencies, geopolitics and investor flows, while Indian import duties and regulations can alter sourcing economics. At the same time, a sizeable unorganised market continues to compete on cash settlement and speed, particularly in scrap and local refining.
The key risks are:
Price and FX volatility: Rapid moves can affect procurement requirements, customer behaviour and margin funding even when inventory is hedged
Working-capital intensity: Higher bullion prices increase rupee capital locked in procurement, margin deposits and inventory despite short holding periods
Unorganised competition: Cash-driven local refiners can offer immediate settlement and faster small-lot turnaround, challenging formal collection networks
Regulatory uncertainty: Digital gold remains outside specific SEBI/RBI product regulation as of the industry report date, creating potential future compliance changes
Government Policy Support
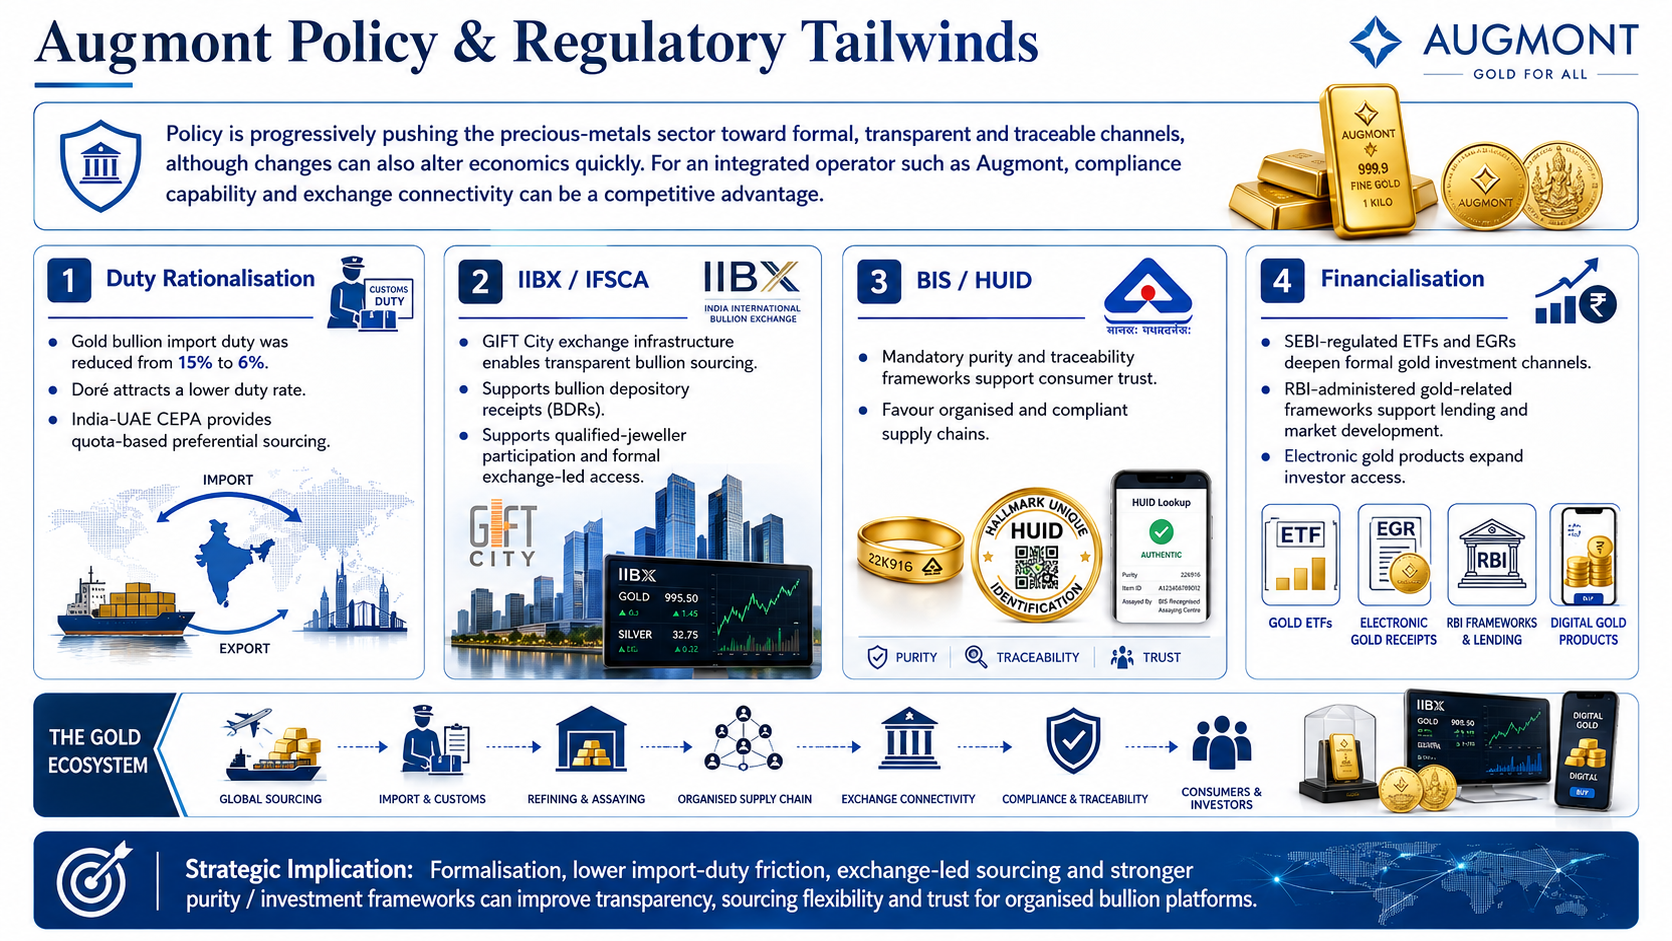
Policy is progressively pushing the sector toward formal, transparent and traceable channels, although changes can also alter economics quickly. Import-duty rationalisation, IIBX at GIFT City, hallmarking, electronic gold products and trade agreements are expanding formal sourcing and investor access. For an integrated operator such as Augmont, compliance capability and exchange connectivity can be a competitive advantage.
The key policies are:
Duty rationalisation: Gold bullion import duty was reduced from 15% to 6%, while doré attracts a lower rate; India-UAE CEPA provides quota-based preferential sourcing
IIBX / IFSCA: GIFT City exchange infrastructure enables transparent bullion sourcing, BDRs and qualified-jeweller participation
BIS / HUID: Mandatory purity and traceability frameworks support consumer trust and favour organised supply chains
Financialisation: SEBI-regulated ETFs/EGRs and RBI-administered gold-related frameworks deepen formal gold investment and lending ecosystems
Fundraise/Future Plans
Shareholding
Pre-issue shareholding
Promoter Holding 0.0%
Post-Issue Shareholding
Promoter Holding 0.0%
Category
Pre-Issue%Post-Issue%
Promoters
Mohinidevi Bhawarlal Kothari
20.1%18.3%
Kalawati Prithviraj Kothari
18.1%16.6%
Namita Ketan Kothari
12.0%10.0%
Devkumari Manekchand Kothari
11.2%10.2%
Manakchand Saremal Kothari
10.3%9.4%
Vivek Prithviraj Kothari
8.1%6.4%
Dimple Mukesh Kothari
7.8%6.2%
Dimpal Vivek Kothari
5.2%4.7%
Total Promoter Holding
92.8%81.8%
Additional Shareholders
0.0%0.0%
Total Additional Holding
0.0%0.0%
Total Shareholding
92.8%81.8%
- Overview
- Business
- Financial Highlights
- Industry Overview
- Fundraise/Future Plans
- Documentation
Get the Preqt App and keep in touch around the clock!
 Monitor your investments in real-time.
- Receive tailored deal suggestions.
- Get real-time updates and alerts.
