


Behari Lal Engineering
Rolling Industry ForwardEngineered for Endurance
IPO Summary (PrEqt)
Behari Lal Engineering Limited is an integrated engineering-steel manufacturer with a differentiated mix of alloy-steel products, metal rolls, engineering castings and forging products, supported by two manufacturing facilities in Mandi Gobindgarh. The IPO comprises a fresh issue of up to INR 93.0 Cr and an OFS of 73,20,001 shares, with primary proceeds largely directed toward machinery, process upgrades and rooftop solar. FY26 revenue reached INR 534.0 Cr, while EBITDA margin expanded to 19.0% and PAT margin to 12.1%, aided by a sharp increase in higher-value products. At the cap price of INR 285.0, the issue implies a post-IPO market capitalisation of INR 1,205.6 Cr and a FY26 P/E of 17.2x, below the RHP peer-group low of 18.5x. Key monitorables are working-capital intensity, customer concentration, steel-cycle exposure and timely execution of the proposed capacity and product-mix upgrades.
IPO Review Rating
Above Avg
MainboardEngineering High-Performance Rolls for India’s Core Industrial Sectors
Behari Lal Engineering presents a strong profitability and valuation profile despite moderate top-line growth. The Company has improved EBITDA and PAT margins meaningfully, carries very little leverage, generates positive operating cash flows and earns ROE above 20.0%. Fundamentally, Behari Lal appears stronger on profitability, balance-sheet quality and valuation than on growth. The most important final validation should come from QIB demand and overall subscription, particularly given the large OFS component and modest current grey-market premium.
PARAMETER
WEIGHT
SCORE
KEY FACTORS
Financial Performance
40.0%
4.0/5
Revenue growth is moderate at 9.4% CAGR, but profitability has improved materially, with EBITDA margin reaching 19.0% and PAT margin 12.1%. Leverage is very low at 0.06x, while ROE remains healthy at 23.6%.
Show more
Detailed Analysis
Revenue increased from INR 446.1 Cr in FY24 to INR 534.0 Cr in FY26, representing a CAGR of 9.4%
EBITDA increased from INR 61.0 Cr in FY24 to INR 101.3 Cr in FY26, while EBITDA margin expanded from 13.7% to 19.0%
PAT increased from INR 35.8 Cr in FY24 to INR 64.6 Cr in FY26, while PAT margin expanded from 8.0% to 12.1%
Debt-to-equity declined from 0.21x in FY24 to 0.06x in FY26, indicating very low balance-sheet leverage
ROE increased from 22.8% in FY24 to 23.6% in FY26, remaining consistently above 20%
Operating cash flow remained positive at INR 61.9 Cr in FY25 and INR 27.5 Cr in FY26, although it declined by 55.5% YoY
The top three customers together contributed INR 94.2 Cr, or 17.6% of FY26 revenue, implying single-customer concentration below 17.6%
Industry
15.0%
3.0/5
The underlying market offers moderate 6.5–8.5% growth, supported by steel demand, formalisation and import substitution.
Show more
Detailed Analysis
Indian metal-roll demand is projected to increase from 97–105 KT in FY26 to 132–158 KT in FY31, representing CAGR of 6.5–8.5%
Organised metal-roll players are expected to increase market share from 38–43% in FY26 to 42–47% by FY31, indicating continuing formalisation
The Company operates 2 manufacturing facilities subject to Air, Water and hazardous-waste regulations, including pollution-control consents
Management
15.0%
4.0/5
The promoters bring 29–31+ years of industry experience, Board independence is 50.0%, and RPTs are only around 0.3% of revenue. Governance is broadly sound, with no pledging or major litigation, although promoters are participating in the OFS.
Show more
Detailed Analysis
Chairman Parkash Chand Garg has 31+ years of steel-industry experience, while Rajesh Garg has 29+ years
The Board comprises 10 directors, including 5 independent directors, representing 50.0% independence
No promoter shares are pledged and no criminal or material promoter litigation exists; 2 tax cases involving INR 0.1 Cr remain pending
Valuation
20.0%
4.0/5
Valuation is one of the strongest parts of the issue, with P/E of 17.2x, a 45.1% discount to peers, and EV/EBITDA of 12.1x. However, the issue has a large 69.2% OFS.
Show more
Detailed Analysis
At INR 285.0, the Company is valued at 17.2x FY26 earnings versus peer average of 31.4x, representing a 45.1% discount
Estimated EV/EBITDA is 12.1x versus peer average of approximately 18.3x, making peers about 1.5x the issuer multiple
At INR 285.0, investors are paying approximately 3.6x FY26 NAV of INR 78.4 per share
RoNW improved from 18.5% in FY24 to 21.1% in FY26, with three-year weighted RoNW of 20.9%
Merchant Banker Track Record
10.0%
3.0/5
The selected BRLM sample recorded strong average subscription of 27.6x, but average listing performance was -1.1% and only 40.0% of issues listed positively. The consortium is credible, but its recent listing track record is mixed.
Show more
Detailed Analysis
The five selected IPOs produced an average listing return of approximately -1.1%.
The selected five IPOs recorded average subscription of approximately 27.6x
2 of 5 issues listed positively, resulting in a positive-listing rate of 40.0%
Both BRLMs are established mainboard merchant bankers, but their recent IPO volumes are below leading Tier-1 houses
TOTAL
100%
3.8/5
Weighted Composite Score
Issue Price
₹271.0 to ₹285.0
As of 29 Aug 2026
GMP
₹133.0
As of 29 Aug 2026
Estimated Gain / Loss
+46.7%
Lot Size
52.0 Shares
Grey Market Premium (GMPs) are shared for knowledge purpose only. PrEqt doesn’t promote or execute the trades.
| Issue size | |
|---|---|
| Overall | ₹302.0 Cr |
| Fresh Issue | ₹93.0 Cr |
| Offer for Sale | ₹209.0 Cr |
Minimum Investment
₹14,820.0 / 2,704 shares

Merchant Banker
Emkay Global Financial Services Ltd.; Systematix Corporate Services Limited
IPO Document
RHP / Anchor Document
Offer Start Date
12th Aug 2026
Offer End Date
14th Aug 2026
Valuation
₹1,205.6 Cr
Revenue FY'26
₹534.0 Cr
PAT (FY'26)
₹64.6 Cr
Issue Size
₹302.0 Cr
Face Value
₹ 10.0Offer Price
₹ 285.0Lot Size
52.0 sharesSale Type
Fresh capital cum OFSPAT (FY'26)
₹ 64.6 CrPAT Margin (FY'26)
12.1 %P/E Multiple
17.2xEBITDA (FY'26)
₹ 101.3 CrCAGR Growth 2Y
9.4 %ROE (FY'26)
23.6 %ROCE (FY'26)
27.1 %Price to Book Value
3.6xDebt/Equity
0.1xCompany Website
www.beharilalengineerExplore new deals
Overview
Fund Allocation
Total: ₹0 CrSource:Company DRHP
Timeline
IPO Open Date
To Be Announced
IPO Close Date
To Be Announced
Tentative Allotment
To Be Announced
Initiation of Refunds
To Be Announced
Credit of Shares to Demat
To Be Announced
Tentative Listing Date
To Be Announced
Business
Products
Business Model
Geographical Presence
Sales Channel
Financial Highlights
Income Statement
Revenue growth with EBITDA and PAT margins
| Financial Metric | FY 2024 | FY 2025 | FY 2026 |
|---|---|---|---|
| Revenue (₹ Cr) | 450.0 | 516.3 | 546.5 |
| Growth (%) | -3.6% | 13.9% | 5.1% |
| EBITDA (₹ Cr) | 61.0 | 81.3 | 101.3 |
| EBITDA Margin (%) | 13.7% | 15.7% | 18.5% |
| PAT (₹ Cr) | 35.8 | 53.0 | 64.6 |
| PAT Margin (%) | 8.0% | 10.4% | 12.1% |
OBSERVATIONS & INSIGHTS
FY24 revenue declined 3.6%, then recovered 13.9% in FY25 and 5.1% in FY26. FY26 growth was driven by metal rolls, engineering castings and forging products, partly offset by lower alloy-steel revenue, resulting in a deliberate shift toward higher value categories rather than pure volume expansion
EBITDA increased from INR 61.0 Cr in FY24 to INR 101.3 Cr in FY26 and margin expanded from 13.7% to 19.0%. The key driver was the higher-value product mix, which increased from 44.7% to 57.8% of revenue, alongside earlier upgrades to melting, refining, heat treatment and machining capabilities
PAT increased from INR 35.8 Cr in FY24 to INR 64.6 Cr in FY26, with PAT margin improving from 8.0% to 12.1%. Operating margin expansion and lower finance costs more than offset the slower revenue growth in FY26
FY24-FY26 revenue CAGR was 9.4%, while EBITDA and PAT grew materially faster. This divergence is consistent with the Company’s move toward metal rolls, engineering castings and specialty steel grades that generate higher revenue and margin per tonne
Balance Sheet
| Financial Metric | FY 2024 | FY 2025 | FY 2026 |
|---|---|---|---|
| Net Worth | ₹ 193.7 Cr | ₹ 241.6 Cr | ₹ 306.1 Cr |
| Total Assets | ₹ 262.1 Cr | ₹ 296.0 Cr | ₹ 367.9 Cr |
| Total Borrowing | ₹ 41.2 Cr | ₹ 7.6 Cr | ₹ 17.8 Cr |
| Reserves & Surplus | ₹ 189.1 Cr | ₹ 233.8 Cr | ₹ 267.1 Cr |
OBSERVATIONS & INSIGHTS
Total assets increased from INR 262.1 Cr in FY24 to INR 367.9 Cr in FY26, driven by plant investment and higher working-capital assets. PPE/CWIP/intangibles increased to INR 99.8 Cr while inventory and receivables together reached INR 200.2 Cr
Total equity increased from INR 193.9 Cr in FY24 to INR 306.1 Cr in FY26 through retained earnings and capital restructuring/bonus issuance. The larger equity base has materially strengthened balance-sheet capacity ahead of the IPO-funded expansion
Total borrowings fell materially from FY24 levels, leaving debt/equity at 0.06x in FY26. Current borrowings increased from INR 6.8 Cr in FY25 to INR 17.5 Cr in FY26, but the increase remains small relative to equity and EBITDA
Cash Flow
| Financial Metric | FY 2024 | FY 2025 | FY 2026 |
|---|---|---|---|
CFO in Cr Cash generated from core business operations. | +37.1 Cr | +62 Cr | +27.5 Cr |
CFI in Cr Cash used in / generated from investing activities. | -52.4 Cr | -19.7 Cr | -37.6 Cr |
CFF in Cr Cash from / used in financing activities. | +13.8 Cr | -40.2 Cr | +8.7 Cr |
Working Capital
| Efficiency Metric | FY 2023 | FY 2024 | FY 2025 |
|---|---|---|---|
Debtor Days Average number of days taken to collect customer payments. | - | - | - |
Creditor Days Average time taken to pay suppliers and vendors. | - | - | - |
Inventory Days Average number of days inventory remains unsold. | - | - | - |
CCC (Cash Conversion Cycle) (Debtor Days + Inventory Days - Creditor Days) | - | - | - |
Financial Ratios
Measures the company’s leverage relative to shareholder equity.
OBSERVATIONS & INSIGHTS
D/E reduced sharply from 0.21x in FY24 to 0.03x in FY25 before moving to 0.06x in FY26. The FY26 increase reflects higher short-term bank utilisation, but leverage remains low relative to equity and EBITDA
Current ratio improved from 3.06x in FY24 to 4.28x in FY26 as current assets expanded faster than current liabilities. A large portion of liquidity is held in bank deposits, while inventories and receivables also increased materially
Interest coverage improved to approximately 59.1x in FY26 because EBIT expanded and finance cost stayed low at INR 1.5 Cr. This indicates limited earnings sensitivity to current borrowing costs
ROCE improved from 22.0% in FY24 to 27.1% in FY26, while ROE remained above 23%. The improvement reflects higher operating profitability and lower leverage, although a larger equity base and working-capital build moderated FY26 return expansion
Industry Overview
Industry Drivers
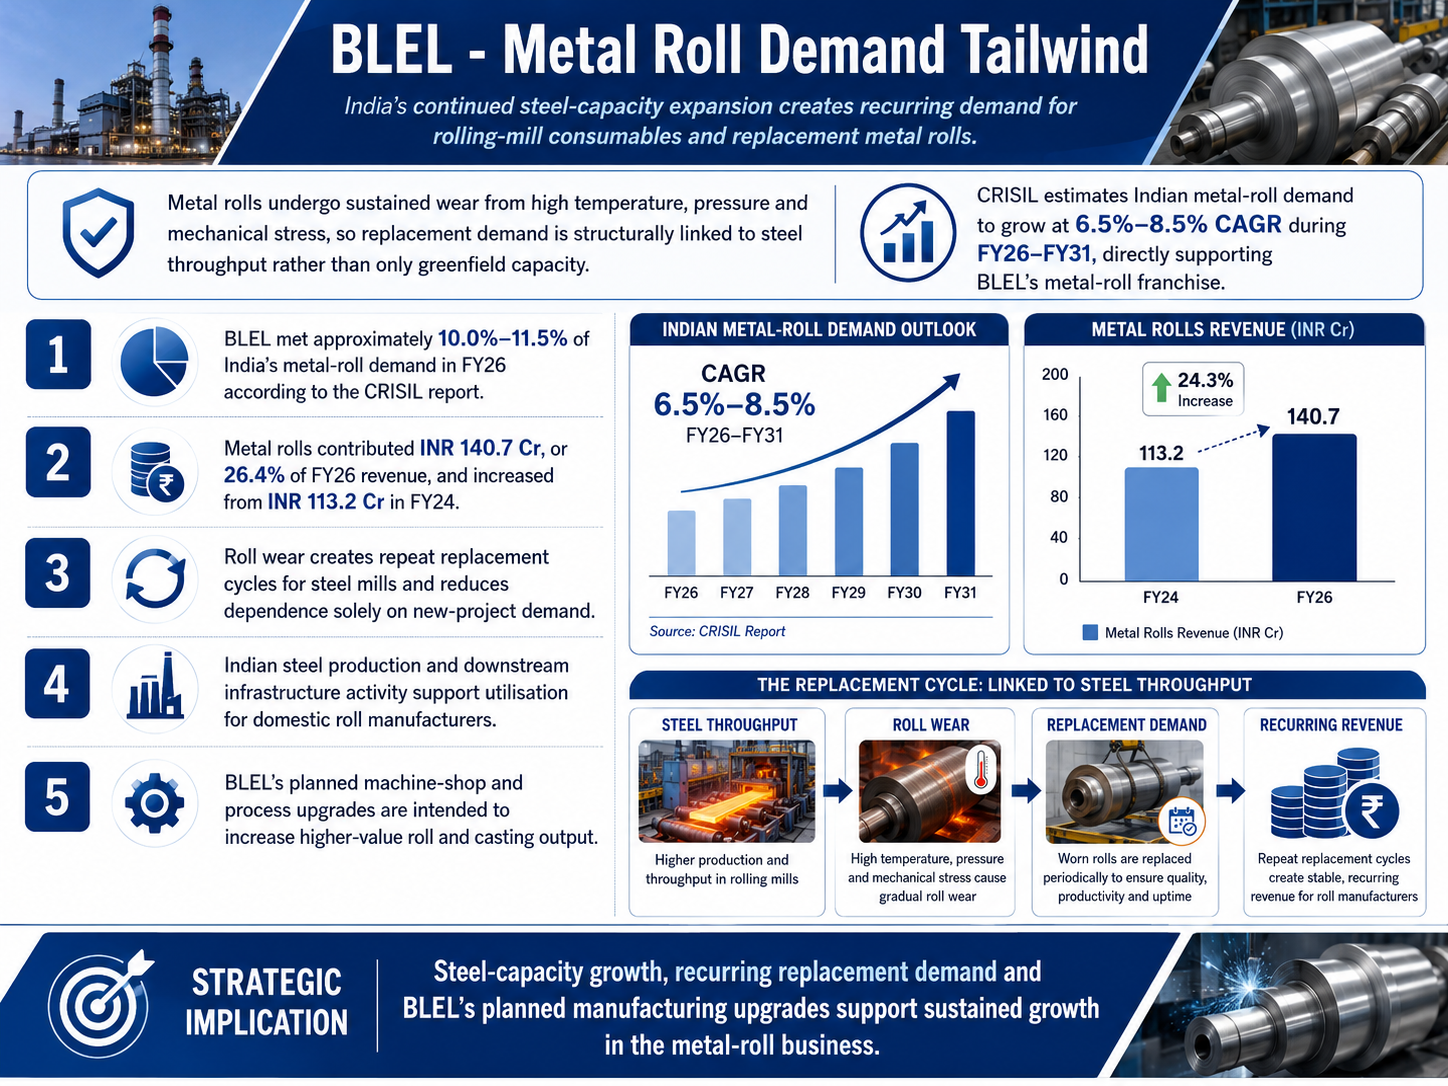
Industry Tailwind: Steel Capacity Growth and Recurring Metal-Roll Replacement
India’s continued steel-capacity expansion creates recurring demand for rolling-mill consumables and replacement metal rolls. Metal rolls undergo sustained wear from high temperature, pressure and mechanical stress, making replacement demand structurally linked to steel throughput rather than only greenfield capacity. CRISIL estimates Indian metal-roll demand to grow at 6.5%-8.5% CAGR during FY26-FY31, directly supporting BLEL’s metal-roll franchise.
The key tailwinds are:
BLEL met approximately 10.0%-11.5% of India’s metal-roll demand in FY26 according to the CRISIL report
Metal rolls contributed INR 140.7 Cr, or 26.4% of FY26 revenue, and increased from INR 113.2 Cr in FY24
Roll wear creates repeat replacement cycles for steel mills and reduces dependence solely on new-project demand
Indian steel production and downstream infrastructure activity support utilisation for domestic roll manufacturers
BLEL’s planned machine-shop and process upgrades are intended to increase higher-value roll and casting output
Rising Demand for High-Value Alloy Steel and Engineering Castings
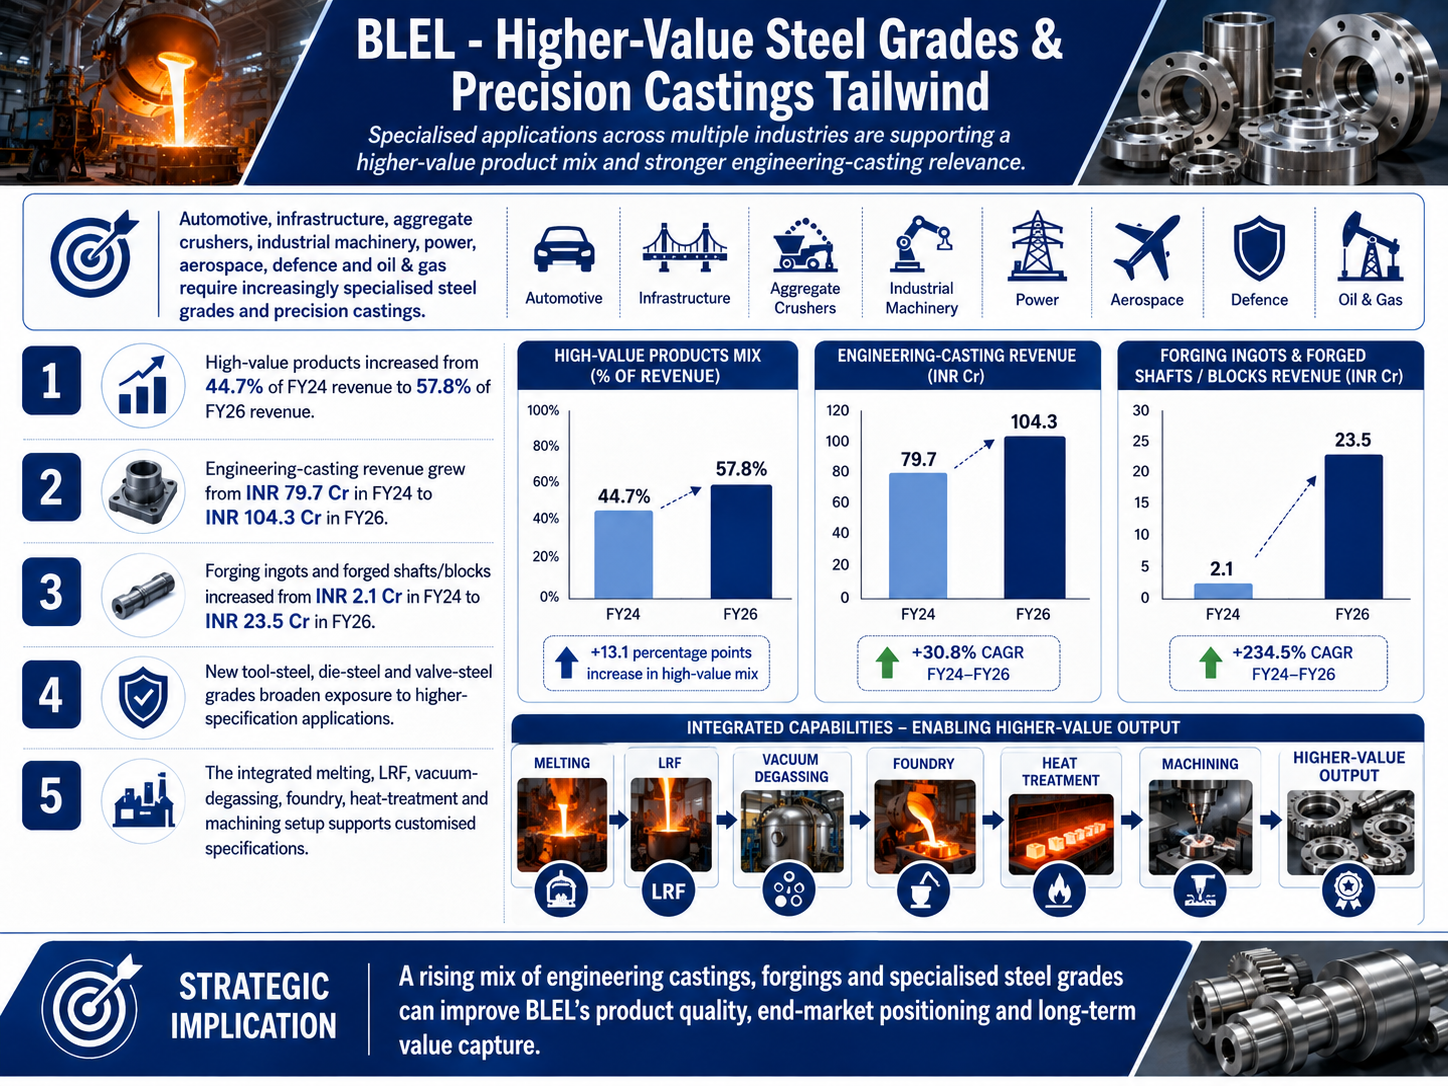
Automotive, infrastructure, aggregate crushers, industrial machinery, power, aerospace, defence and oil & gas require increasingly specialised steel grades and precision castings. Higher-performance applications demand tighter metallurgy, heat treatment, machining and quality control, increasing the value captured by integrated suppliers. BLEL’s product portfolio is already moving toward this higher value mix.
The key details are:
High-value products increased from 44.7% of FY24 revenue to 57.8% of FY26 revenue
Engineering-casting revenue grew from INR 79.7 Cr in FY24 to INR 104.3 Cr in FY26
Forging ingots and forged shafts/blocks increased from INR 2.1 Cr in FY24 to INR 23.5 Cr in FY26
New tool-steel, die-steel and valve-steel grades broaden exposure to higher-specification applications
The integrated melting, LRF, vacuum-degassing, foundry, heat-treatment and machining setup supports customised specifications
Import Substitution and Formalisation toward Organised Suppliers
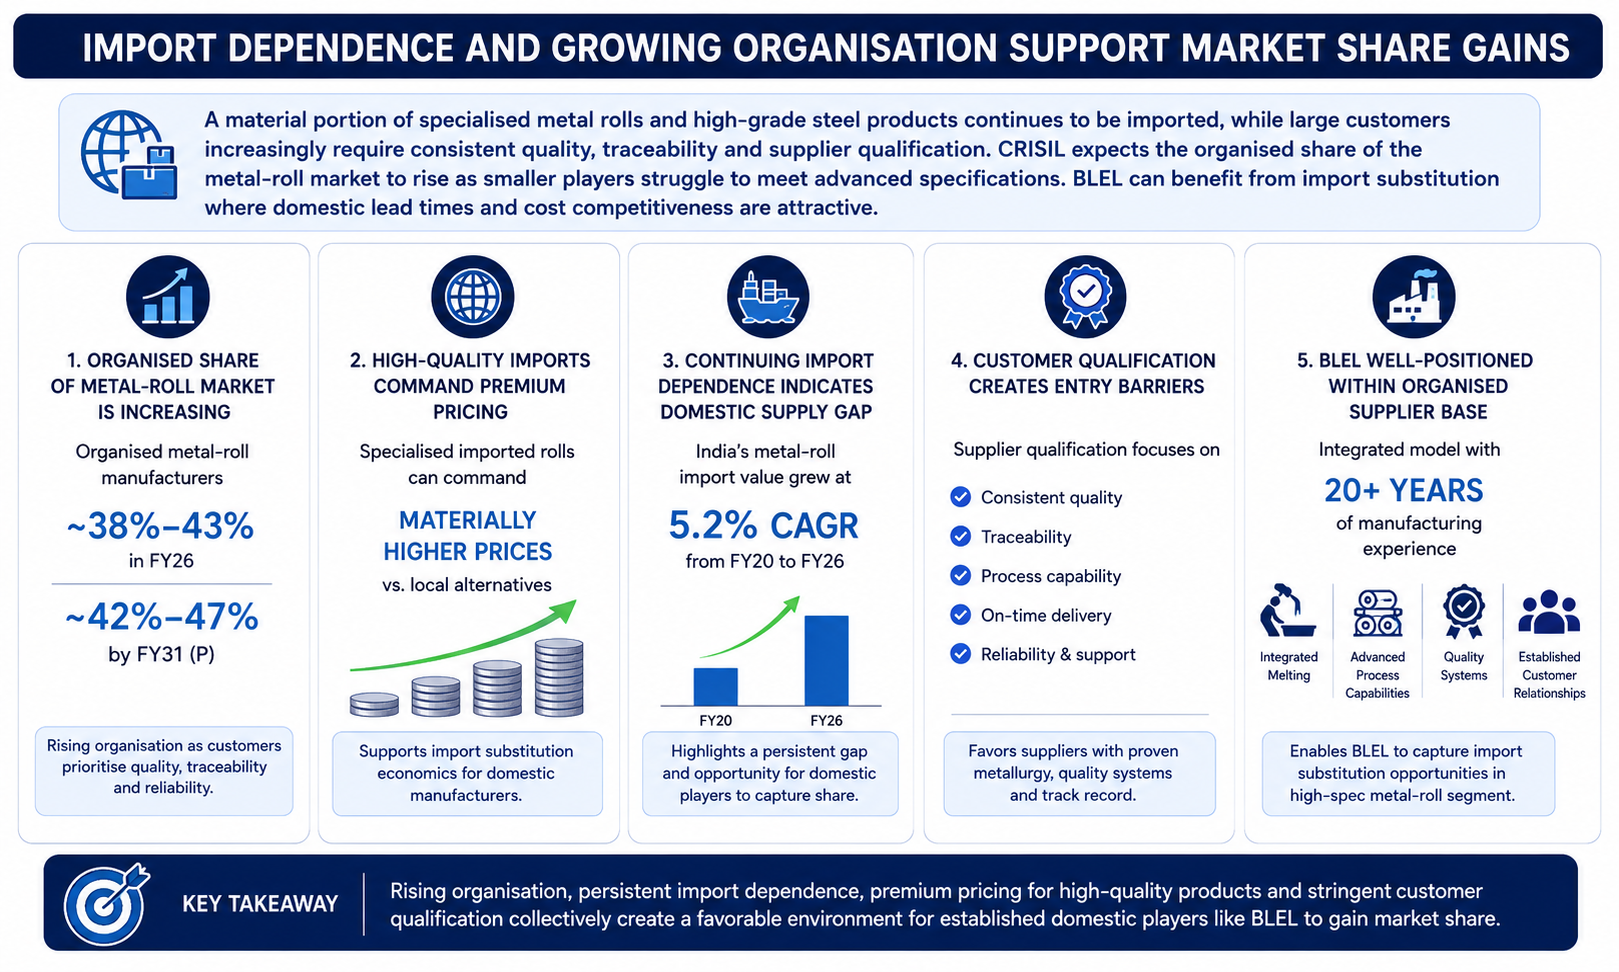
A material portion of specialised metal rolls and high-grade steel products continues to be imported, while large customers increasingly require consistent quality, traceability and supplier qualification. CRISIL expects the organised share of the metal-roll market to rise as smaller players struggle to meet advanced specifications. BLEL can benefit from import substitution where domestic lead times and cost competitiveness are attractive.
The key details are:
CRISIL estimates organised metal-roll manufacturers at roughly 38%-43% of the FY26 market, potentially increasing to 42%-47% by FY31
High-quality specialised imported rolls can command materially higher prices than local alternatives, supporting domestic substitution economics
India’s metal-roll import value increased at 5.2% CAGR from FY20 to FY26, indicating a continuing domestic supply gap
Customer qualification processes can create entry barriers and favour suppliers with proven metallurgy and quality systems
BLEL’s integrated model and over two decades of manufacturing experience position it within the organised supplier base.
Risks in the Industry
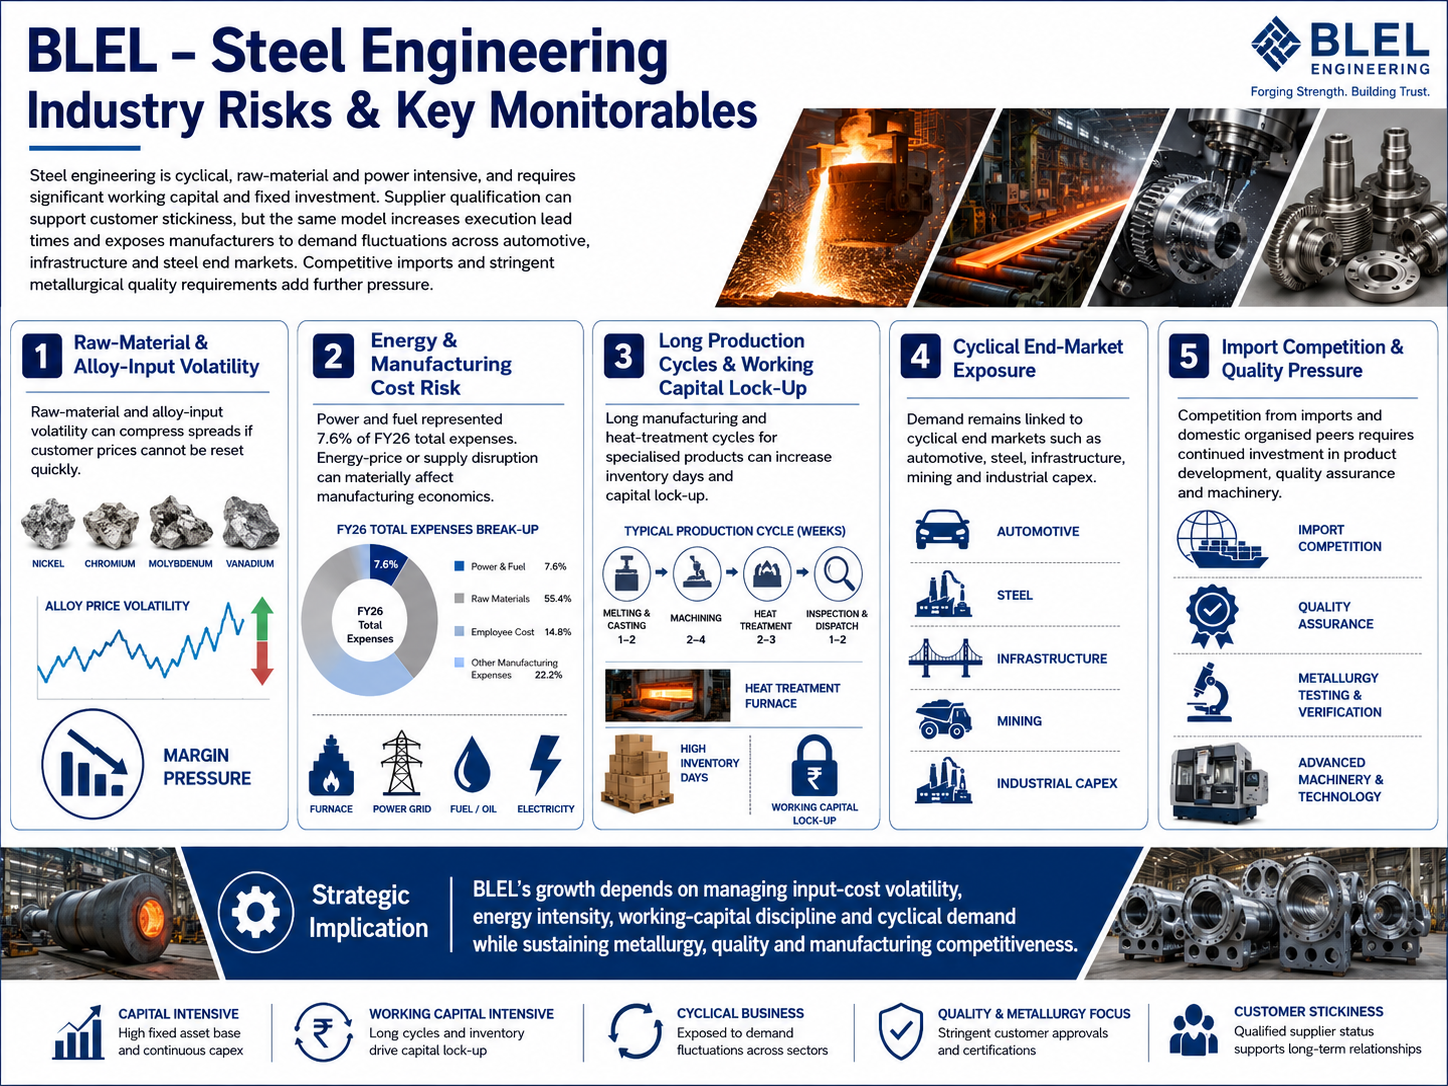
Steel engineering is cyclical, raw-material and power intensive, and requires significant working capital and fixed investment. Supplier qualification can support customer stickiness, but the same model increases execution lead times and exposes manufacturers to demand fluctuations across automotive, infrastructure and steel end markets. Competitive imports and stringent metallurgical quality requirements add further pressure.
The key risks are:
Raw-material and alloy-input volatility can compress spreads if customer prices cannot be reset quickly
Power and fuel represented 7.6% of FY26 total expenses; energy-price or supply disruption can materially affect manufacturing economics
Long manufacturing and heat-treatment cycles for specialised products can increase inventory days and capital lock-up
Demand remains linked to cyclical end markets such as automotive, steel, infrastructure, mining and industrial capex
Competition from imports and domestic organised peers requires continued investment in product development, quality assurance and machinery
Government Policy Support
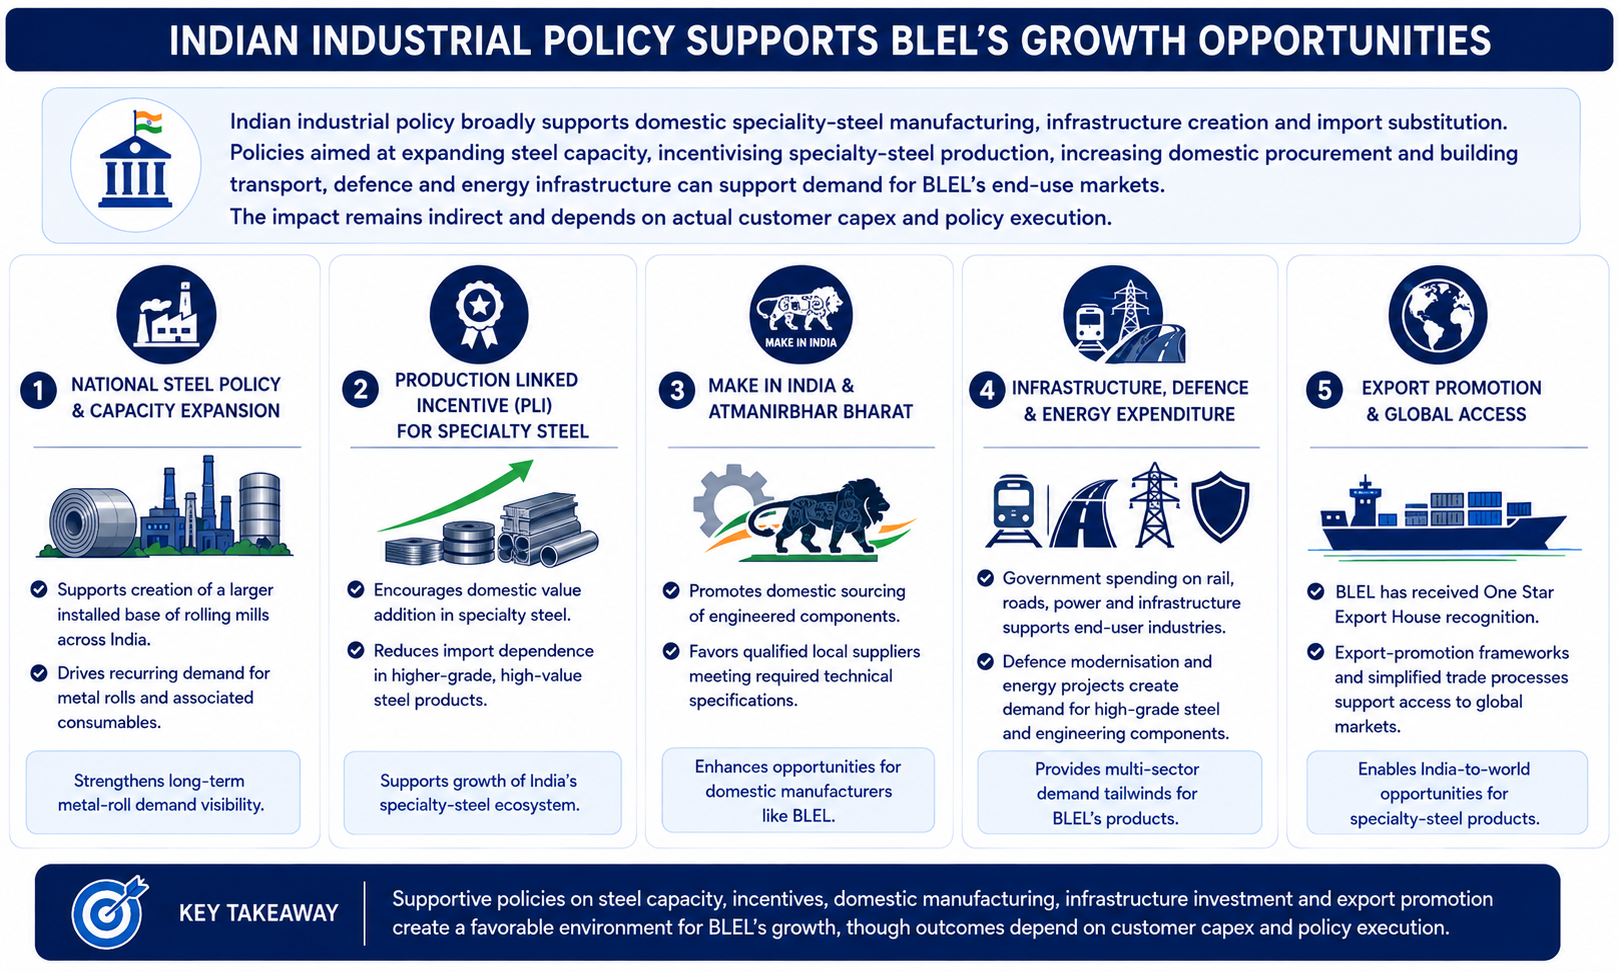
Indian industrial policy broadly supports domestic speciality-steel manufacturing, infrastructure creation and import substitution. Policies aimed at expanding steel capacity, incentivising specialty-steel production, increasing domestic procurement and building transport, defence and energy infrastructure can support demand for BLEL’s end-use markets. The impact remains indirect and depends on actual customer capex and policy execution
The key policies are:
National Steel Policy and domestic steel-capacity expansion support a larger installed base of rolling mills and recurring metal-roll demand
The Production Linked Incentive framework for specialty steel seeks to increase domestic value addition and reduce import dependence in higher-grade products
Make in India and Atmanirbhar Bharat support domestic sourcing of engineered components where local suppliers meet required technical specifications
Government infrastructure, rail, road, power and defence expenditure supports several of BLEL’s end-user industries
The Company has received One Star Export House recognition, while export-promotion frameworks support access to international markets
Fundraise/Future Plans
Shareholding
Pre-issue shareholding
Promoter Holding 0.0%
Post-Issue Shareholding
Promoter Holding 0.0%
Category
Pre-Issue%Post-Issue%
Promoters
Lovlish Garg
14.2%12.2%
Dinesh Garg
10.4%9.6%
Rajesh Garg
10.0%4.6%
Bhuvnesh Garg
5.6%5.2%
Prakash Chand Garg
7.2%6.6%
Anju Garg
9.4%8.7%
Yogita Garg
8.6%2.9%
Kanav Garg
8.1%7.5%
Dinesh Kumar Garg HUF
7.6%6.7%
Rajesh Kumar Garg HUF
5.0%4.6%
Lovlish Garg HUF
1.8%1.6%
Total Promoter Holding
87.9%70.2%
Additional Shareholders
0.0%0.0%
Total Additional Holding
0.0%0.0%
Total Shareholding
87.9%70.2%
- Overview
- Business
- Financial Highlights
- Industry Overview
- Fundraise/Future Plans
- Documentation
Get the Preqt App and keep in touch around the clock!
 Monitor your investments in real-time.
- Receive tailored deal suggestions.
- Get real-time updates and alerts.
