

BLS Polymers
Engineering Polymer PerformanceMaterials for Modern Industry
IPO Summary (PrEqT)
BLS Polymers Limited is an established manufacturer of specialised polymer compounds catering to the power, telecommunications, railway and infrastructure sectors. The company demonstrated improving financial performance, with revenue increasing from INR 328.4 Cr in FY25 to INR 349.4 Cr in FY26, while PAT grew from INR 21.1 Cr to INR 27.0 Cr, supported by a favourable product mix and improved cost efficiency. Operating cash flow strengthened to INR 35.3 Cr in FY26, reflecting better cash generation, although the improvement was partly supported by increased supplier payables. The proposed IPO will primarily fund manufacturing capacity expansion at Goa and incremental working capital requirements. However, declining sales in traditional PE and XLPE products, exposure to raw material price volatility and working capital requirements remain key concerns. At the upper price band of ₹150, the implied post-IPO market capitalisation of INR 930.5 Cr translates into a FY26 P/E of approximately 34.5x.
IPO Review Rating
Average
MainboardBuilding Better Industrial Materials Through Advanced Polymer Compounding Solutions
BLS Polymers presents a strong fundamental IPO profile, supported by significant improvement in profitability and operating efficiency. Revenue increased from INR 296.4 Cr in FY24 to INR 349.4 Cr in FY26, while EBITDA margin expanded from 7.1% to 13.4% and PAT margin improved from 2.5% to 7.7%. ROE remains particularly strong at 33.2%, Debt/Equity has fallen materially to 0.6x, and FY26 operating cash flow exceeded reported PAT. The IPO structure is also favourable because the entire INR 255.0 Cr issue is fresh capital, with proceeds directed toward capacity expansion and working capital rather than providing an exit to existing shareholders. Promoter and promoter-group ownership should remain substantial at approximately 71.5% after the issue.
The main concerns are valuation and customer concentration. At the INR 150 cap price, the company trades at approximately 34.5x post-issue FY26 earnings, versus a listed-peer average of around 24.6x, implying a meaningful premium despite BLS being significantly smaller than Kingfa and Ddev Plastiks.
The top five customers also contributed 53.5% of FY26 revenue, creating dependence on a relatively concentrated customer base. Export contribution remains modest at 5.5%, and no meaningful GMP has developed yet. Overall, strong margins, return ratios, improving leverage, experienced management, favourable industry tailwinds and a 100.0% fresh-issue structure justify participation, but the valuation leaves limited room for execution disappointment
PARAMETER
WEIGHT
SCORE
KEY FACTORS
Financial Performance
40.0%
3.0/5
BLS Polymers has significantly improved profitability, margins, leverage and cash generation while maintaining steady revenue growth. Strong ROE and positive operating cash conversion are major positives, although high customer concentration remains an important financial risk
Show more
Detailed Analysis
Revenue increased from INR 296.4 Cr in FY24 to INR 328.4 Cr in FY25 and INR 349.4 Cr in FY26, representing an FY24-FY26 CAGR of approximately 8.6%. Growth is consistent, although FY26 revenue growth moderated to around 6.4%
EBITDA increased from INR 21.0 Cr in FY24 to INR 38.1 Cr in FY25 and INR 46.9 Cr in FY26. EBITDA margin expanded materially from 7.1% to 11.6% and further to 13.4%, indicating meaningful operating leverage
PAT increased from INR 7.5 Cr in FY24 to INR 21.1 Cr in FY25 and INR 27.0 Cr in FY26. PAT margin consequently improved from 2.5% to 6.4% and 7.7%, demonstrating substantial improvement in profitability
Debt/Equity declined substantially from 2.1x in FY24 to 1.1x in FY25 and 0.6x in FY26. The balance sheet has therefore strengthened considerably, although leverage remains higher than most of its listed polymer-compounding peers
FY26 ROE remained exceptionally strong at 33.2%, compared with 36.8% in FY25 and 17.5% in FY24. The return ratio is materially higher than Kingfa, Ddev Plastiks and Plastiblends for FY26
FY26 operating cash flow increased to approximately INR 35.3 Cr, exceeding PAT of INR 27.0 Cr. Cash generation therefore supports reported earnings, although the business remains working-capital intensive with a 110-day FY26 cycle
Customer concentration remains the major financial-quality concern. The top five customers contributed 53.5% of FY26 revenue, increasing from 50.9% in FY25, creating meaningful dependence on a relatively small group of customers
Industry
15.0%
3.0/5
BLS operates in a structurally growing polymer-compounding market benefiting from power, renewable energy, telecom and pipeline infrastructure spending. Its technical approvals and diversified product portfolio provide barriers to entry, although competition and limited export penetration constrain the score
Show more
Detailed Analysis
India's polymer-compounding market is expected to grow at approximately 9.0% CAGR between 2026 and 2031, reaching around USD 16.5 Bn, supported by infrastructure, automotive, electrical, telecom and manufacturing demand
Polymer compounding is an established manufacturing industry, but higher-value applications in power cables, renewable-energy infrastructure, telecom, fire-resistant cables and pipeline coatings continue to provide structural growth opportunities
Certain products require technical approvals and enlistment with government and PSU customers. These approvals create entry barriers, but lengthy certification processes, product standards and environmental regulations can also delay expansion and customer onboarding
Management
15.0%
4.0/5
BLS has an experienced promoter-management team, 50.0% independent Board representation, no promoter pledging, limited adverse promoter litigation and low related-party sales. The 100.0% fresh issue also preserves substantial promoter ownership and alignment after listing.
Show more
Detailed Analysis
Karan Aggarwal has more than 12 years of polymer-industry experience, while Vinod Aggarwal has over 34 years and Executive Director Dinesh Sharma has over 34 years of sales and marketing experience
The six-member Board comprises three Independent Directors, representing 50.0% Board independence, including one woman Independent Director. The composition provides a strong formal governance structure for a newly listed company
No promoter shares were pledged as disclosed in the DRHP. There were also no outstanding proceedings against the promoters or directors, although the company itself has certain tax and other legal matters
Related-party exposure appears manageable. Sales to related parties represented only 1.0% of FY25 revenue, down from 3.2% in FY24, although the company also has certain promoter-family leases and other routine related-party arrangements
Valuation
20.0%
3.0/5
BLS's valuation is the primary area of caution. Strong RoNW, improving margins and a 100.0% fresh issue support a premium, but post-issue P/E remains materially above the peer average and GMP currently provides no additional comfort
Show more
Detailed Analysis
After considering IPO dilution, BLS is valued at approximately 34.5x FY26 earnings, versus an average of approximately 24.6x for Kingfa, Ddev Plastiks and Plastiblends. The roughly 40.0% premium limits valuation comfort
At the cap price, FY26 EV/EBITDA is approximately 20.9x on the existing balance sheet. This is not inexpensive for an 8.6% revenue CAGR business, although strong margin expansion and planned capacity growth provide some support
The issue price equals approximately 7.1x existing FY26 NAV, which appears expensive. However, because this is a 100.0% fresh issue, illustrative post-issue book value rises materially and reduces P/B to roughly 2.7x
FY26 RoNW of 28.5% is particularly strong and exceeds the disclosed RoNW of all three listed peers, providing meaningful fundamental support for a valuation premium
Merchant Banker Track Record
10.0%
5.0/5
Unistone's disclosed Mainboard aftermarket record is strong, with approximately 88.9% of issues with available 30-day data trading above issue price. However, its institutional distribution franchise remains smaller than that of leading tier-one investment banks
Show more
Detailed Analysis
The DRHP's disclosed Mainboard history shows 8 of 9 IPOs with available 30-day data trading above their issue prices, representing approximately 88.9% positive outcomes
Standardised historical subscription multiples across all previous issues are not disclosed in a sufficiently comparable format for consistent scoring
Unistone has successfully executed multiple Mainboard and SME offerings. Its disclosed Mainboard aftermarket record is particularly favourable, although its franchise is smaller than India's largest investment banks
TOTAL
100%
3.4/5
Weighted Composite Score
Issue Price
₹142.0 to ₹150.0
As of 24 Oct 2026
GMP
₹38.0
As of 24 Oct 2026
Estimated Gain / Loss
+25.3%
Lot Size
100.0 Shares
Grey Market Premium (GMPs) are shared for knowledge purpose only. PrEqt doesn’t promote or execute the trades.
| Issue Size (in Cr) | |
|---|---|
| Overall | ₹255.0 Cr |
| Fresh Issue | ₹255.0 Cr |
| Offer for Sale | ₹0.0 Cr |
Minimum Investment
₹15,000.0 / 100 shares

Merchant Banker
Unicon Capital Services Pvt.Ltd.
Unicon Capital Services Pvt.Ltd.
IPO Document
Offer Start Date
Offer End Date
Valuation
Revenue (FY'26)
PAT (FY'26)
Issue Size (in Cr)
Face Value
₹ 10.0Offer Price
₹ 150.0Lot Size
100.0 sharesSale Type
Fresh capital onlyPAT (FY'26)
₹ 27.0 CrPAT Margin (FY'26)
7.7 %P/E Multiple
34.5xEBITDA (FY'26)
₹ 46.9 CrCAGR Growth 2Y
8.6 %ROE (FY'26)
33.2 %ROCE (FY'26)
29.5 %Price to Book Value
2.7xDebt/Equity
0.6xCompany Website
www.blspolymers.comExplore new deals
Overview
Fund Allocation
Total: ₹0 CrSource:Company DRHP
Timeline
IPO Open Date
To Be Announced
IPO Close Date
To Be Announced
Tentative Allotment
To Be Announced
Initiation of Refunds
To Be Announced
Credit of Shares to Demat
To Be Announced
Tentative Listing Date
To Be Announced
Business
Business Model
Geographical Presence
Sales Channel
Key Risk Factor
Financial Highlights
Income Statement
Revenue growth with EBITDA and PAT margins
| Financial Metric | FY 2024 | FY 2025 | FY 2026 |
|---|---|---|---|
| Revenue (₹ Cr) | 301.5 | 336.7 | 354.4 |
| Growth (%) | - | 11.7% | 5.3% |
| EBITDA (₹ Cr) | 21.6 | 40.0 | 46.9 |
| EBITDA Margin (%) | 7.3% | 12.2% | 13.4% |
| PAT (₹ Cr) | 7.5 | 21.1 | 27.0 |
| PAT Margin (%) | 2.5% | 6.4% | 7.7% |
OBSERVATIONS & INSIGHTS
Revenue rose 10.8% in FY25 from INR 296.4 Cr to INR 328.4 Cr and 6.4% in FY26 to INR 349.4 Cr. Growth was driven chiefly by the broader Other products category, which expanded from INR 42.2 Cr in FY24 to INR 111.2 Cr in FY26, while core PE and XLPE sales contracted over the same period
EBITDA rose from INR 21.6 Cr in FY24 to INR 40.0 Cr in FY25 and INR 46.9 Cr in FY26. The improvement followed higher gross profit and better operating leverage, despite increases in employee and other expenses in FY26. EBITDA margin improved from 7.3% in FY24 to 12.2% in FY25 and 13.4% in FY26. The principal explanation is increased gross profitability relative to sales. FY26 employee costs rose from INR 7.1 Cr to INR 8.5 Cr and other expenses from INR 24.0 Cr to INR 26.0 Cr, partly offsetting the stronger gross spread
PAT increased from INR 7.5 Cr in FY24 to INR 21.1 Cr in FY25 and INR 27.0 Cr in FY26. FY25 benefited from higher operating earnings and increased other income; FY26 rose despite other income decreasing from INR 8.3 Cr to INR 5.0 Cr, owing to higher product operating profitability and lower finance and depreciation charges. PAT margin rose from 2.5% in FY24 to 6.4% in FY25 and 7.7% in FY26. Improved cost recovery and reduced financing burden relative to revenue supported the increase. FY26 tax expense grew as pretax profit rose; this moderated, rather than explained, the net profit improvement
Balance Sheet
| Financial Metric | FY 2024 | FY 2025 | FY 2026 |
|---|---|---|---|
| Net Worth | ₹ 46.8 Cr | ₹ 67.9 Cr | ₹ 94.9 Cr |
| Total Assets | ₹ 168.5 Cr | ₹ 179.1 Cr | ₹ 206.1 Cr |
| Total Borrowing | ₹ 93.8 Cr | ₹ 73.9 Cr | ₹ 51.7 Cr |
| Reserves & Surplus | ₹ 37.2 Cr | ₹ 58.3 Cr | ₹ 49.9 Cr |
OBSERVATIONS & INSIGHTS
Assets grew from INR 168.5 Cr in FY24 to INR 179.1 Cr in FY25 and INR 206.1 Cr in FY26. The FY25 increase primarily reflected higher receivables and other financial assets; FY26 expansion was driven mainly by a INR 18.0 Cr inventory increase, further receivable-related current assets and capital expenditure
Shareholders' equity increased from INR 46.8 Cr in FY24 to INR 67.9 Cr in FY25 and INR 94.9 Cr in FY26, reflecting profit retention. FY26 also included a bonus-share issue that transferred part of other equity into paid-up share capital. The bonus did not itself create new net worth
The FY26 share-capital increase from INR 9.6 Cr to INR 45.0 Cr was predominantly a capitalisation within equity, offsetting the reduction in other equity from INR 58.3 Cr to INR 49.9 Cr. The economic increase in total equity resulted from retained profits, not the accounting transfer itself
Total borrowings excluding leases fell from INR 93.8 Cr in FY24 to INR 73.9 Cr in FY25 and INR 51.7 Cr in FY26, mainly through a reduction in short-term facilities. Lower borrowing partly explains declining finance costs, while customer advances and trade creditors require separate cash-flow scrutiny
Cash Flow
| Financial Metric | FY 2024 | FY 2025 | FY 2026 |
|---|---|---|---|
CFO (₹ Cr) Cash generated from core business operations. | +2.7 Cr | +24.9 Cr | +35.3 Cr |
CFI (₹ Cr) Cash used for investments and long-term assets. | -0.8 Cr | +0.9 Cr | -3.6 Cr |
CFF (₹ Cr) Cash flow related to funding and borrowings. | -2.2 Cr | -25.7 Cr | -31.0 Cr |
Working Capital
| Efficiency Metric | FY 2023 | FY 2024 | FY 2025 |
|---|---|---|---|
Debtor Days Average number of days taken to collect customer payments. | - | - | - |
Creditor Days Average time taken to pay suppliers and vendors. | - | - | - |
Inventory Days Average number of days inventory remains unsold. | - | - | - |
CCC (Cash Conversion Cycle) (Debtor Days + Inventory Days - Creditor Days) | - | - | - |
Financial Ratios
Measures the company’s leverage relative to shareholder equity.
OBSERVATIONS & INSIGHTS
ROE increased from 17.5% in FY24 to 36.8% in FY25 because PAT grew much faster than the average equity base. It moderated to 33.2% in FY26 despite higher PAT, mainly because shareholders' equity expanded from INR 67.9 Cr to INR 94.9 Cr, enlarging the equity denominator
ROCE improved from 13.7% in FY24 to 25.5% in FY25 and 29.9% in FY26 as operating earnings grew and financing obligations reduced. The September 2026 industry report uses average capital employed; the older DRHP reports slightly different ROCE figures based on a different definition
Debt to equity fell from 2.0x in FY24 to 1.1x in FY25 and 0.6x in FY26, as current borrowings decreased and retained earnings lifted total equity. In FY26, the ratio improved further because financial borrowing balances fell from INR 73.9 Cr to INR 51.7 Cr
The current ratio rose from 1.3x in FY24 to 1.4x in FY25 and 1.7x in FY26. FY25 current liabilities declined following lower bank borrowing; FY26 liquidity improved further because short-term debt fell despite growth in inventory and trade payables. A substantial portion of current assets remains tied up in inventory and receivables
Return on total assets rose from 4.5% in FY24 to 11.8% in FY25 and 13.1% in FY26 because PAT expanded faster than total asset balances. It is based on PAT divided by year-end total assets, as defined in the CRISIL peer benchmarks, rather than average assets
Interest coverage improved from 2.1x in FY24 to 4.3x in FY25 and further to 5.5x in FY26. This improvement was primarily driven by higher profitability, with PBT increasing from INR 9.7 Cr in FY24 to INR 36.0 Cr in FY26, alongside a reduction in finance costs from INR 9.2 Cr to INR 8.0 Cr. The improvement indicates a stronger capacity to service interest obligations
Industry Overview
Industry Drivers
Electricity Infrastructure and Renewable Energy Cable Demand
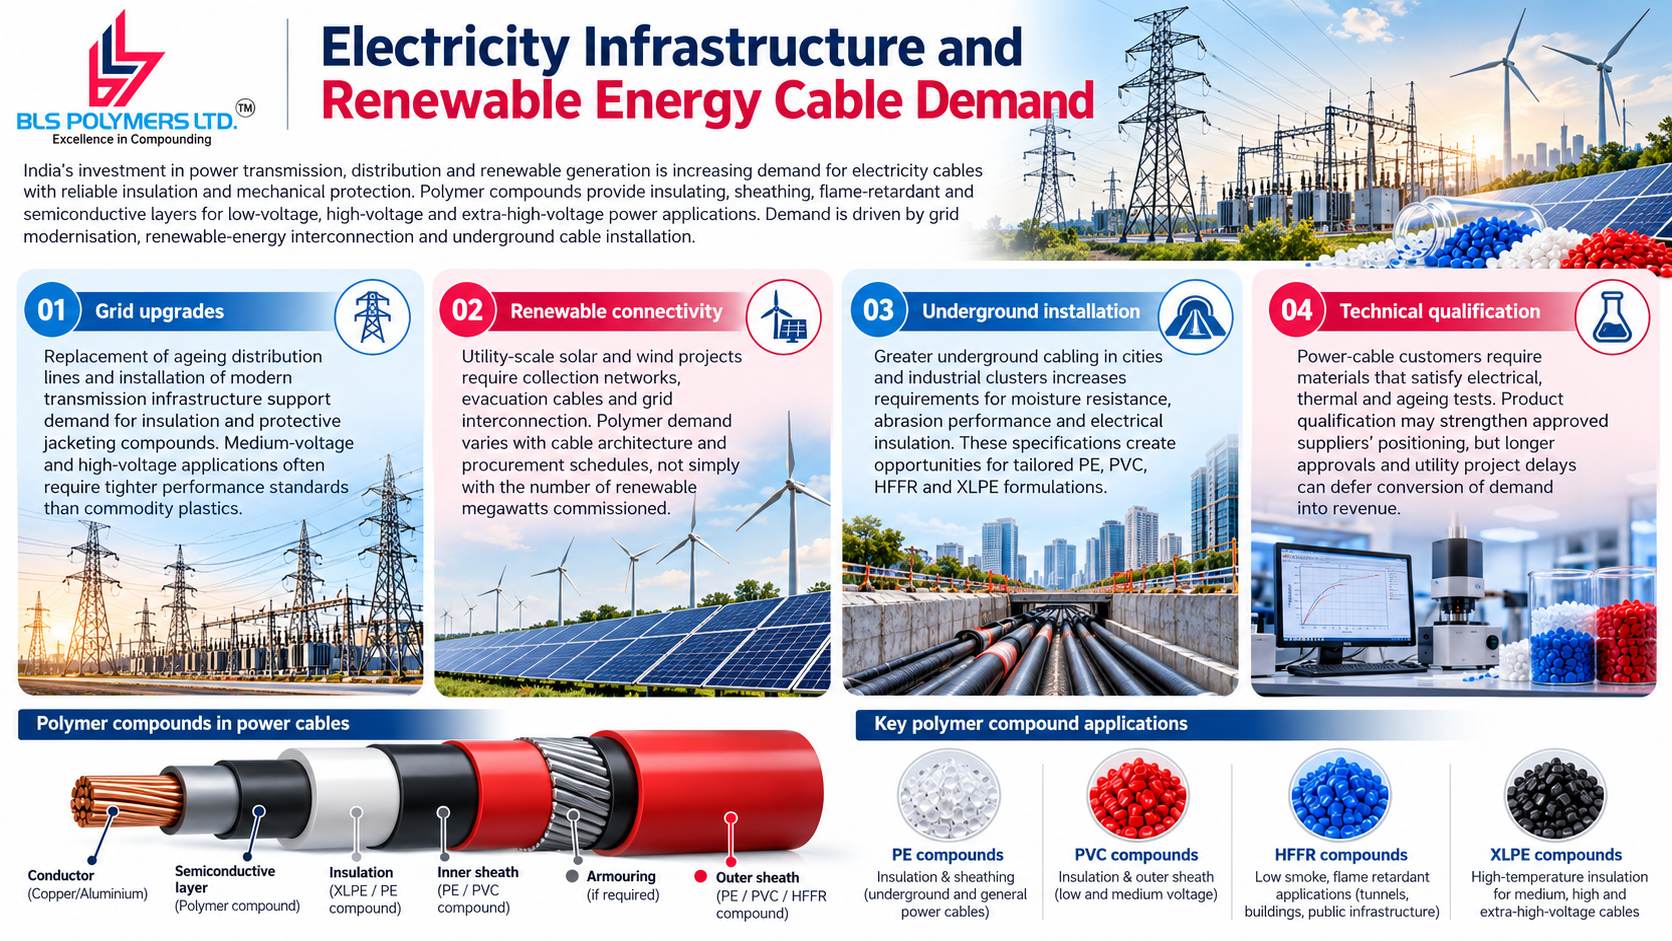
India's investment in power transmission, distribution and renewable generation is increasing the need for electricity cables with reliable insulation and mechanical protection. Polymer compounds provide the insulating, sheathing, flame retardant and semiconductive layers required for low-voltage, high-voltage and extra-high-voltage power applications. The CRISIL industry study identifies grid modernisation, renewable-energy interconnection and underground cable installation among the principal cable-industry trends. Compounding demand therefore follows not only electrical capacity additions but also cable length, safety specifications and the material intensity of individual transmission and distribution projects.
The key drivers are:
Grid upgrades: Replacement of ageing distribution lines and installation of modern transmission infrastructure support demand for insulation and protective jacketing compounds. Medium-voltage and high-voltage applications often require tighter performance standards than commodity plastics
Renewable connectivity: Utility-scale solar and wind projects require collection networks, evacuation cables and grid interconnection. Polymer demand varies with cable architecture and procurement schedules, not simply with the number of renewable megawatts commissioned
Underground installation: Greater underground cabling in cities and industrial clusters increases requirements for moisture resistance, abrasion performance and electrical insulation. These specifications create opportunities for tailored PE, PVC, HFFR and XLPE formulations
Technical qualification: Power cable customers require materials that satisfy electrical, thermal and ageing tests. Product qualification may strengthen approved suppliers' positioning, but longer approvals and utility project delays can defer conversion of demand into revenue
Telecom Fibre Networks and Digital Infrastructure
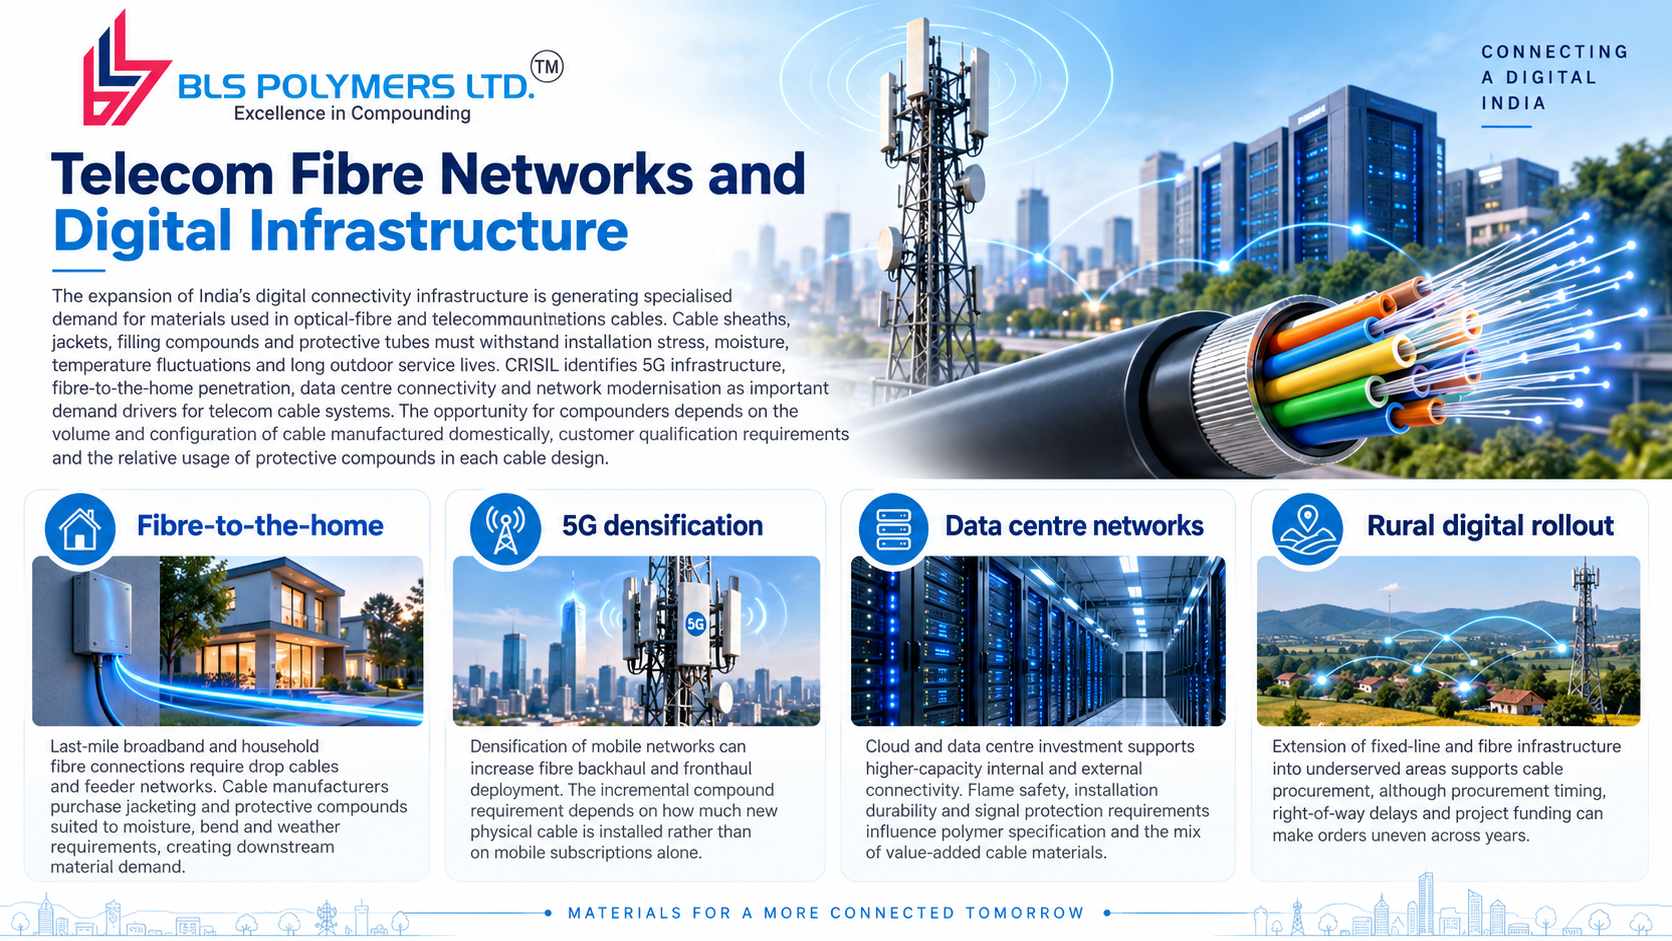
The expansion of India's digital connectivity infrastructure is generating specialised demand for materials used in optical-fibre and telecommunications cables. Cable sheaths, jackets, filling compounds and protective tubes must withstand installation stress, moisture, temperature fluctuations and long outdoor service lives. CRISIL identifies 5G infrastructure, fibre-to-the-home penetration, data centre connectivity and network modernisation as important demand drivers for telecom cable systems. The opportunity for compounders depends on the volume and configuration of cable manufactured domestically, customer qualification requirements and the relative usage of protective compounds in each cable design.
The key drivers are:
Fibre-to-the-home: Last-mile broadband and household fibre connections require drop cables and feeder networks. Cable manufacturers purchase jacketing and protective compounds suited to moisture, bend and weather requirements, creating downstream material demand
5G densification: Densification of mobile networks can increase fibre backhaul and fronthaul deployment. The incremental compound requirement depends on how much new physical cable is installed rather than on mobile subscriptions alone
Data centre networks: Cloud and data centre investment supports higher-capacity internal and external connectivity. Flame safety, installation durability and signal protection requirements influence polymer specification and the mix of value-added cable materials
Rural digital rollout: Extension of fixed-line and fibre infrastructure into underserved areas supports cable procurement, although procurement timing, right-of-way delays and project funding can make orders uneven across years
Pipeline Protection and Higher-Performance Polymer Formulations
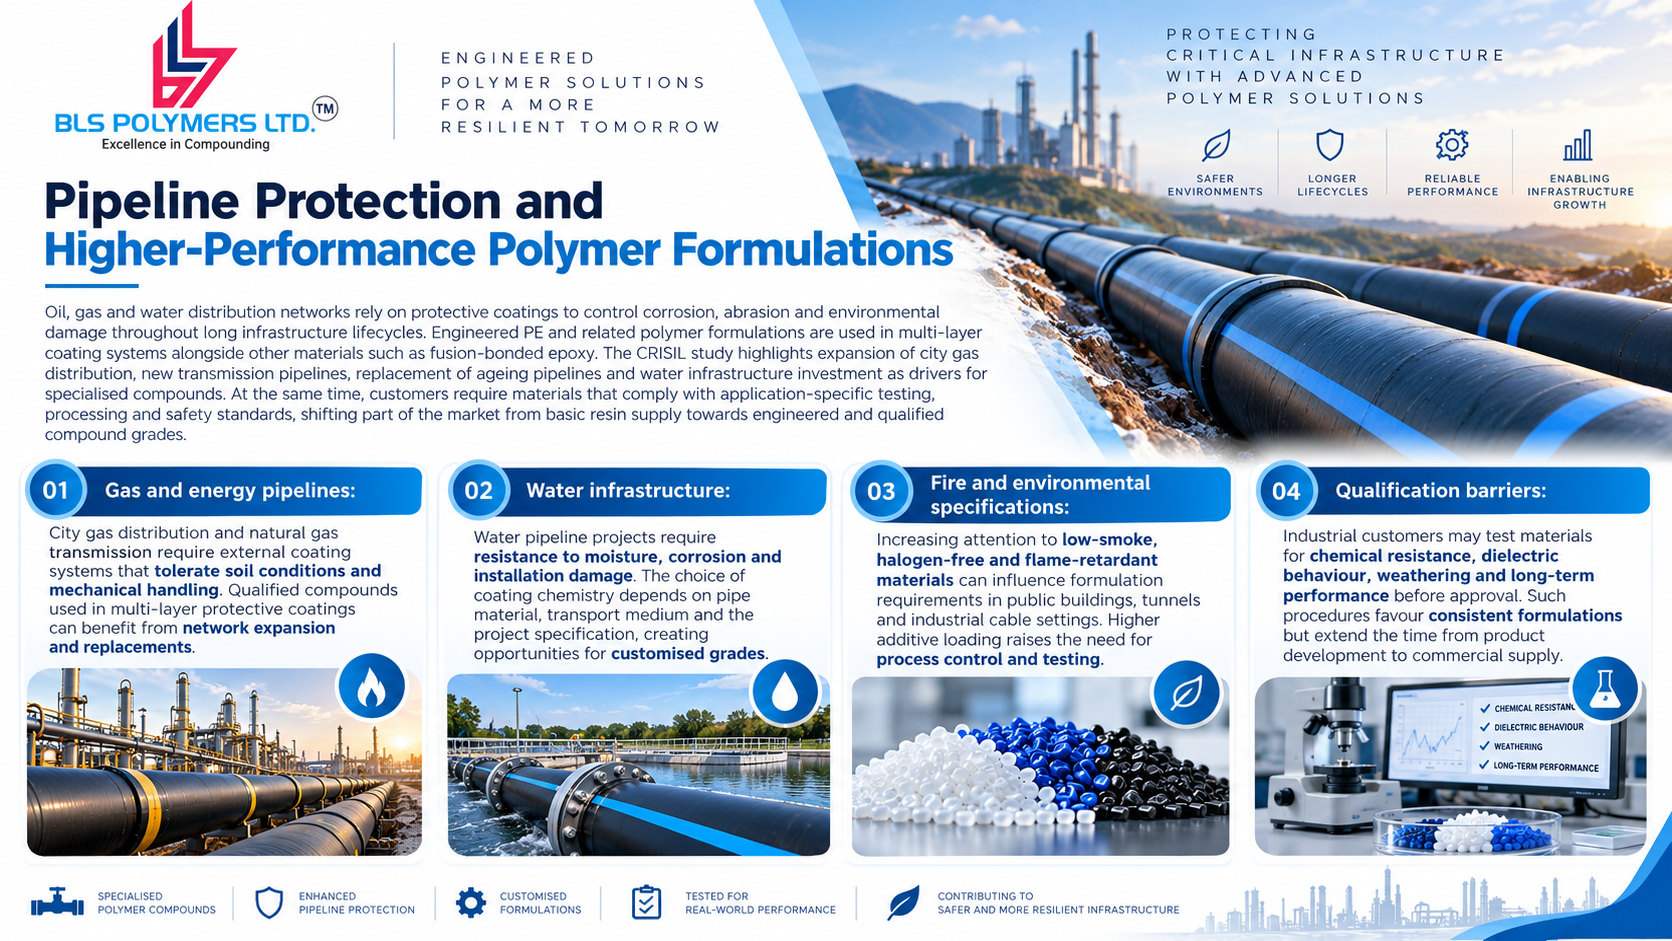
Oil, gas and water distribution networks rely on protective coatings to control corrosion, abrasion and environmental damage throughout long infrastructure lifecycles. Engineered PE and related polymer formulations are used in multi-layer coating systems alongside other materials such as fusion-bonded epoxy. The CRISIL study highlights expansion of city gas distribution, new transmission pipelines, replacement of ageing pipelines and water infrastructure investment as drivers for specialised compounds. At the same time, customers require materials that comply with application-specific testing, processing and safety standards, shifting part of the market from basic resin supply towards engineered and qualified compound grades.
The key points are:
Gas and energy pipelines: City gas distribution and natural gas transmission require external coating systems that tolerate soil conditions and mechanical handling. Qualified compounds used in multi-layer protective coatings can benefit from network expansion and replacements
Water infrastructure: Water pipeline projects require resistance to moisture, corrosion and installation damage. The choice of coating chemistry depends on pipe material, transport medium and the project specification, creating opportunities for customised grades
Fire and environmental specifications: Increasing attention to low-smoke, halogen-free and flame-retardant materials can influence formulation requirements in public buildings, tunnels and industrial cable settings. Higher additive loading raises the need for process control and testing
Qualification barriers: Industrial customers may test materials for chemical resistance, dielectric behaviour, weathering and long-term performance before approval. Such procedures favour consistent formulations but extend the time from product development to commercial supply
Risks in the Industry
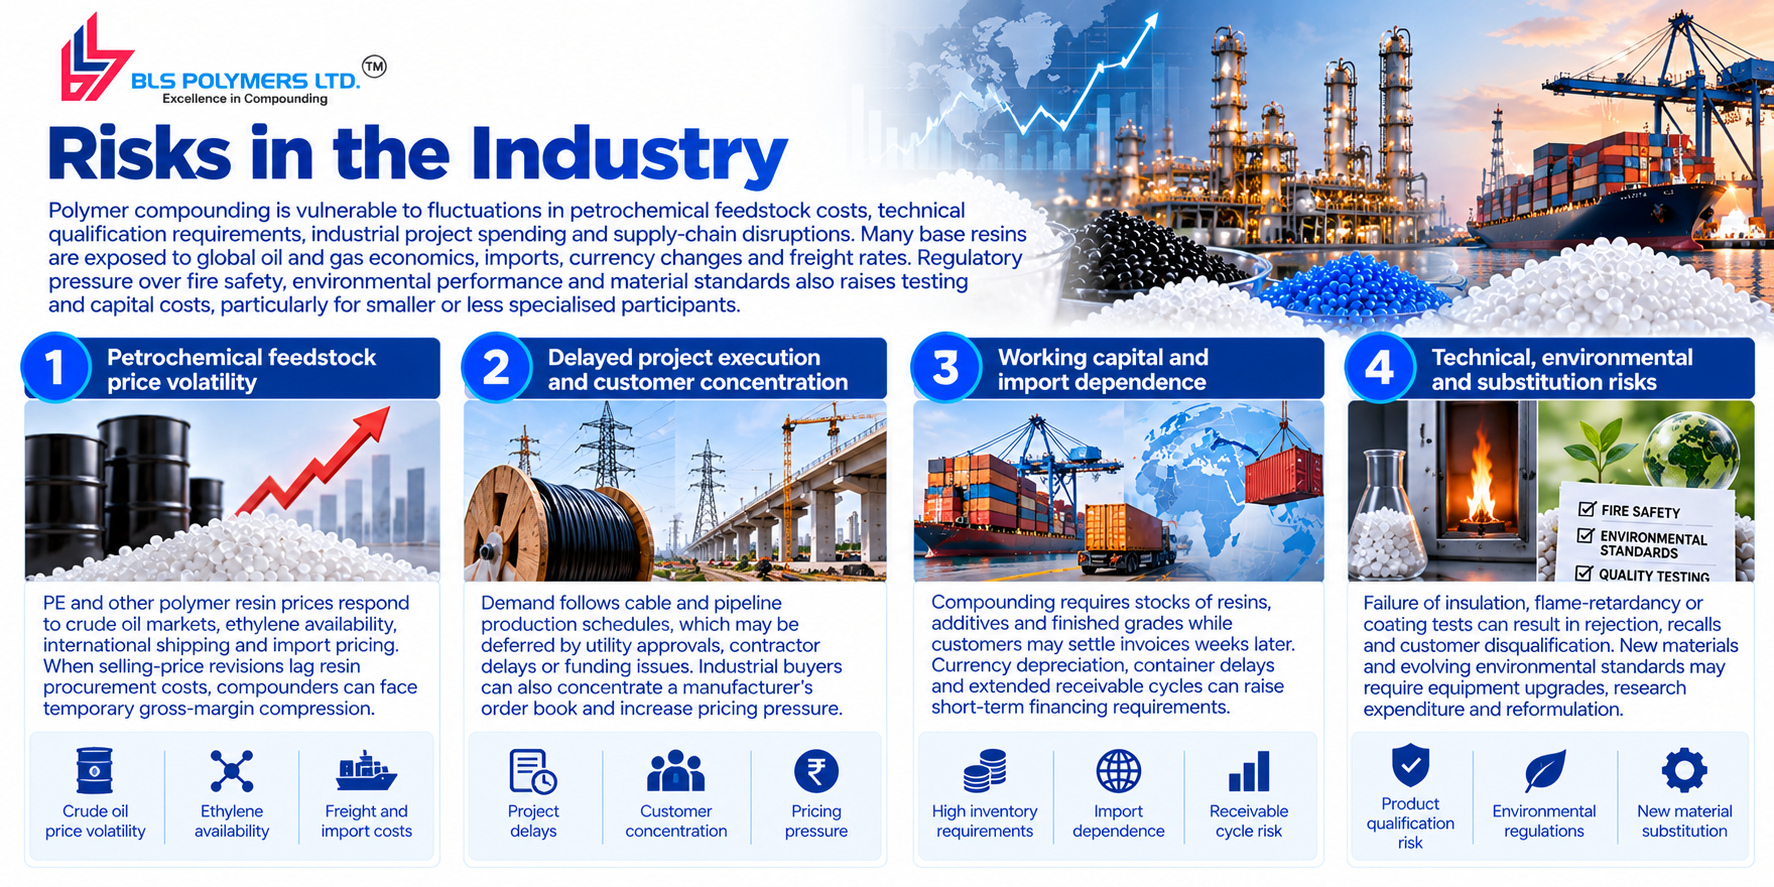
Polymer compounding is vulnerable to fluctuations in petrochemical feedstock costs, technical qualification requirements, industrial project spending and supply-chain disruptions. Many base resins are exposed to global oil and gas economics, imports, currency changes and freight rates. Compounders must often hold raw-material inventory and extend credit while supplying customers under negotiated pricing arrangements, creating margin and cash-conversion exposure. Infrastructure demand can be uneven because cable and pipeline manufacturers schedule purchases around actual project execution. Regulatory pressure over fire safety, environmental performance and material standards also raises testing and capital costs, particularly for smaller or less specialised participants.
The key drivers are:
Petrochemical feedstock price volatility: PE and other polymer resin prices respond to crude oil markets, ethylene availability, international shipping and import pricing. When selling-price revisions lag resin procurement costs, compounders can face temporary gross-margin compression
Delayed project execution and customer concentration: Demand follows cable and pipeline production schedules, which may be deferred by utility approvals, contractor delays or funding issues. Industrial buyers can also concentrate a manufacturer's order book and increase pricing pressure
Working capital and import dependence: Compounding requires stocks of resins, additives and finished grades while customers may settle invoices weeks later. Currency depreciation, container delays and extended receivable cycles can raise short-term financing requirements
Technical, environmental and substitution risks: Failure of insulation, flame-retardancy or coating tests can result in rejection, recalls and customer disqualification. New materials and evolving environmental standards may require equipment upgrades, research expenditure and reformulation
Government Policy Support
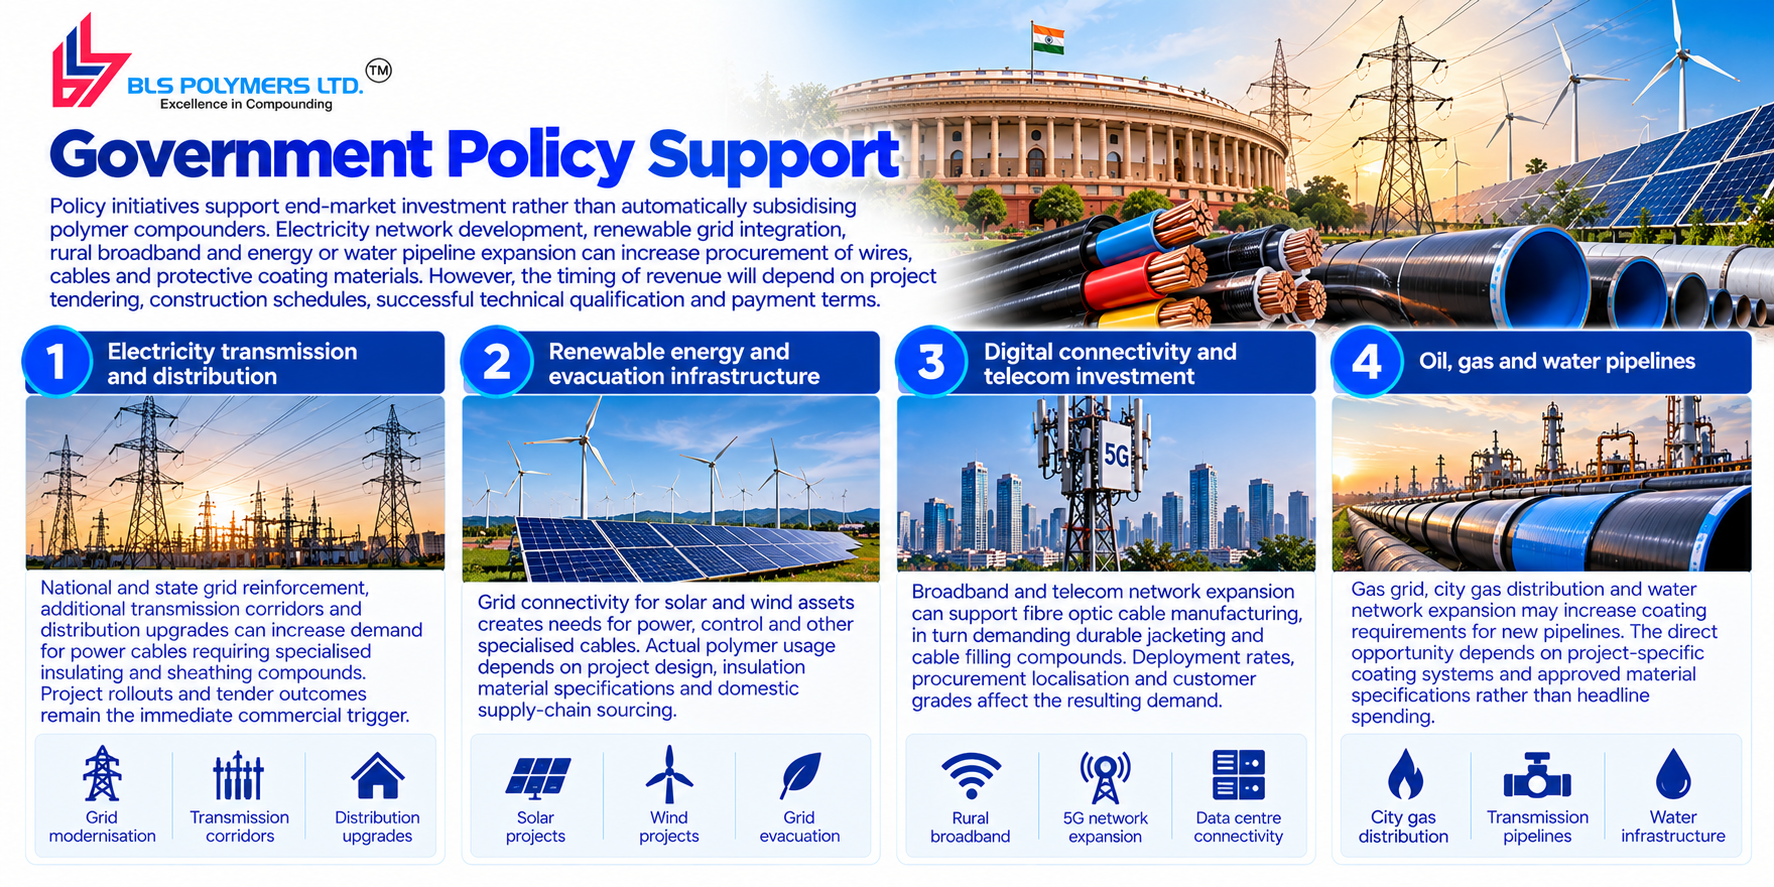
Policy initiatives support end-market investment rather than automatically subsidising polymer compounders. Electricity network development, renewable grid integration, rural broadband and energy or water pipeline expansion can increase procurement of wires, cables and protective coating materials. However, the timing of revenue will depend on project tendering, construction schedules, successful technical qualification and payment terms. BLS operates upstream of these projects and generally supplies cable or coating manufacturers, so it is inappropriate to equate overall policy expenditure directly with BLS sales.
The key policies are:
Electricity transmission and distribution: National and state grid reinforcement, additional transmission corridors and distribution upgrades can increase demand for power cables requiring specialised insulating and sheathing compounds. Project rollouts and tender outcomes remain the immediate commercial trigger
Renewable energy and evacuation infrastructure: Grid connectivity for solar and wind assets creates needs for power, control and other specialised cables. Actual polymer usage depends on project design, insulation material specifications and domestic supply-chain sourcing
Digital connectivity and telecom investment: Broadband and telecom network expansion can support fibre optic cable 1manufacturing, in turn demanding durable jacketing and cable filling compounds. Deployment rates, procurement localisation and customer grades affect the resulting demand
Oil, gas and water pipelines: Gas grid, city gas distribution and water network expansion may increase coating requirements for new pipelines. The direct opportunity depends on project-specific coating systems and approved material specifications rather than headline spending
Fundraise/Future Plans
Shareholding
Pre-issue shareholding
Promoter Holding 0.0%
Post-Issue Shareholding
Promoter Holding 0.0%
Category
Pre-Issue%Post-Issue%
Promoters
Vinod Aggarwal
16.2%11.7%
Sushil Aggarwal
14.2%10.3%
Madhukar Aggarwal
10.3%7.5%
Diwakar Aggarwal
16.1%11.7%
Karan Aggarwal
10.0%7.2%
Promoter Group
31.7%23.1%
Total Promoter Holding
98.5%71.5%
Additional Shareholders
Other Shareholders
1.5%28.5%
Total Additional Holding
1.5%28.5%
Total Shareholding
100.0%100.0%
- Overview
- Business
- Financial Highlights
- Industry Overview
- Fundraise/Future Plans
- Documentation
Get the Preqt App and keep in touch around the clock!
 Monitor your investments in real-time.
- Receive tailored deal suggestions.
- Get real-time updates and alerts.