


Carrier Airconditioning and Refrigeration Ltd.
Cooling Built for PerformanceEngineering Better Indoor Climates
Unlisted Review and Rating
Considerable
DRHP Not FiledOverall Recommendation
Carrier Airconditioning & Refrigeration has a strong operating profile: continuing revenue grew at an 11.4% FY23–FY25 CAGR, FY25 recurring PAT increased to INR 202.5 Cr, margins expanded, ROE is above 35.0%, the balance sheet is effectively debt-free and operating cash flow has remained positive throughout the period reviewed.
The most important correction is that FY25 PAT should not be treated as INR 452.6 Cr for valuation purposes. The disposal of the commercial-refrigeration and other discontinued businesses created a large one-off profit. On the cleaner continuing EPS of INR 19.0/share, the current valuation is approximately 27.0x P/E, which is still materially below Blue Star and Voltas and therefore offers relative valuation comfort. The main risks are the Company's dependence on the global Carrier ecosystem and related-party supply chain, meaningful indirect-tax contingencies, modest board independence, intense HVAC competition and very low public float given 96.5% parent ownership. The Company also has limited direct export earnings despite its multinational parentage.
PARAMETER
WEIGHT
SCORE
KEY FACTORS
Financial Performance
25.0%
4.0/5
Carrier's financial performance is strong. Revenue growth is healthy rather than exceptional, but profit growth has materially outpaced revenue growth, margins are expanding, the balance sheet is effectively debt-free and cash conversion has remained positive
Show more
Detailed Analysis
Continuing revenue increased from INR 2,012.7 Cr in FY23 to INR 2,496.1 Cr in FY25, implying a two-year CAGR of 11.4%. FY25 growth accelerated to 17.1% YoY
FY25 framework EBITDA increased to INR 305.4 Cr, giving an EBITDA margin of 12.2%, versus approximately 9.5% in FY24
Continuing PAT of INR 202.5 Cr translates into an 8.1% PAT margin, up materially from 6.2% in FY24
The Company had no conventional borrowings. FY25 lease liabilities were only INR 22.5 Cr against equity of INR 579.3 Cr, giving lease-adjusted D/E of approximately 0.0x
Normalised FY25 ROE based on continuing PAT and average FY24–FY25 equity was approximately 37.2%, demonstrating very strong capital efficiency
Industry
25.0%
3.0/5
The underlying HVAC demand environment is attractive, particularly because India remains significantly underpenetrated and multiple end-markets are expanding simultaneously. Carrier's own FY24 disclosure reported strong commercial growth, including more than 15.0% growth in commercial business and substantial growth in locally manufactured chillers and airside terminal units
Show more
Detailed Analysis
The broader Indian HVAC market is estimated to grow at approximately 7.5% CAGR between 2025 and 2030. The RAC subsegment is growing faster, with FY25 volumes estimated to have risen approximately 23.0% and longer-term structural demand remaining strong
Regulatory risk is moderate. Air conditioners are subject to mandatory BEE efficiency/label requirements and BIS/QCO product standards, which increase compliance and localisation requirements but also favour established manufacturers
Despite Carrier's global network, direct FY25 foreign-exchange earnings were only INR 25.4 Cr, roughly 1.0% of continuing revenue, while CIF imports were INR 968.3 Cr
Management
25.0%
4.0/5
Sponsor quality is a major strength. Carrier India benefits from the technology, brand, product architecture and procurement ecosystem of a global HVAC leader, while the Indian operating management also has substantial industry tenure
Show more
Detailed Analysis
Carrier Corporation, USA holds approximately 96.5% of the Company. MD Sundaresan Narayanan has been associated with Carrier since 2007, with experience across supply chain, lean manufacturing, ethics and HVAC marketing
The FY25 report-date Board had 7.0 directors, of whom 2.0 were independent, giving approximately 28.6% independence
Carrier naturally has extensive transactions within the global Carrier group. Positively, the FY25 Board Report states that RPTs were in the ordinary course and at arm's length, with no materially significant RPT requiring shareholder approval
Valuation Metrics
25.0%
4.0/5
Against Blue Star and Voltas, Carrier trades at a substantial discount on both P/E and EV/EBITDA despite superior FY25 margins and an effectively debt-free balance sheet. The trade-off is unlisted liquidity, extremely concentrated ownership and the absence of continuous price discovery. P/B is also demanding at approximately 9.5x
Show more
Detailed Analysis
Using recurring FY25 EPS of INR 19.0/share, Carrier trades at approximately 27.0x P/E. Blue Star and Voltas were recently at approximately 60.3x and 68.3x, respectively, giving a peer average of 64.3x. Carrier therefore trades at approximately a 57.9% discount
EV/EBITDA is approximately 16.4x. Current Blue Star and Voltas EV/EBITDA multiples are approximately 37.1x and 59.1x, respectively
FY25 book value is approximately INR 54.5/share, resulting in a high P/B of approximately 9.5x at the indicative price
TOTAL
100%
3.8/5
Weighted Composite Score
Per Share Price
₹525.0
As of 24 Oct 2026
Lot Size
100.0 Shares
Minimum Investment
₹52,500.0 / 100 shares
Market Cap. (₹ Cr)
Revenue FY’25
PAT FY’25
P/E Multiple
Face Value
₹ 10.0Lot Size
100.0 sharesSale Type
Secondary SalePAT FY’25
₹ 202.5 CrPAT Margin (%)
8.1 %P/E Multiple
27.1xCAGR Growth 3Y
11.4 %ROE (FY’25)
37.2 %ROCE (FY’25)
43.0 %Price to Book Value ratio
9.3xMerchant banker appointed
❌ NoCompany Website
www.carrierindia.comDisclaimer: Unlisted shares are unregulated & illiquid. This is NOT investment advice. Please do your own due diligence before investing.
Minimum Investment
₹52,500.0 / 100 sharesShares Lot 100 X 1
Investment amount
₹52,500.0
Overview
Business
Products
Business Model
Geographical Presence
Sales Channel
Financial Highlights
Income Statement
Revenue growth with EBITDA and PAT margins
| Financial Metric | FY 2023 | FY 2024 | FY 2025 |
|---|---|---|---|
| Revenue (₹ Cr) | 2,012.7 | 2,131.1 | 2,496.1 |
| Growth (%) | 0.0% | 5.9% | 17.1% |
| EBITDA (₹ Cr) | 124.4 | 173.7 | 257.9 |
| EBITDA Margin (%) | 6.2% | 8.2% | 10.3% |
| PAT (₹ Cr) | 96.7 | 131.8 | 202.5 |
| PAT Margin (%) | 4.8% | 6.2% | 8.1% |
OBSERVATIONS & INSIGHTS
Continuing revenue rose 5.9% in FY24 and accelerated 17.1% in FY25. Management attributed FY25 to robust commercial-HVAC demand, increased footprint, VRF share gains, local-product launches and stronger applied systems. The two-year continuing-revenue CAGR of 11.4% is a more comparable growth measure than total revenue because the commercial-refrigeration business was divested
EBITDA margin improved from 6.2% in FY23 to 8.2% in FY24 and 10.3% in FY25. The improvement suggests better scale, product mix and localisation, although raw-material, project-pricing and competitive pressures can still cause cyclicality
Continuing PAT more than doubled from INR 96.7 Cr in FY23 to INR 202.5 Cr in FY25. FY25 reported PAT of INR 452.6 Cr is materially higher because discontinued operations included the sale of commercial refrigeration; that headline number should not be capitalised into a recurring P/E
The commercial-refrigeration slump sale to Haier generated consideration of INR 275.8 Cr and a pre-tax gain of INR 261.5 Cr. Separately, sale of Kiddel Technologies India Private Limited in the Fire & Security divestment generated consideration of INR 41.9 Cr and a gain of INR 21.5 Cr. Together these transactions explain most of the gap between FY25 continuing PAT of INR 202.5 Cr and reported PAT of INR 452.6 Cr
Balance Sheet
| Financial Metric | FY 2023 | FY 2024 | FY 2025 |
|---|---|---|---|
| EQUITY & LIABILITIES | ₹ 1,137.0 Cr | ₹ 1,483.3 Cr | ₹ 1,647.9 Cr |
| Net Worth | ₹ 372.6 Cr | ₹ 509.1 Cr | ₹ 579.4 Cr |
| Share Capital | ₹ 106.4 Cr | ₹ 106.4 Cr | ₹ 106.4 Cr |
| Reserves & Surplus | ₹ 266.2 Cr | ₹ 402.7 Cr | ₹ 473.0 Cr |
| Total Liabilities | ₹ 764.4 Cr | ₹ 974.2 Cr | ₹ 1,068.5 Cr |
| Current Liabilities | ₹ 684.6 Cr | ₹ 888.5 Cr | ₹ 977.1 Cr |
| Borrowings | ₹ 0.0 Cr | ₹ 0.0 Cr | ₹ 0.0 Cr |
| Trade Payables | ₹ 529.5 Cr | ₹ 687.0 Cr | ₹ 787.9 Cr |
| Other Current Liabilities | ₹ 155.1 Cr | ₹ 201.5 Cr | ₹ 189.2 Cr |
| Non-Current Liabilities | ₹ 79.8 Cr | ₹ 85.7 Cr | ₹ 91.4 Cr |
| Borrowings | ₹ 0.0 Cr | ₹ 0.0 Cr | ₹ 0.0 Cr |
| Other Non-Current Liabilities | ₹ 79.8 Cr | ₹ 85.7 Cr | ₹ 91.4 Cr |
| ASSETS | ₹ 1,136.9 Cr | ₹ 1,483.3 Cr | ₹ 1,647.9 Cr |
| Current Assets | ₹ 953.0 Cr | ₹ 1,271.4 Cr | ₹ 1,405.0 Cr |
| Trade Receivables | ₹ 323.9 Cr | ₹ 331.9 Cr | ₹ 382.8 Cr |
| Inventory | ₹ 343.6 Cr | ₹ 378.8 Cr | ₹ 422.1 Cr |
| Cash & Cash Equivalents | ₹ 198.4 Cr | ₹ 419.9 Cr | ₹ 480.5 Cr |
| Other Current Assets | ₹ 87.1 Cr | ₹ 140.8 Cr | ₹ 119.6 Cr |
| Non-Current Assets | ₹ 183.9 Cr | ₹ 211.9 Cr | ₹ 242.9 Cr |
| Fixed Assets | ₹ 98.8 Cr | ₹ 108.9 Cr | ₹ 133.0 Cr |
| Other Non-Current Assets | ₹ 85.1 Cr | ₹ 103.0 Cr | ₹ 109.9 Cr |
OBSERVATIONS & INSIGHTS
Balance-sheet growth is healthy rather than leverage-driven. Total assets increased from INR 1,137.0 Cr in FY23 to INR 1,647.9 Cr in FY25, while equity increased to INR 579.3 Cr. The balance-sheet expansion was funded through retained earnings, trade credit and operating liabilities rather than bank debt
The asset mix is working-capital and cash intensive. FY25 cash of INR 480.5 Cr, inventory of INR 422.1 Cr and receivables of INR 382.8 Cr together represent the majority of current assets. Fixed assets remain modest relative to revenue despite increasing localization, which supports capital efficiency but means supplier and inventory management remain critical
Cash Flow
| Financial Metric | FY 2023 | FY 2024 | FY 2025 |
|---|---|---|---|
CFO (₹ Cr) Cash generated from core business operations. | +161.5 Cr | +273.1 Cr | +171.5 Cr |
CFI (₹ Cr) Cash used for investments and long-term assets. | -8.1 Cr | -21.7 Cr | +284.0 Cr |
CFF (₹ Cr) Cash flow related to funding and borrowings. | -20.0 Cr | -21.6 Cr | -394.7 Cr |
Working Capital
| Efficiency Metric | FY 2023 | FY 2024 | FY 2025 |
|---|---|---|---|
Debtor Days Average number of days taken to collect customer payments. | - | - | - |
Creditor Days Average time taken to pay suppliers and vendors. | - | - | - |
Inventory Days Average number of days inventory remains unsold. | - | - | - |
CCC (Cash Conversion Cycle) (Debtor Days + Inventory Days - Creditor Days) | - | - | - |
Financial Ratios
Measures the company’s leverage relative to shareholder equity.
OBSERVATIONS & INSIGHTS
Returns are strong on a normalized basis. FY25 reported ROE of 79.0% is not an appropriate steady-state return because total PAT includes the disposal gain and the Company distributed a large dividend. Using continuing PAT and average equity gives an analytical FY25 ROE of approximately 37.2%, still materially above most listed peers
The Company remains conventionally debt-free. Finance cost is predominantly lease-related and immaterial relative to operating profit, producing very high interest coverage. This gives Carrier financial flexibility, but the high cash balance and parent-controlled dividend policy mean minority investors must monitor whether surplus capital is retained, invested or distributed
Industry Overview
Industry Drivers
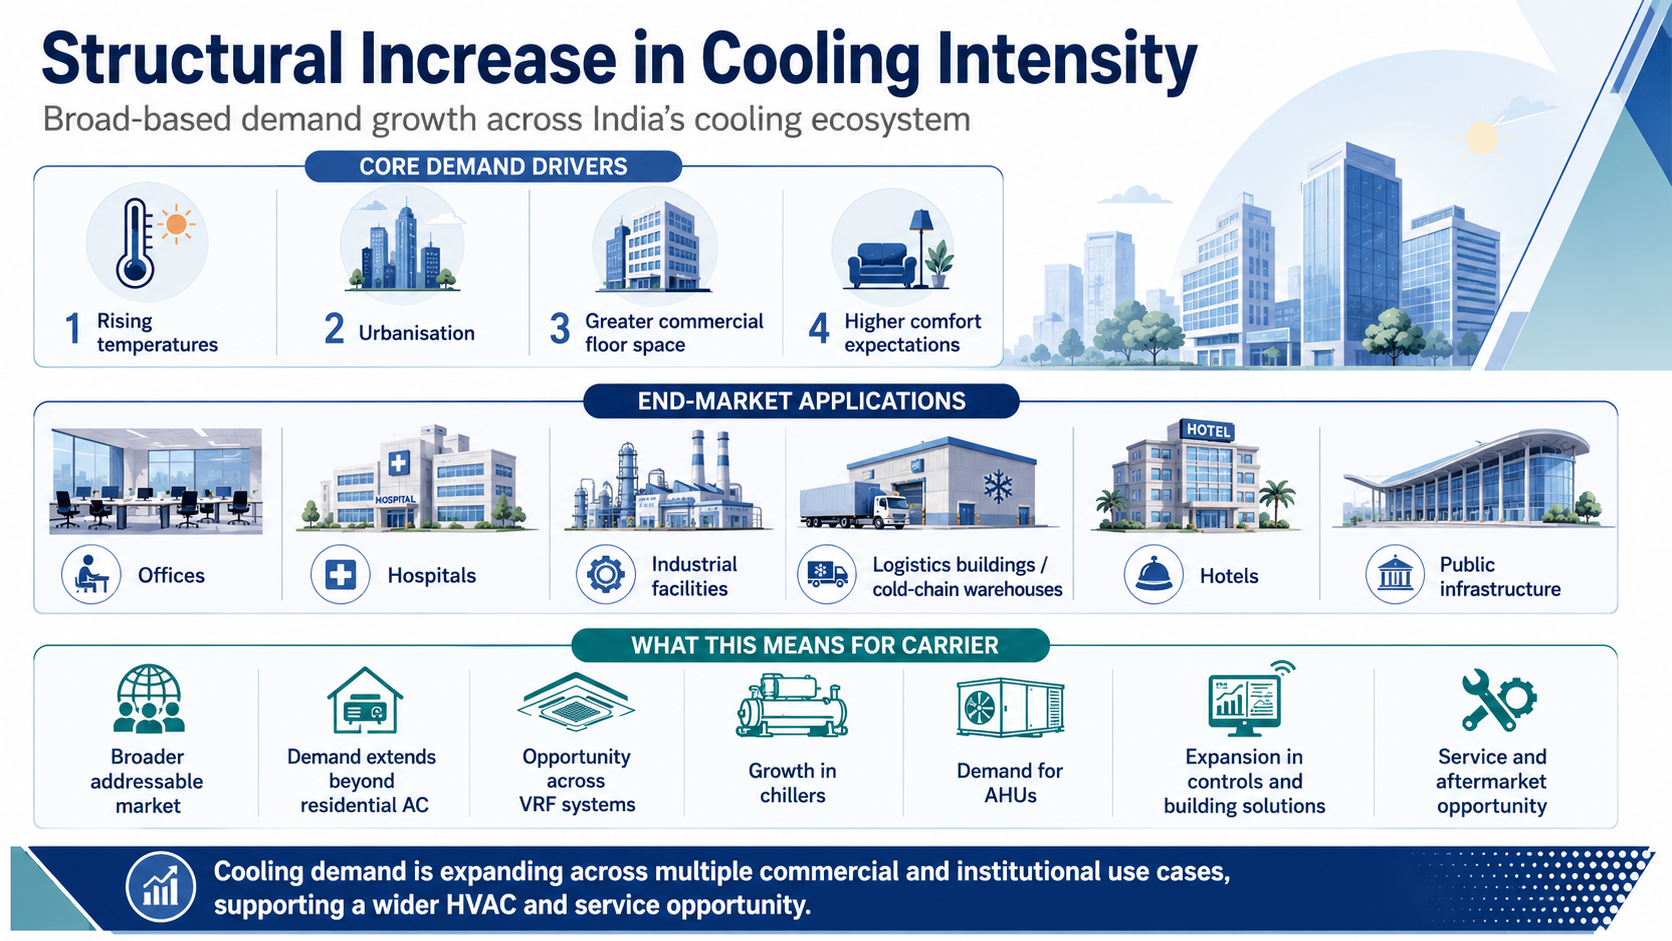
Structural increase in cooling intensity
Rising temperatures, urbanisation, greater commercial floor space and higher comfort expectations are increasing cooling intensity across India
The benefit extends beyond residential AC penetration: offices, hospitals, industrial facilities, logistics buildings, hotels and public infrastructure require larger and more sophisticated systems
For Carrier, this broadens the addressable market for VRF, chillers, AHUs, controls and service rather than relying only on one product cycle
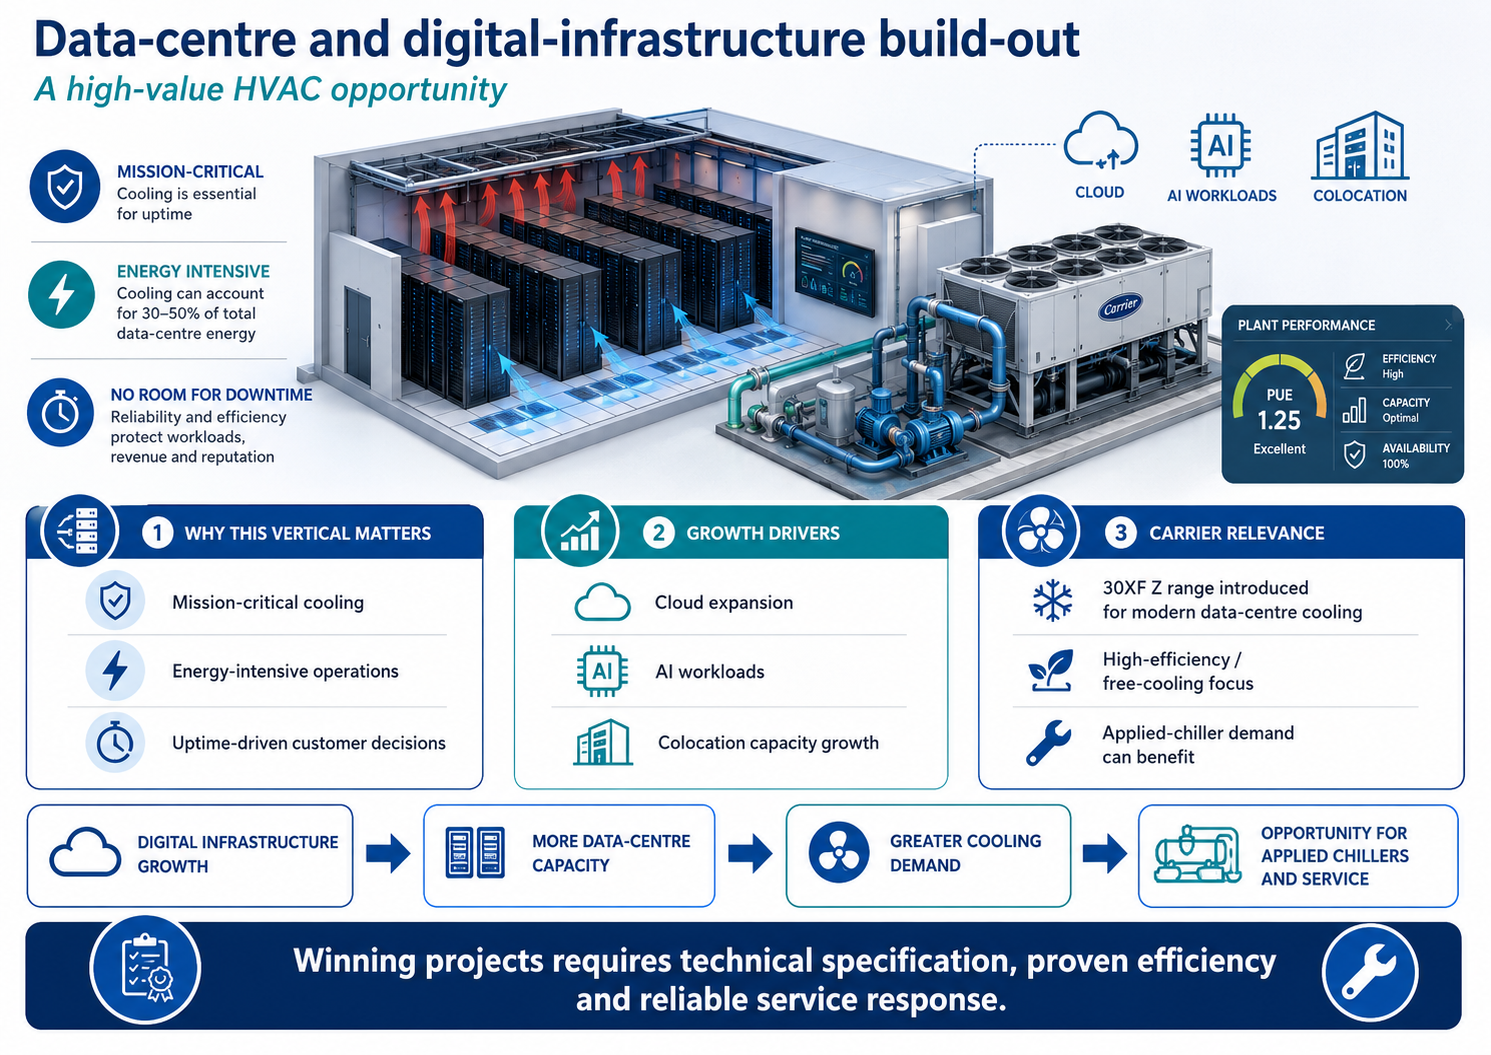
Data-centre and digital-infrastructure build-out
Data centres are a high-value HVAC vertical because cooling is mission-critical, energy intensive and closely tied to uptime
Carrier introduced the 30XF Z range for modern data-centre cooling and highlights high-efficiency/free-cooling performance. Growth in cloud, AI workloads and colocation capacity can support applied-chiller demand, but winning projects requires technical specification, proven efficiency and reliable service response
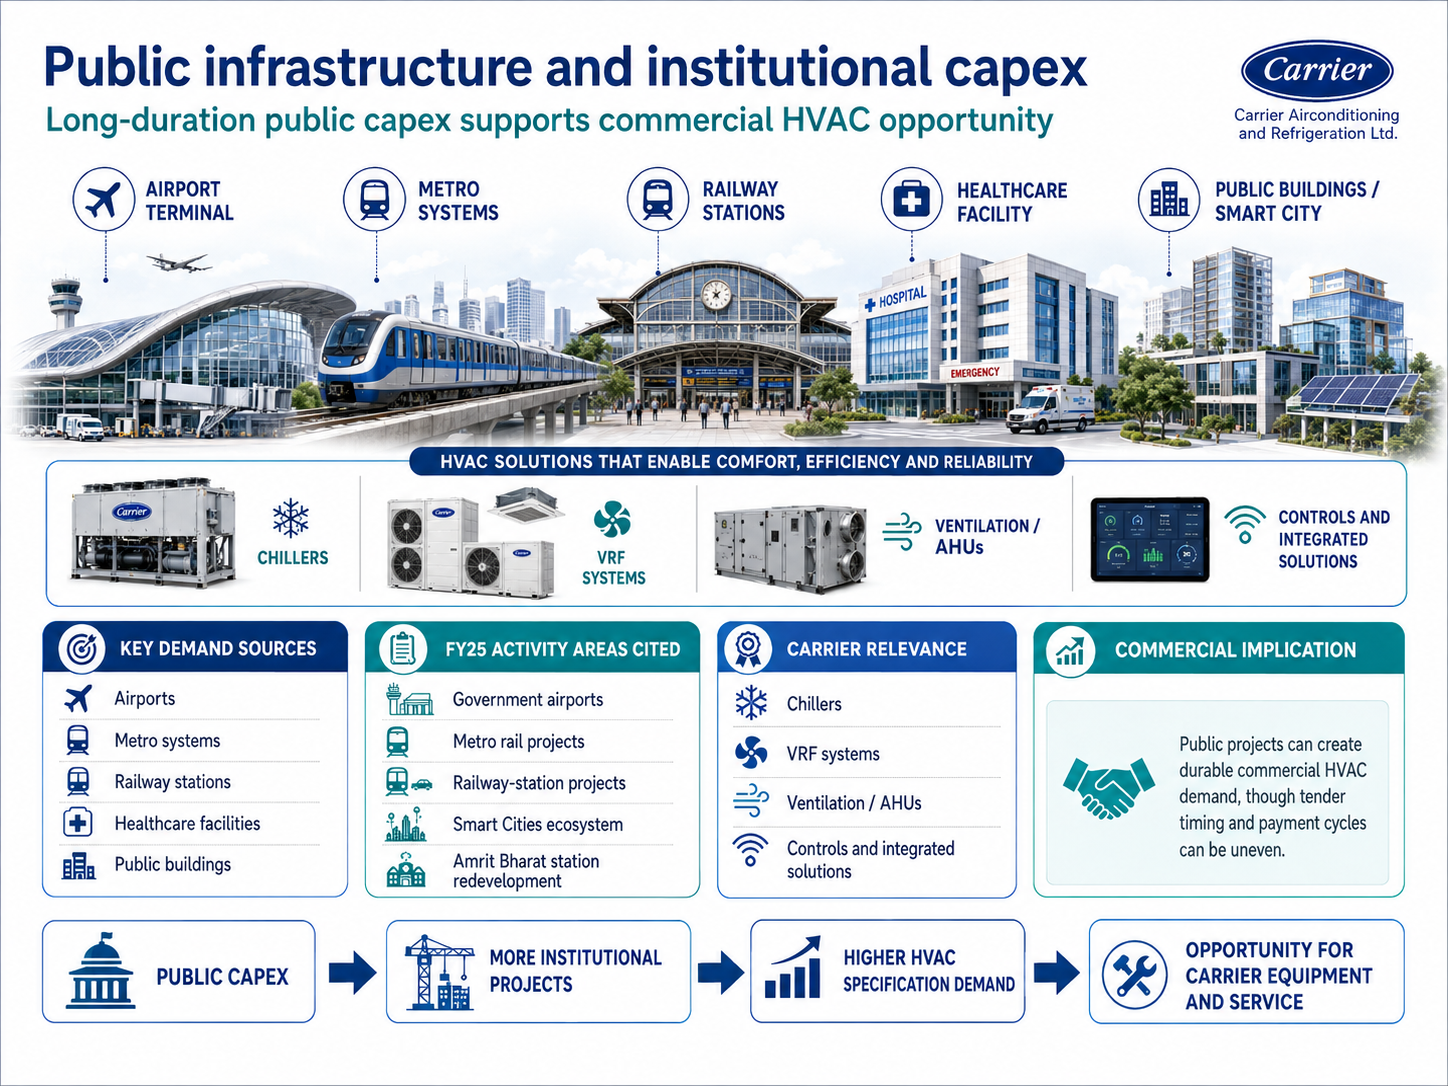
Public infrastructure and institutional capex
Airports, metro systems, railway stations, healthcare facilities and public buildings create project demand for chillers, VRF, ventilation and controls
Carrier’s FY25 report specifically cites government airports, metro rail, railway-station projects, the Smart Cities ecosystem and Amrit Bharat station redevelopment as sources of market activity. Long-duration public capex therefore supports the commercial HVAC opportunity, although tender timing and payment cycles can be uneven
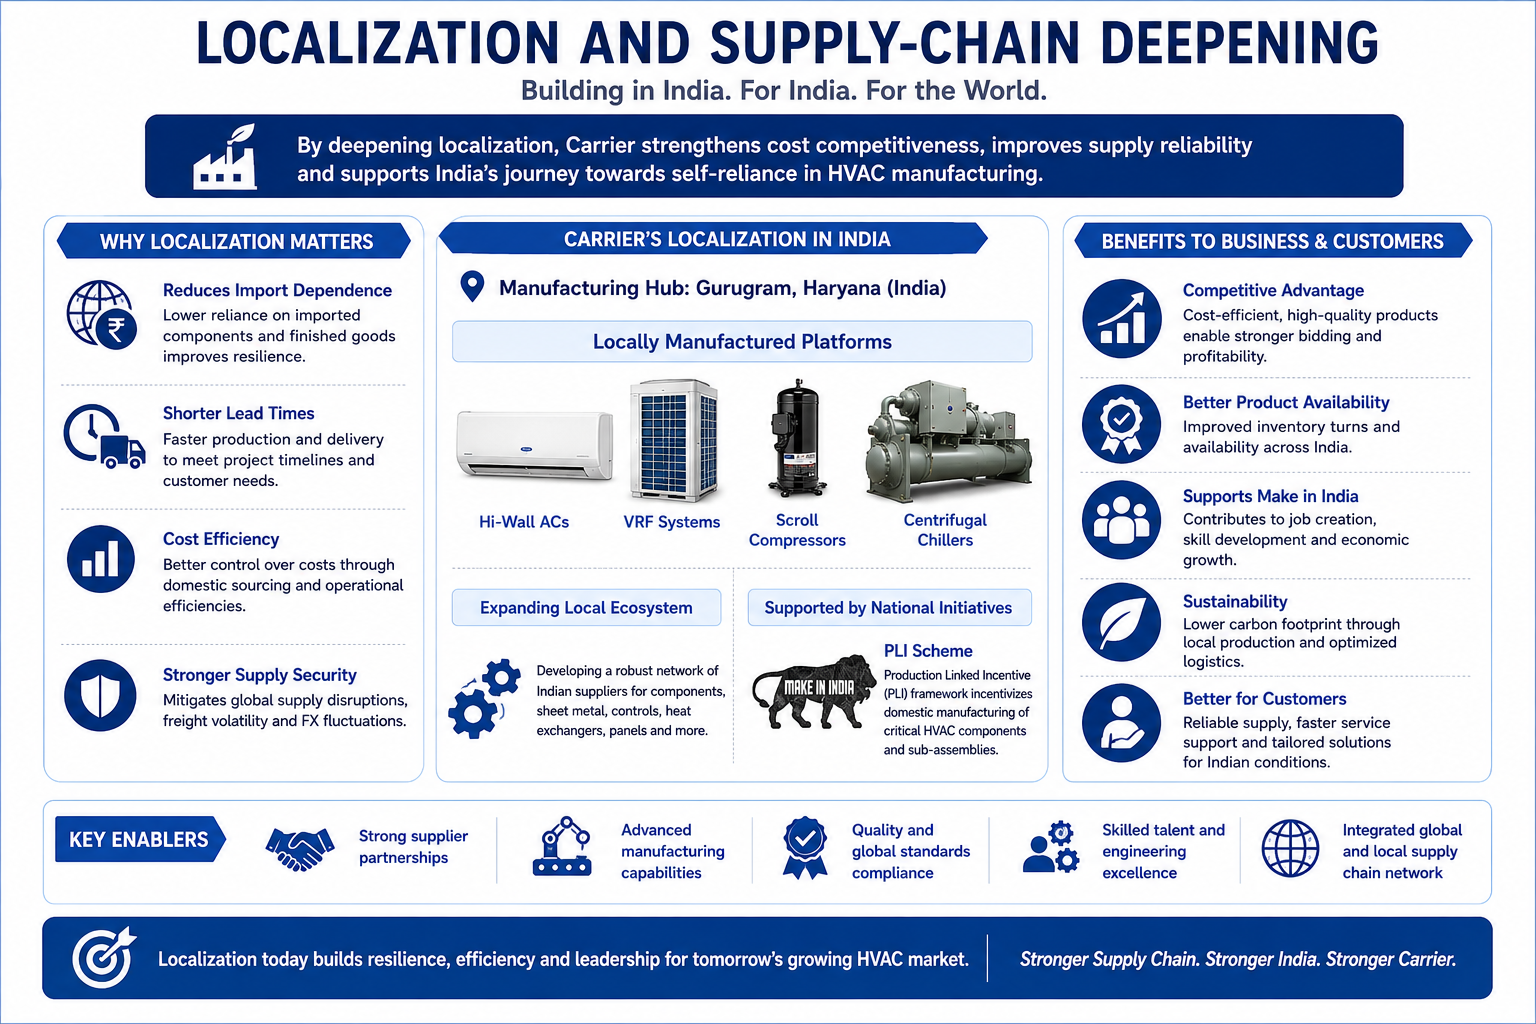
Localization and supply-chain deepening
Domestic production of chillers, VRF and AC components can reduce import dependence, shorten lead times and improve cost control
Carrier has been localizing Hi-Wall, VRF, scroll and centrifugal-chiller platforms in Gurugram, while the national PLI framework incentivises the wider component ecosystem. Localization is especially valuable when foreign exchange, freight or global component constraints are volatile
Government Policy Support
The India Cooling Action Plan sets national objectives to reduce cooling demand across sectors by 20%-25%, refrigerant demand by 25%-30% and cooling-energy requirements by 25%-40% by 2037-38. The policy direction favours high-efficiency equipment, lower-GWP refrigerants, better building design and technician capability. For Carrier, this supports efficient chillers, variable-speed systems, low-GWP product platforms and lifecycle optimisation, while also raising the compliance bar for legacy technology
The Production Linked Incentive Scheme for White Goods has an approved outlay of INR 6,238.0 Cr and runs through FY28-29. It targets AC components such as compressors, copper tubes, control assemblies, heat exchangers and BLDC motors rather than finished products alone. A deeper local component ecosystem can improve sourcing resilience and economics for manufacturers such as Carrier even if the Company itself is not assumed to be a beneficiary without specific evidence
Union Budget FY25-26 allocated INR 11.21 lakh Cr to capital expenditure, equivalent to 3.1% of GDP. Sustained public investment in transport and urban infrastructure expands the addressable pool of airports, stations, public buildings, metros and related facilities requiring HVAC and ventilation
The Amrit Bharat Station Scheme is redeveloping more than 1,300 railway stations with upgraded buildings, passenger amenities, multimodal integration and sustainable infrastructure. HVAC demand per station varies, but the programme creates a multi-year pipeline of public-building refurbishment opportunities for VRF, packaged equipment, ventilation and controls
Bureau of Energy Efficiency standards and star labelling make energy performance visible in air-conditioning purchases and encourage higher-efficiency equipment. For commercial customers, lifecycle energy cost is often a major procurement variable even beyond mandatory labels
Green-building certification and corporate decarbonisation targets increase demand for energy-efficient HVAC, heat recovery, low-GWP refrigerants, building controls and measurable performance. Carrier’s Gurugram factory has achieved IGBC Platinum certification and the Company is positioning energy audits, high-efficiency chillers and Chiller Plant Optimizer solutions around these customer objectives
- Overview
- Business
- Financial Highlights
- Industry Overview
- Documentation
Get the Preqt App and keep in touch around the clock!
 Monitor your investments in real-time.
- Receive tailored deal suggestions.
- Get real-time updates and alerts.
