

Core Energy Systems Limited
Powering Strategic EngineeringEngineering Strategic Infrastructure
Unlisted Review and Rating
Speculative
DRHP Not FiledOverall Recommendation
CESL is one of the more interesting companies in the unlisted engineering universe from a business-quality and industry-positioning perspective. FY25 revenue nearly doubled, PAT increased almost ninefold, leverage collapsed after the equity infusion, the INR 557 Cr order book provides more than 2.5x FY25 revenue visibility, and the Company operates in difficult-to-enter nuclear, defence and mission-critical engineering niches.
The two major weaknesses are cash conversion and valuation. FY25 PAT of INR 18.5 Cr was accompanied by approximately INR 60.9 Cr of negative operating cash flow, while receivables reached INR 144 Cr and collection days remained around 185. That is understandable in government/nuclear EPC, but it means reported earnings cannot be evaluated without tracking collections. More importantly, at approximately INR 16,800/share and INR 4,171 Cr market capitalisation, investors are paying roughly 225x FY25 earnings, 19x sales and ~148x core EBITDA. Even allowing a substantial scarcity premium for a private nuclear-engineering platform, that valuation leaves very little room for execution disappointment.
PARAMETER
WEIGHT
SCORE
KEY FACTORS
Financial Performance
25.0%
4.0/5
Exceptional growth, PAT expansion and deleveraging are major positives, but weak cash conversion and a long receivable cycle materially temper financial quality
Show more
Detailed Analysis
FY25 operating revenue increased 93.3% to ₹218.1 Cr. FY23-FY25 revenue CAGR is approximately 42.0%, demonstrating excellent scaling
Core EBITDA increased to ~INR 28.0 Cr, but margin moderated from 14.5% to 12.8%. Profitability remains healthy for project EPC but did not expand with scale
PAT increased almost 9x to INR 18.5 Cr and PAT margin expanded from ~1.8% to 8.5%, reflecting operating growth and lower financing burden
Excellent improvement: debt fell to INR 28.4 Cr and gearing declined to only ~0.1x, versus ~2.18x in FY24
FY25 PAT represents approximately 8.0% of year-end equity. The return is reasonable but modest because the large equity raise materially increased the capital base
Industry
25.0%
4.0/5
CESL sits in exceptionally attractive nuclear and defence capex themes with high entry barriers, though tender dependence and regulatory execution remain material
Show more
Detailed Analysis
Nuclear and defence are among India's strongest structural capex themes, with nuclear capacity targeted to rise from 8.8 GW to 100 GW by 2047
Nuclear and defence are extremely regulated sectors; approvals and qualification requirements increase execution complexity but simultaneously strengthen barriers to entry
International subsidiaries and Ethiopian utility orders provide optionality, but actual FY25 foreign-exchange earnings remained limited relative to import-linked outgo
Management
25.0%
4.0/5
Strong promoter experience, specialist execution capability and improved governance are positives; family concentration and related-party/remuneration history warrant continued monitoring
Show more
Detailed Analysis
Founder Nagesh Basarkar has more than two decades of engineering-sector experience and has led CORE since its origins in 1997
The board includes multiple independent/non-executive directors in addition to promoter executives, with Audit and NRC structures in place
Family representation, promoter-linked transactions and historical excess remuneration waivers require monitoring despite disclosure and approvals
Valuation Metrics
25.0%
1.0/5
CESL's nuclear scarcity deserves a premium, but ~225x earnings and ~148x EV/EBITDA already price in extremely aggressive future execution
Show more
Detailed Analysis
At approximately 225x FY25 PAT, CESL trades above MTAR Technologies at ~161x and vastly above broader engineering peers such as KSB
Approximate 148x EV/core EBITDA is extremely demanding versus MTAR at ~95x, KSB ~33x and Kirloskar Brothers ~26x
17-18x book is very high relative to an ~8% year-end ROE, although specialist nuclear scarcity partly explains the premium
TOTAL
100%
3.3/5
Weighted Composite Score
Per Share Price
₹17000.0
As of 24 Oct 2026
Lot Size
10.0 Shares
Minimum Investment
₹1,70,000.0 / 10 shares
Market Cap. (₹ Cr)
Revenue FY’25
PAT FY’25
P/E Multiple
Face Value
₹ 10.0Lot Size
10.0 sharesSale Type
Secondary SalePAT FY’25
₹ 18.5 CrPAT Margin (%)
8.5 %P/E Multiple
199.2xCAGR Growth 2Y
45.4 %ROE (FY’25)
13.8 %ROCE (FY’25)
17.9 %Price to Book Value ratio
17.0xDebt/Equity (FY’25)
0.1xMerchant banker appointed
❌ NoCompany Website
core.co.inDisclaimer: Unlisted shares are unregulated & illiquid. This is NOT investment advice. Please do your own due diligence before investing.
Minimum Investment
₹1,70,000.0 / 10 sharesShares Lot 10 X 1
Investment amount
₹1,70,000.0
Overview
Business
Business Model
Geographical Presence
Sales Channel
Financial Highlights
Income Statement
Revenue growth with EBITDA and PAT margins
| Financial Metric | FY 2023 | FY 2024 | FY 2025 |
|---|---|---|---|
| Revenue (₹ Cr) | 108.2 | 112.9 | 218.1 |
| Growth (%) | 0.0% | 4.3% | 93.3% |
| EBITDA (₹ Cr) | 4.7 | 18.9 | 35.1 |
| EBITDA Margin (%) | 4.3% | 16.8% | 16.1% |
| PAT (₹ Cr) | 1.4 | 2.1 | 18.5 |
| PAT Margin (%) | 1.3% | 1.8% | 8.5% |
OBSERVATIONS & INSIGHTS
Revenue doubled over two years, driven by a 93.3% increase in FY25 project execution, FY24 was almost flat before the FY25 step-up, so backlog conversion and repeatability matter more than a straight-line extrapolation
EBITDA increased from INR 4.7 Cr to INR 35.1 Cr as scale absorbed overhead and the project mix improved, Margin expanded sharply versus FY23 but eased by 0.7 percentage points in FY25, indicating that the growth year did not produce additional operating leverage
PBT reached INR 22.2 Cr despite INR 10.1 Cr of finance cost, showing positive operating earnings but continued working-capital funding expense
PAT increased almost ninefold in FY25, partly because the effective tax burden normalised after the FY24 Ind AS transition, The net margin reached 8.5%; sustainability depends on project mix, variation claims, bad-debt experience and tax normalisation
Balance Sheet
| Financial Metric | FY 2023 | FY 2024 | FY 2025 |
|---|---|---|---|
| EQUITY & LIABILITIES | ₹ 146.0 Cr | ₹ 185.6 Cr | ₹ 359.3 Cr |
| Net Worth | ₹ 35.9 Cr | ₹ 38.6 Cr | ₹ 230.0 Cr |
| Share Capital | ₹ 2.2 Cr | ₹ 2.2 Cr | ₹ 2.4 Cr |
| Reserves & Surplus | ₹ 33.7 Cr | ₹ 36.4 Cr | ₹ 227.6 Cr |
| Total Liabilities | ₹ 110.1 Cr | ₹ 147.0 Cr | ₹ 129.3 Cr |
| Current Liabilities | ₹ 76.5 Cr | ₹ 114.0 Cr | ₹ 122.6 Cr |
| Borrowings | ₹ 12.7 Cr | ₹ 32.0 Cr | ₹ 27.2 Cr |
| Trade Payables | ₹ 6.5 Cr | ₹ 8.3 Cr | ₹ 34.8 Cr |
| Other Current Liabilities | ₹ 57.3 Cr | ₹ 73.7 Cr | ₹ 60.6 Cr |
| Non-Current Liabilities | ₹ 33.6 Cr | ₹ 33.0 Cr | ₹ 6.7 Cr |
| Borrowings | ₹ 29.7 Cr | ₹ 30.2 Cr | ₹ 3.3 Cr |
| Other Non-Current Liabilities | ₹ 3.9 Cr | ₹ 2.8 Cr | ₹ 3.4 Cr |
| ASSETS | ₹ 144.9 Cr | ₹ 185.6 Cr | ₹ 359.1 Cr |
| Current Assets | ₹ 129.7 Cr | ₹ 165.5 Cr | ₹ 322.5 Cr |
| Trade Receivables | ₹ 28.5 Cr | ₹ 70.2 Cr | ₹ 144.1 Cr |
| Inventory | ₹ 14.9 Cr | ₹ 8.9 Cr | ₹ 5.6 Cr |
| Cash & Cash Equivalents | ₹ 22.9 Cr | ₹ 29.6 Cr | ₹ 90.6 Cr |
| Other Current Assets | ₹ 63.4 Cr | ₹ 56.8 Cr | ₹ 82.2 Cr |
| Non-Current Assets | ₹ 15.2 Cr | ₹ 20.1 Cr | ₹ 36.6 Cr |
| Fixed Assets | ₹ 12.0 Cr | ₹ 12.4 Cr | ₹ 17.8 Cr |
| Other Non-Current Assets | ₹ 3.2 Cr | ₹ 7.7 Cr | ₹ 18.8 Cr |
OBSERVATIONS & INSIGHTS
Shareholders’ wealth increased almost sixfold to INR 230.0 Cr after the FY25 private placement and retained profit, Preference shares were redeemed at a 20% IRR and equity share capital increased through the private placement and ESOP exercise, changing the capital mix materially
Total borrowings fell from INR 62.3 Cr to INR 30.4 Cr, and non-current debt reduced sharply after funding was raised
Trade payables increased to INR 34.8 Cr as execution scaled, while other current liabilities and provisions remained a material INR 60.6 Cr
Closing cash increased to INR 90.6 Cr because financing inflow outweighed operating and investing outflows; it should not be interpreted as internally generated surplus
Trade receivables doubled to INR 144.1 Cr and represented 40.1% of total assets, making collection quality the dominant balance-sheet risk
Inventory declined despite higher activity, consistent with a more project- and procurement-led mix, but inventory obsolescence and contract allocation remain relevant
Fixed assets increased to INR 17.8 Cr as facilities and right-of-use assets expanded, yet the asset base remains working-capital heavy rather than plant heavy
Cash Flow
| Financial Metric | FY 2023 | FY 2024 | FY 2025 |
|---|---|---|---|
CFO (₹ Cr) Cash generated from core business operations. | +3.1 Cr | -3.9 Cr | -60.7 Cr |
CFI (₹ Cr) Cash used for investments and long-term assets. | -1.9 Cr | -0.8 Cr | -3.0 Cr |
CFF (₹ Cr) Cash flow related to funding and borrowings. | +11.0 Cr | +11.1 Cr | +124.7 Cr |
Working Capital
| Efficiency Metric | FY 2023 | FY 2024 | FY 2025 |
|---|---|---|---|
Debtor Days Average number of days taken to collect customer payments. | - | - | - |
Creditor Days Average time taken to pay suppliers and vendors. | - | - | - |
Inventory Days Average number of days inventory remains unsold. | - | - | - |
CCC (Cash Conversion Cycle) (Debtor Days + Inventory Days - Creditor Days) | - | - | - |
Financial Ratios
Measures the company’s leverage relative to shareholder equity.
OBSERVATIONS & INSIGHTS
Average-equity ROE improved to 13.8%; using closing equity would produce only 8.1%, which is more representative after the capital raise
Leverage fell to 0.1x as private-placement proceeds increased equity and supported repayment of non-current borrowing
Coverage improved to 3.5x but remains exposed to project delays and collection slippage because finance cost was INR 10.1 Cr
The ratio rose to 2.6x, supported by cash and receivables; asset quality is therefore more important than the headline ratio
ROA increased to 6.8% as profit rose, but the expanded year-end cash balance and receivables dilute asset efficiency
ROCE held near 18.0% after the capital raise, indicating positive accounting return but not positive cash conversion
Industry Overview
Industry Drivers
Nuclear Capacity Expansion
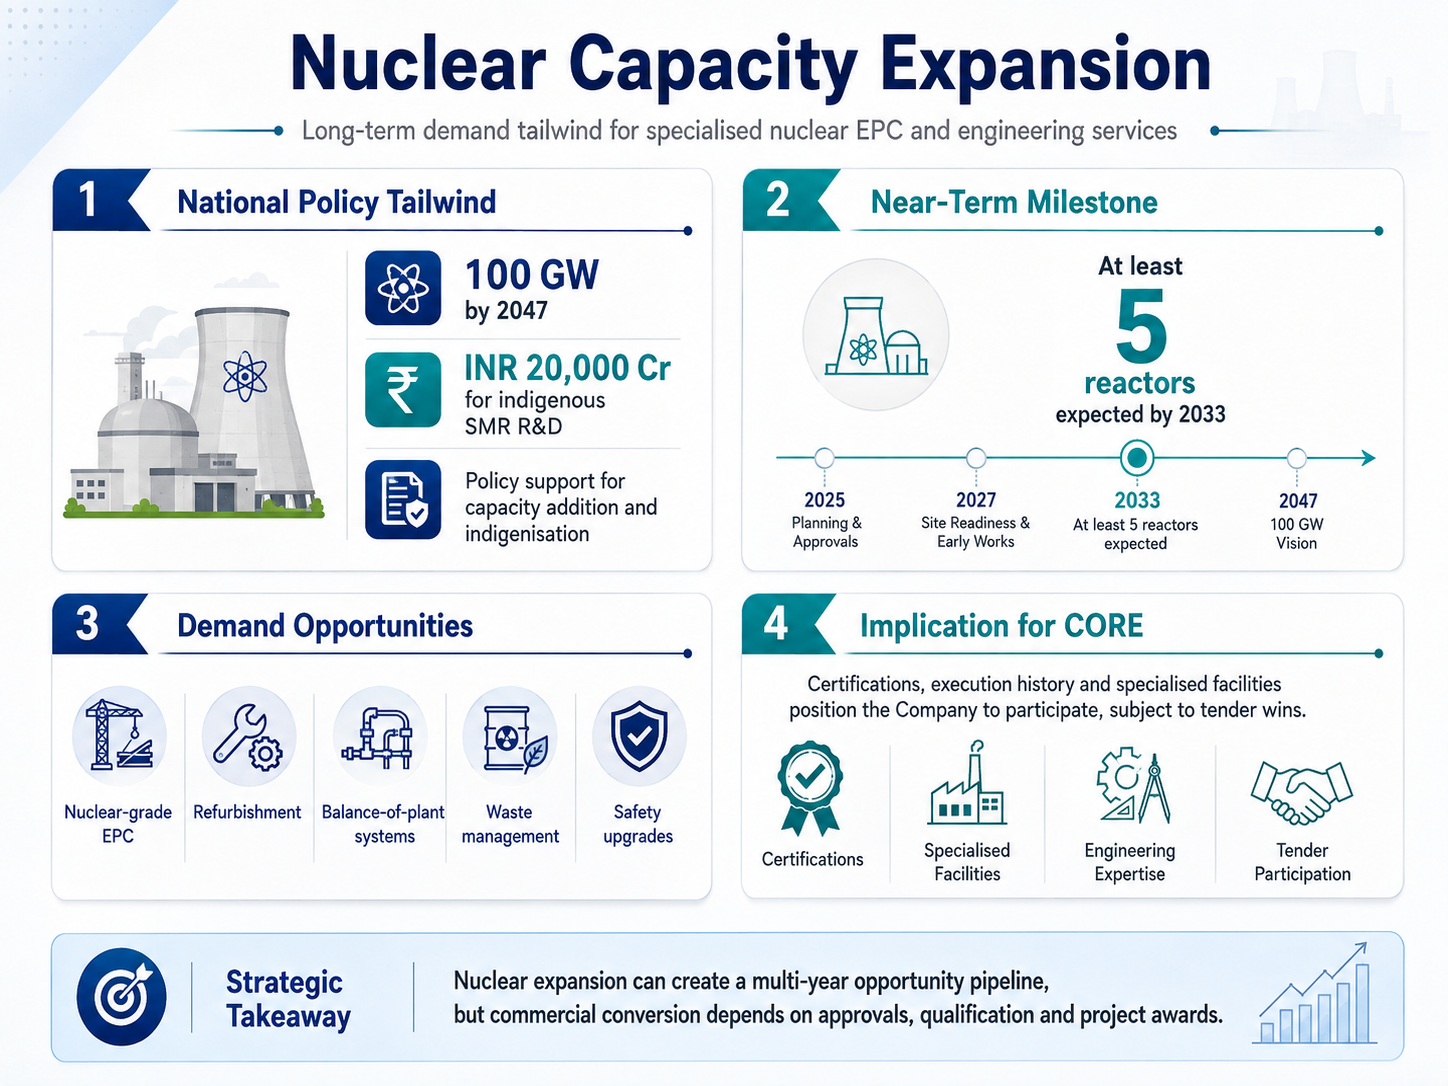
India’s Nuclear Energy Mission targets 100 GW by 2047 and includes INR 20,000 Cr for indigenous SMR research and development, with at least five reactors expected by 2033
This creates long-term demand for nuclear-grade EPC, refurbishment, balance-of-plant systems, waste management and safety upgrades. The Company’s certifications, execution history and specialised facilities position it to participate, subject to tender wins
Defence Modernisation and Indigenisation
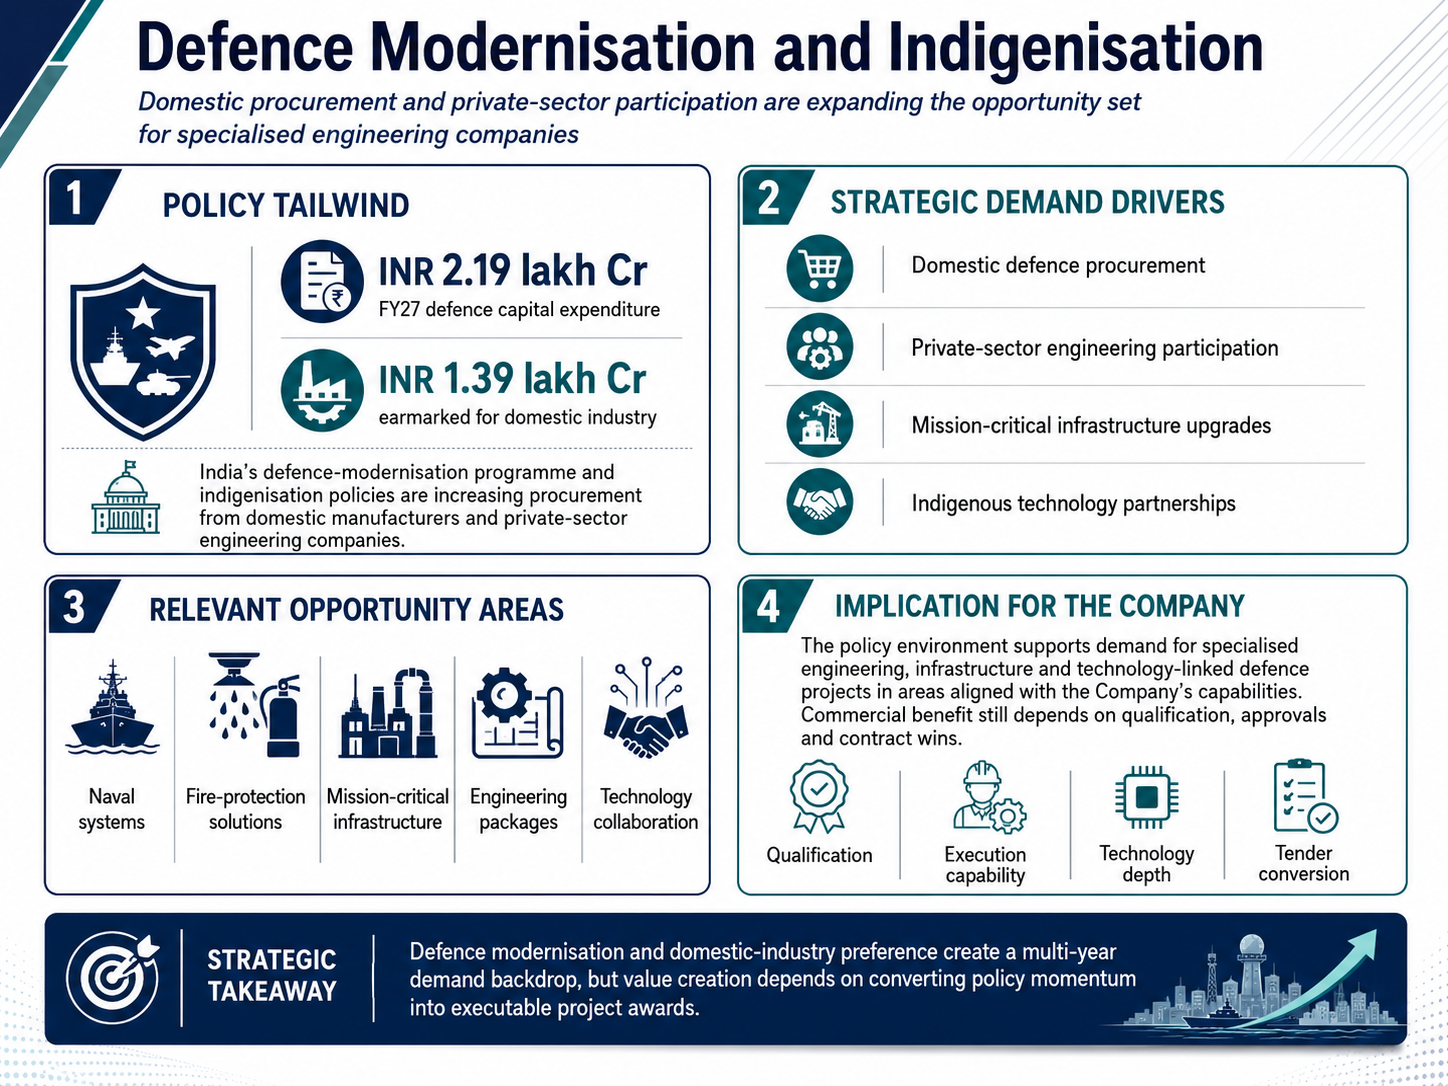
India’s defence-modernisation programme and indigenisation policies are expanding procurement from domestic manufacturers and private-sector engineering companies
The FY27 defence budget provides INR 2.19 lakh Cr for capital expenditure, including INR 1.39 lakh Cr for domestic industry
This supports demand for mission-critical infrastructure, naval systems, fire-protection solutions and indigenous technology partnerships, areas relevant to the Company’s capabilities
Plant Life Extension and Safety Upgrades
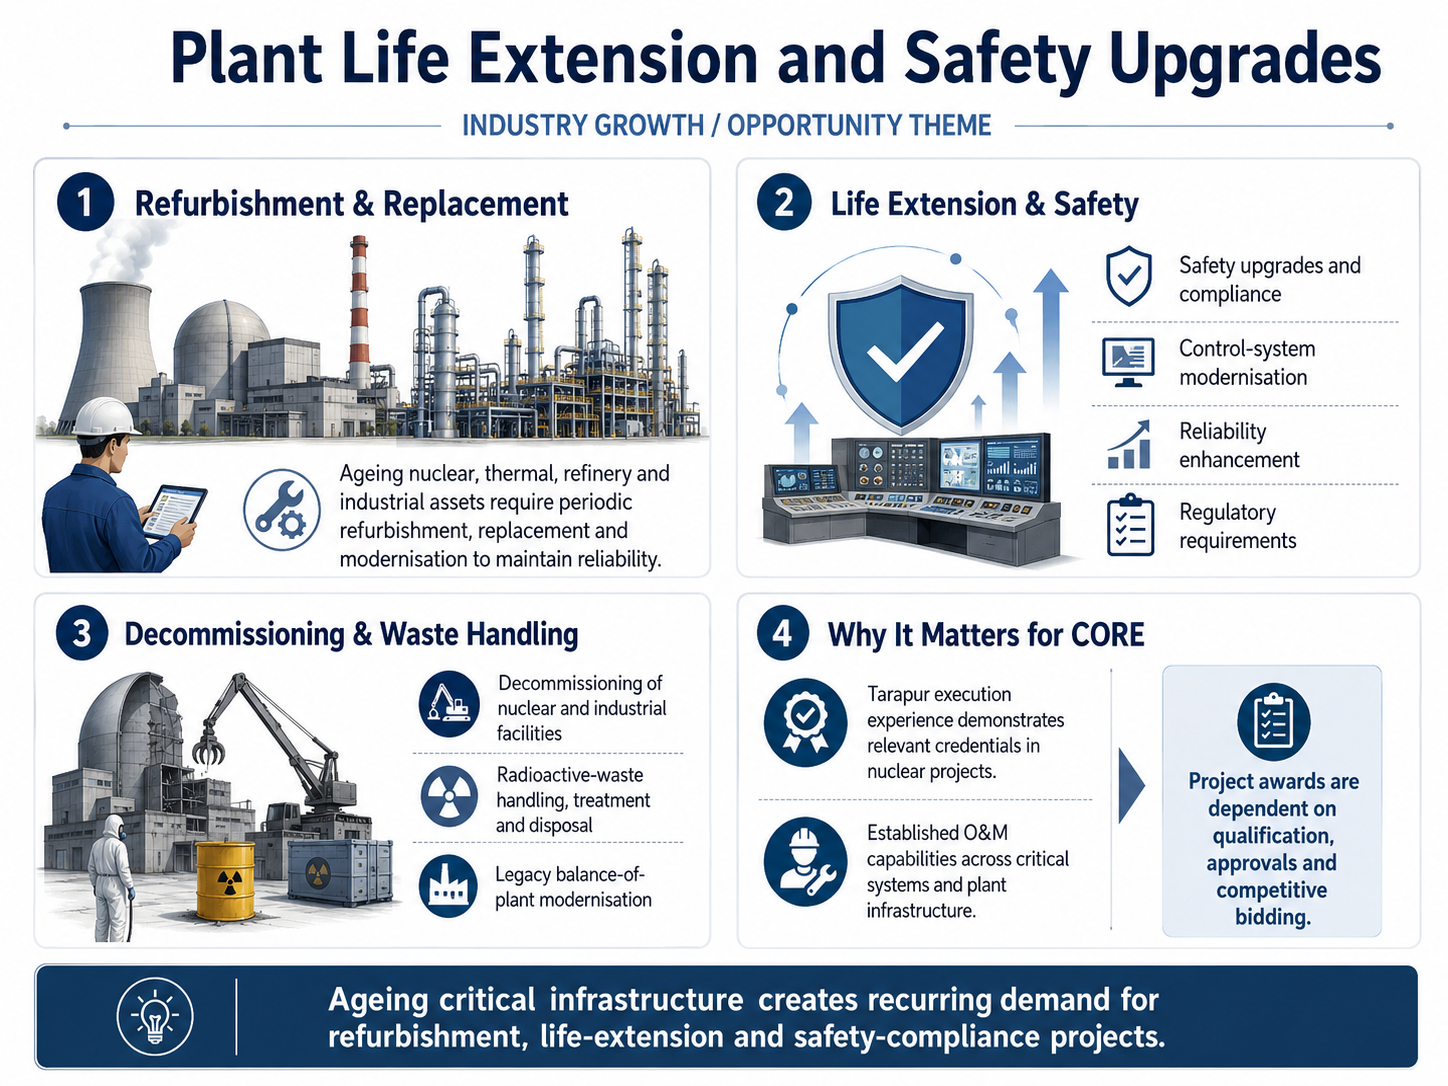
Ageing nuclear, thermal, refinery and industrial assets require periodic refurbishment, replacement, life extension and safety upgrades to maintain reliability and regulatory compliance
Demand also arises from decommissioning, radioactive-waste handling and modernisation of legacy balance-of-plant systems. The Company’s Tarapur execution experience and O&M capabilities provide relevant credentials, although project awards remain dependent on qualification, approvals and competitive bidding
Clean-Energy and Industrial Investment
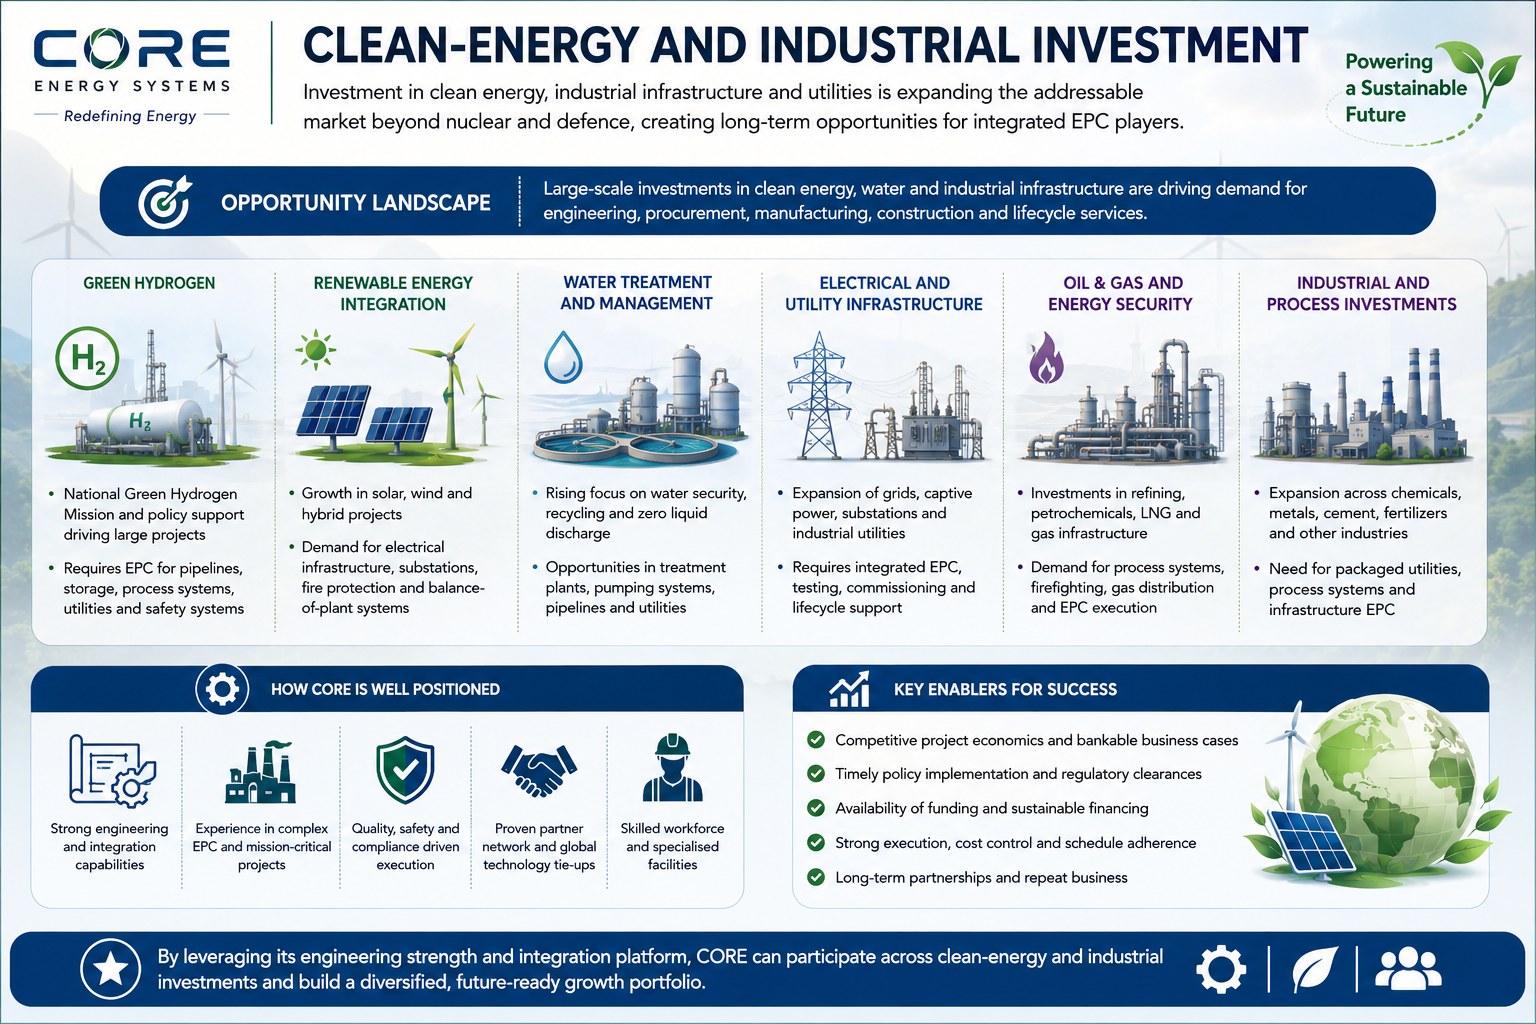
Investment in green hydrogen, renewable-energy integration, water-treatment systems, electrical infrastructure and oil-and-gas energy security expands the addressable market beyond nuclear and defence
These projects require packaged utilities, process systems, firefighting, gas distribution and EPC execution. The Company can use its engineering and integration platform across these adjacencies, but commercial success depends on project economics, funding availability and timely policy implementation
Government Policy Support
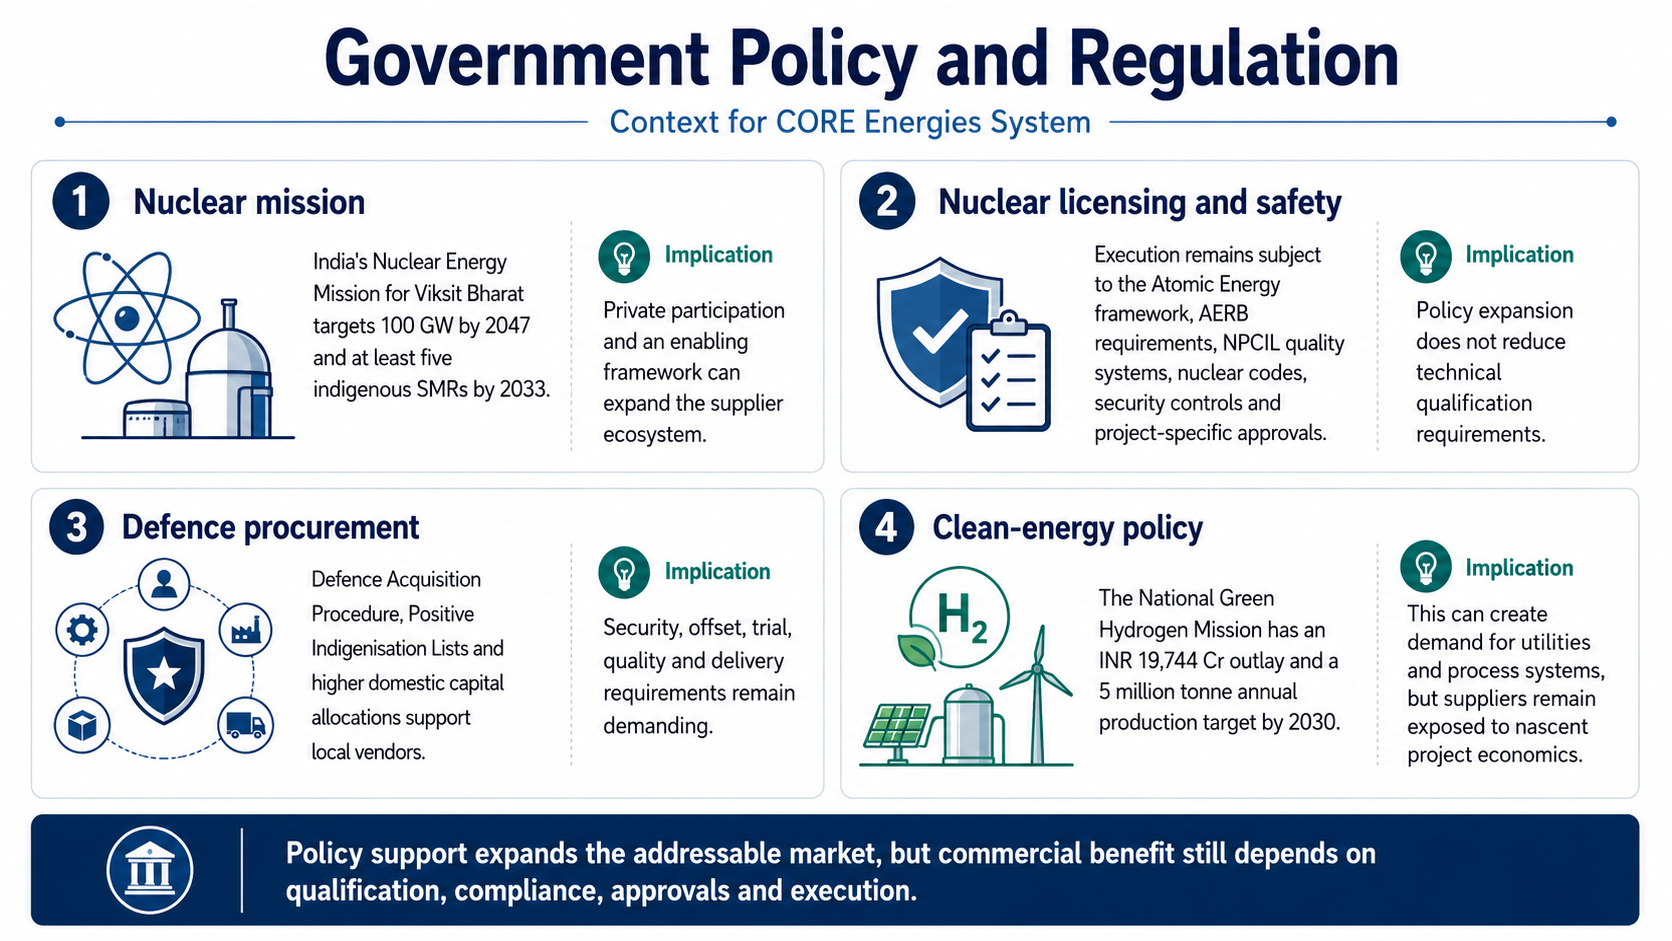
The Government of India launched the Nuclear Energy Mission for Viksit Bharat with a 100 GW 2047 objective and at least five indigenous SMRs targeted by 2033. Private participation and an enabling legal framework can expand the addressable supplier ecosystem
Work remains subject to the Atomic Energy framework, AERB requirements, NPCIL quality systems, nuclear codes, security controls and project-specific approvals. Policy expansion does not reduce technical qualification requirements
Defence Acquisition Procedure, Positive Indigenisation Lists and higher domestic-capital allocations support local vendors, while security, offset, trial, quality and delivery requirements remain demanding
The National Green Hydrogen Mission has an INR 19,744 Cr outlay and a 5 million tonne annual production target by 2030, creating potential demand for utilities and process systems but also exposing suppliers to nascent project economics
- Overview
- Business
- Financial Highlights
- Industry Overview
- Documentation
Get the Preqt App and keep in touch around the clock!
 Monitor your investments in real-time.
- Receive tailored deal suggestions.
- Get real-time updates and alerts.
