

Core4 Engineers
Integrated Engineering ExcellenceEngineering Infrastructure Forward
IPO Summary (PreQT)
Core4 Engineers Limited is a Mysuru-based engineering, procurement, construction and commissioning contractor focused on railway electrification, water infrastructure, transmission and distribution, and SCADA automation. Its consolidated FY25 revenue stood at INR 34.2 Cr, EBITDA at INR 6.8 Cr and PAT at INR 3.8 Cr. The larger near-term execution pipeline is apparent in six-month revenue of INR 47.1 Cr to September 2025, but this period must not be treated as a complete FY26 result. Revenue growth is backed by more infrastructure work and an order book of INR 111.5 Cr at the DRHP filing date. The key weakness is cash conversion: receivables expanded to INR 36.2 Cr and cash used in operations was INR 8.2 Cr during FY25. A post-issue equity value of INR 192.4 Cr represents 50.5x FY25 reported PAT, a demanding valuation for a working-capital-intensive SME contractor.
IPO Review Rating
Above Avg
MainboardPowering India’s Growth Through Integrated EPCC and Infrastructure Solutions
The company has demonstrated strong improvement in profitability, with EBITDA margin increasing to 20.0% in FY25, PAT margin reaching 11.2%, and RoNW remaining healthy. H1 FY26 performance also indicates strong execution momentum, supported by an order book of approximately INR 109.6 Cr. The 100.0% fresh-issue structure is another positive, as proceeds are being directed primarily toward working capital and expansion rather than shareholder exits. Promoters continue to retain substantial ownership post issue, and no promoter shares are pledged.
However, the key concern is the quality of cash generation and concentration risk. Operating cash flow remained negative at INR 13.2 Cr in FY24, INR 8.2 Cr in FY25 and INR 2.8 Cr in H1 FY26, indicating substantial working-capital absorption despite reported profits. Customer concentration is also particularly high, with one customer contributing 67.2% of H1 FY26 revenue, while Karnataka accounted for 88.8% of revenue during the same period. Valuation provides additional reason for caution. At the upper price band of INR 93, Core4 is valued at approximately 11.8x annualised H1 FY26 EV/EBITDA, compared with approximately 6.0x for K2 Infragen, implying a substantial premium. Although Core4 has stronger margins and return ratios, the premium appears demanding considering its smaller scale, negative operating cash flows, geographic concentration and customer dependence.
Overall, Core4 has good operating fundamentals, attractive infrastructure-sector exposure, strong margins and healthy return ratios, but the current valuation and business concentration reduce the margin of safety.
PARAMETER
WEIGHT
SCORE
KEY FACTORS
Financial Performance
40.0%
4.0/5
Profitability is impressive, but earnings quality is materially weaker than the headline PAT growth suggests because cash flow remains negative and working capital intensity is high
Show more
Detailed Analysis
Revenue increased from INR 13.1 Cr in FY23 to INR 33.5 Cr in FY24 and INR 34.2 Cr in FY25. H1 FY26 revenue was already INR 47.1 Cr, although the six-month number should not be directly annualised without caution
EBITDA margin improved consistently from 11.7% in FY23 to 15.2% in FY24 and 20.0% in FY25. H1 FY26 margin remained strong at 18.7%
PAT margin improved from 6.4% to 8.6% to 11.2% between FY23 and FY25, and reached 12.9% in H1 FY26
Debt/Equity increased to 2.6x in FY24 but improved sharply to 1.0x in FY25 and 0.9x by September 2025
FY25 ROE was 30.3%, with strong historical returns. H1 FY26 ROE was 55.7%, although this is not directly comparable with a full year
This is the biggest financial concern. OCF was negative INR 13.2 Cr in FY24, negative INR 8.2 Cr in FY25 and negative INR 2.8 Cr in H1 FY26
FY25 top 10 customers contributed 69.5% of revenue. In H1 FY26, one customer alone contributed 67.2%, while the top 10 contributed 90.1%
Industry
15.0%
3.0/5
Core4 operates across structurally attractive infrastructure segments including railway EPC, transmission and distribution, water treatment and automation. Strong government infrastructure spending supports growth, although high Karnataka concentration, tender dependence and the company's relatively small scale remain key constraints
Show more
Detailed Analysis
Core4 operates across railway EPC, T&D, water infrastructure, electrical panels and SCADA, most of which have high-single-digit to low-double-digit forecast growth
Infrastructure EPC is mature, but railway modernisation, renewable-energy evacuation, water infrastructure and automation remain in structural expansion phases
Government projects, tender qualification, project approvals and customer certification expose the company to execution and payment-cycle risks
Management
15.0%
3.0/5
Core4 has an experienced promoter-led management team, no promoter pledge and meaningful post-IPO promoter ownership. However, limited Board independence, historical audit modifications, related-party dealings and certain tax and compliance matters prevent the governance profile from being considered particularly strong.
Show more
Detailed Analysis
MD Abhinandan has around 11 years of EPC, rail, SCADA and T&D experience. WTD Mahadevappa Tejus has over nine years of project execution and procurement experience
2 of 6 Directors are independent, or 33.3%. This satisfies the applicable structure but is not exceptionally strong
No promoter shares are pledged. Litigation amounts are not large relative to the company, although historical tax cases, RoC filing delays and previous audit modifications merit attention
Several promoter, JV and promoter-linked transactions exist, including loans, advances and purchases. The quantum is not alarming but requires monitoring
Valuation
20.0%
3.0/5
Core4's valuation appears demanding relative to K2 Infragen despite stronger margins and return ratios. The premium may be partly justified by growth and profitability, but negative operating cash flow, customer concentration and working-capital intensity reduce comfort at the upper price band.
Show more
Detailed Analysis
On reported FY26 EPS, issue price implies 11.1x pre-issue P/E. Adjusting for the additional shares being issued, the same earnings translate into approximately 15.6x post-issue P/E, substantially above K2 Infragen's 4.0x
INR 93 is approximately 4.4x FY26 pre-issue NAV. Pro forma book value improves materially because the issue is entirely fresh capital, reducing the implied post-money P/B substantially
FY26 RoNW of 39.8% is very strong and materially higher than K2 Infragen's 14.8%
At the upper price band, Core4's post-issue enterprise value is approximately INR 208.5 Cr. Against annualised H1 FY26 EBITDA of approximately INR 17.6 Cr, the company is valued at 11.8x EV/EBITDA, versus approximately 6.0x for K2 Infragen, implying a premium of around 95.8%
Merchant Banker Track Record
10.0%
5.0/5
The ability to generate subscription has been reasonable, but post-listing performance of recent issues is a clear negative
Show more
Detailed Analysis
Only 50.0% listed positively, while 0.0% of IPOs with available 30-day data remained above issue price. Average 30-day return was -16.1%, worsening to -31.6% at 90 days
Median overall subscription was 23.5x and median QIB subscription was 19.7x. Demand-generation capability is therefore reasonably good, although performance varies sharply between issues
Two of four IPOs listed above issue price, but none of the three with available 30-day data remained positive. Sustained aftermarket performance is therefore weak
TOTAL
100%
3.6/5
Weighted Composite Score
Issue Price
₹88.0 to ₹93.0
As of 24 Oct 2026
GMP
₹0.0
As of 24 Oct 2026
Estimated Gain / Loss
0.0%
Lot Size
1,200.0 Shares
Grey Market Premium (GMPs) are shared for knowledge purpose only. PrEqt doesn’t promote or execute the trades.
| Issue Size (in Cr) | |
|---|---|
| Overall | ₹54.8 Cr |
| Fresh Issue | ₹54.8 Cr |
| Offer for Sale | ₹0.0 Cr |
Minimum Investment
₹2,23,200.0 / 1,200 shares

Merchant Banker
Socradamus Capital Pvt.Ltd.
Socradamus Capital Pvt.Ltd.
IPO Document
Offer Start Date
Offer End Date
Valuation
Revenue (FY'25_
PAT (FY'25)
Issue Size (in Cr)
Face Value
₹ 10.0Offer Price
₹ 93.0Lot Size
1,200.0 sharesSale Type
Fresh capital onlyPAT (FY'25)
₹ 3.8 CrPAT Margin (FY'25)
11.2 %P/E Multiple
15.6xEBITDA (FY'25)
₹ 6.8 CrCAGR Growth 2Y
61.6 %ROE (FY'25)
30.3 %ROCE (FY'25)
24.0 %Price to Book Value
2.2xDebt/Equity (FY'25)
1.0xCompany Website
core4engineers.comExplore new deals
Overview
Fund Allocation
Total: ₹0 CrSource:Company DRHP
Timeline
IPO Open Date
To Be Announced
IPO Close Date
To Be Announced
Tentative Allotment
To Be Announced
Initiation of Refunds
To Be Announced
Credit of Shares to Demat
To Be Announced
Tentative Listing Date
To Be Announced
Business
Business Model
Geographical Presence
Sales Channel
Key Risk Factors
Financial Highlights
Income Statement
Revenue growth with EBITDA and PAT margins
| Financial Metric | FY 2023 | FY 2024 | FY 2025 |
|---|---|---|---|
| Revenue (₹ Cr) | 13.1 | 33.5 | 34.2 |
| Growth (%) | - | 155.7% | 2.1% |
| EBITDA (₹ Cr) | 1.5 | 5.1 | 6.8 |
| EBITDA Margin (%) | 11.7% | 15.2% | 20.0% |
| PAT (₹ Cr) | 0.8 | 2.9 | 3.8 |
| PAT Margin (%) | 6.4% | 6.4% | 11.2% |
OBSERVATIONS & INSIGHTS
Revenue increased from INR 13.1 Cr in FY23 to INR 33.5 Cr in FY24 as the company executed more EPC projects and billed a greater volume of contracts. Revenue rose only 2.1% to INR 34.2 Cr in FY25, with comparable annual contract income remaining broadly flat. Scope changes and contract timing rather than uniform market expansion explain this pattern. FY23 also has a different reporting perimeter
EBITDA rose from INR 1.5 Cr in FY23 to INR 5.1 Cr in FY24 and INR 6.8 Cr in FY25. FY24 benefited from greater project throughput, while FY25 margins improved from 15.2% to 20.0% due to lower material consumption and a changed execution mix, partially offset by subcontracting, employee and administrative expenses. A margin improvement is not equivalent to cash realisation
PBT increased from INR 4.1 Cr in FY24 to INR 5.4 Cr in FY25 because the improved operating surplus exceeded incremental finance and overhead costs. PAT rose from INR 2.9 Cr to INR 3.8 Cr after higher current tax. PAT margin expanded to 11.2% despite only modest revenue growth, so the sustainability of contract mix and collections is critical
Balance Sheet
| Financial Metric | FY 2023 | FY 2024 | FY 2025 |
|---|---|---|---|
| Net Worth | ₹ 3.5 Cr | ₹ 6.4 Cr | ₹ 18.7 Cr |
| Total Assets | ₹ 14.6 Cr | ₹ 32.0 Cr | ₹ 68.1 Cr |
| Total Borrowing | ₹ 4.4 Cr | ₹ 16.8 Cr | ₹ 18.6 Cr |
OBSERVATIONS & INSIGHTS
Shareholders funds increased from INR 6.4 Cr in FY24 to INR 18.7 Cr in FY25, reflecting the private share issue, profit retention and capital structure changes. Approximately INR 8.5 Cr flowed through financing activities from issue of equity in FY25
Assets rose from INR 32.0 Cr in FY24 to INR 68.1 Cr in FY25, principally because trade receivables increased by INR 28.6 Cr and project WIP increased by INR 4.3 Cr. This expansion is not equivalent to investment in productive fixed assets
Total borrowings increased from INR 16.8 Cr in FY24 to INR 18.6 Cr in FY25. Long-term borrowing rose through unsecured related-party funding and NBFC loans, while utilisation of short-term overdraft facilities eased slightly. Refinancing and related-party dependence remain relevant
Cash Flow
| Financial Metric | FY 2023 | FY 2024 | FY 2025 |
|---|---|---|---|
CFO in Cr Cash generated from core business operations. | +2.5 Cr | -13.2 Cr | -8.2 Cr |
CFI in Cr Cash used in / generated from investing activities. | +0.0 Cr | -1.8 Cr | +0.0 Cr |
CFF in Cr Cash from / used in financing activities. | +0.5 Cr | +12.0 Cr | +8.4 Cr |
Working Capital
| Efficiency Metric | FY 2023 | FY 2024 | FY 2025 |
|---|---|---|---|
Debtor Days Average number of days taken to collect customer payments. | - | - | - |
Creditor Days Average time taken to pay suppliers and vendors. | - | - | - |
Inventory Days Average number of days inventory remains unsold. | - | - | - |
CCC (Cash Conversion Cycle) (Debtor Days + Inventory Days - Creditor Days) | - | - | - |
Financial Ratios
Measures the company’s leverage relative to shareholder equity.
OBSERVATIONS & INSIGHTS
ROE increased from 26.5% in FY23 to 57.8% in FY24 as earnings expanded substantially before an equivalent expansion in average equity. It declined to 30.3% in FY25 despite higher PAT because an equity fundraise and retained profits sharply expanded the average equity denominator
ROCE increased from 21.5% in FY23 to 33.4% in FY24 as operating profit improved, then declined to 24.0% in FY25 because the growth in capital employed outpaced additional operating returns. Increased working capital tied to receivables compounded this decline
Debt to equity rose from 1.2x to 2.6x in FY24 when bank letters of credit were used to finance a step-up in project execution. It declined to 1.0x in FY25 mainly as equity rose through the capital issue and profits, rather than because total borrowing disappeared
Interest coverage was broadly stable at approximately 3.8x to 3.9x across FY23 to FY25. Although absolute earnings increased, finance costs grew substantially with borrowings. This highlights the sensitivity of financing headroom to project delays and slower customer receipts
Current ratio rose to approximately 1.5x in FY25, but it was supported by large receivable and WIP balances rather than unrestricted cash. ROA declined from 12.4% in FY24 to 7.6% in FY25 because the asset base, chiefly receivables and WIP, expanded much faster than profit
Industry Overview
Industry Drivers
Railway Electrification and Station Infrastructure
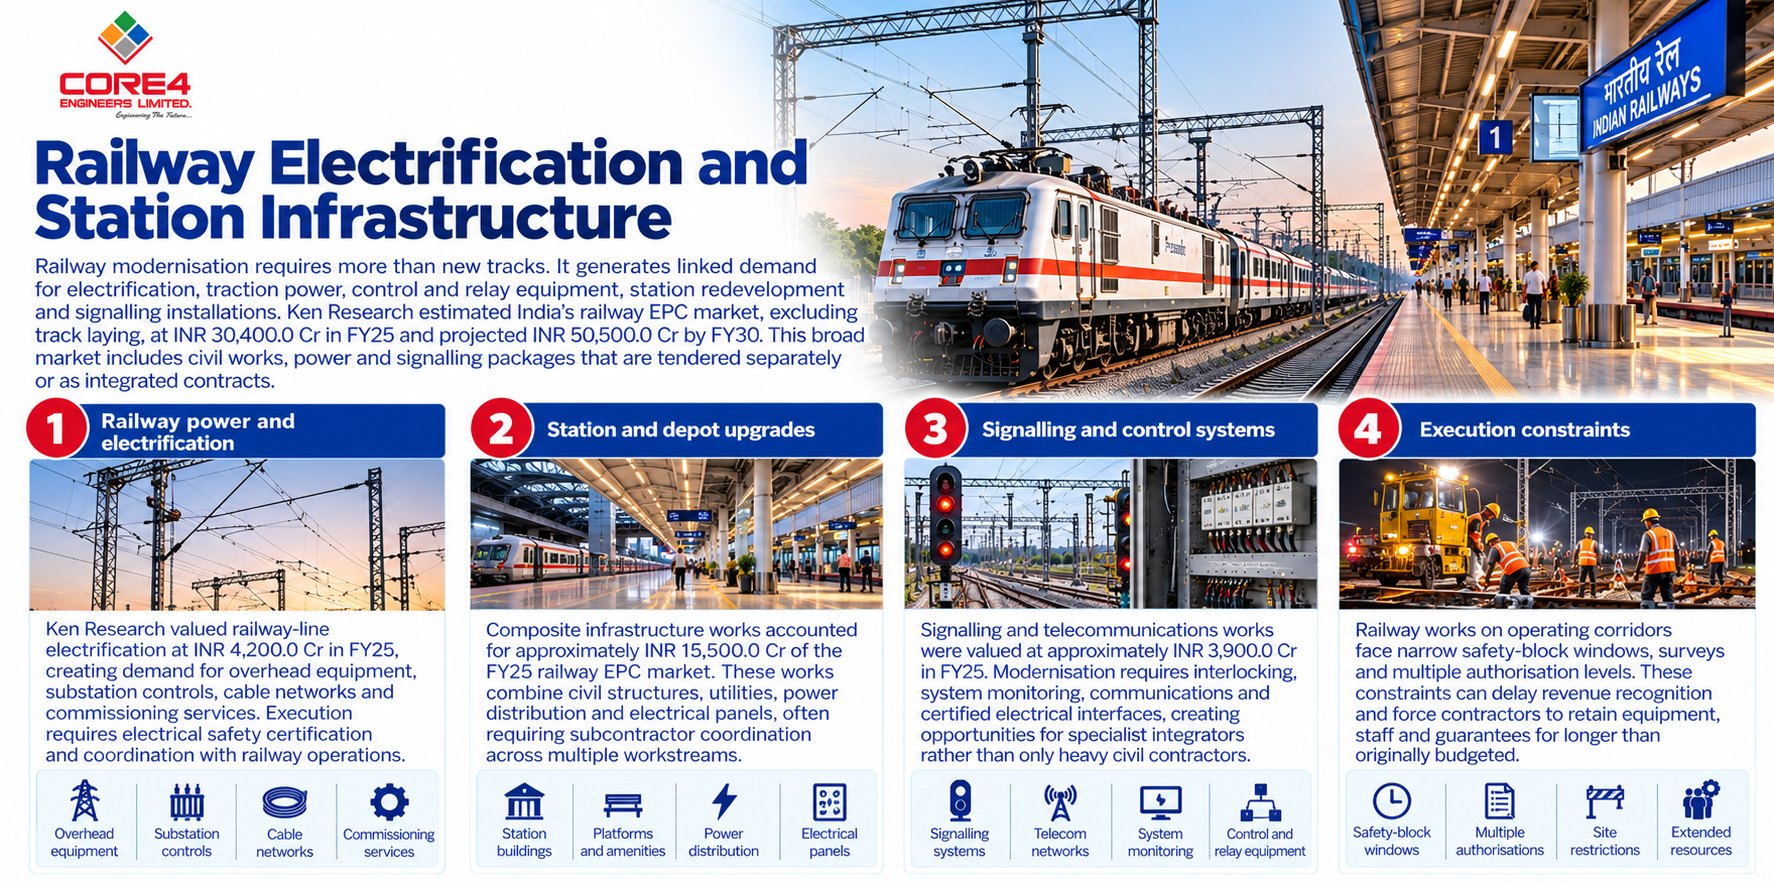
Railway modernisation requires more than new tracks. It generates linked demand for electrification, traction power, control and relay equipment, station redevelopment and signalling installations. Ken Research estimated India’s railway EPC market, excluding track laying, at INR 30,400.0 Cr in FY25 and projected INR 50,500.0 Cr by FY30. This broad market includes civil works, power and signalling packages that are tendered separately or as integrated contracts. Small and mid-sized EPC contractors can participate in specialist packages, although revenues depend on project awards, site access, certification and their technical eligibility rather than the headline market projection.
The key drivers are:
Railway power and electrification: Ken Research valued railway-line electrification at INR 4,200.0 Cr in FY25, creating demand for overhead equipment, substation controls, cable networks and commissioning services. Execution requires electrical safety certification and coordination with railway operations
Station and depot upgrades: Composite infrastructure works accounted for approximately INR 15,500.0 Cr of the FY25 railway EPC market. These works combine civil structures, utilities, power distribution and electrical panels, often requiring subcontractor coordination across multiple workstreams
Signalling and control systems: Signalling and telecommunications works were valued at approximately INR 3,900.0 Cr in FY25. Modernisation requires interlocking, system monitoring, communications and certified electrical interfaces, creating opportunities for specialist integrators rather than only heavy civil contractors
Execution constraints: Railway works on operating corridors face narrow safety-block windows, surveys and multiple authorisation levels. These constraints can delay revenue recognition and force contractors to retain equipment, staff and guarantees for longer than originally budgeted
Water Supply, Wastewater and Urban Treatment Infrastructure
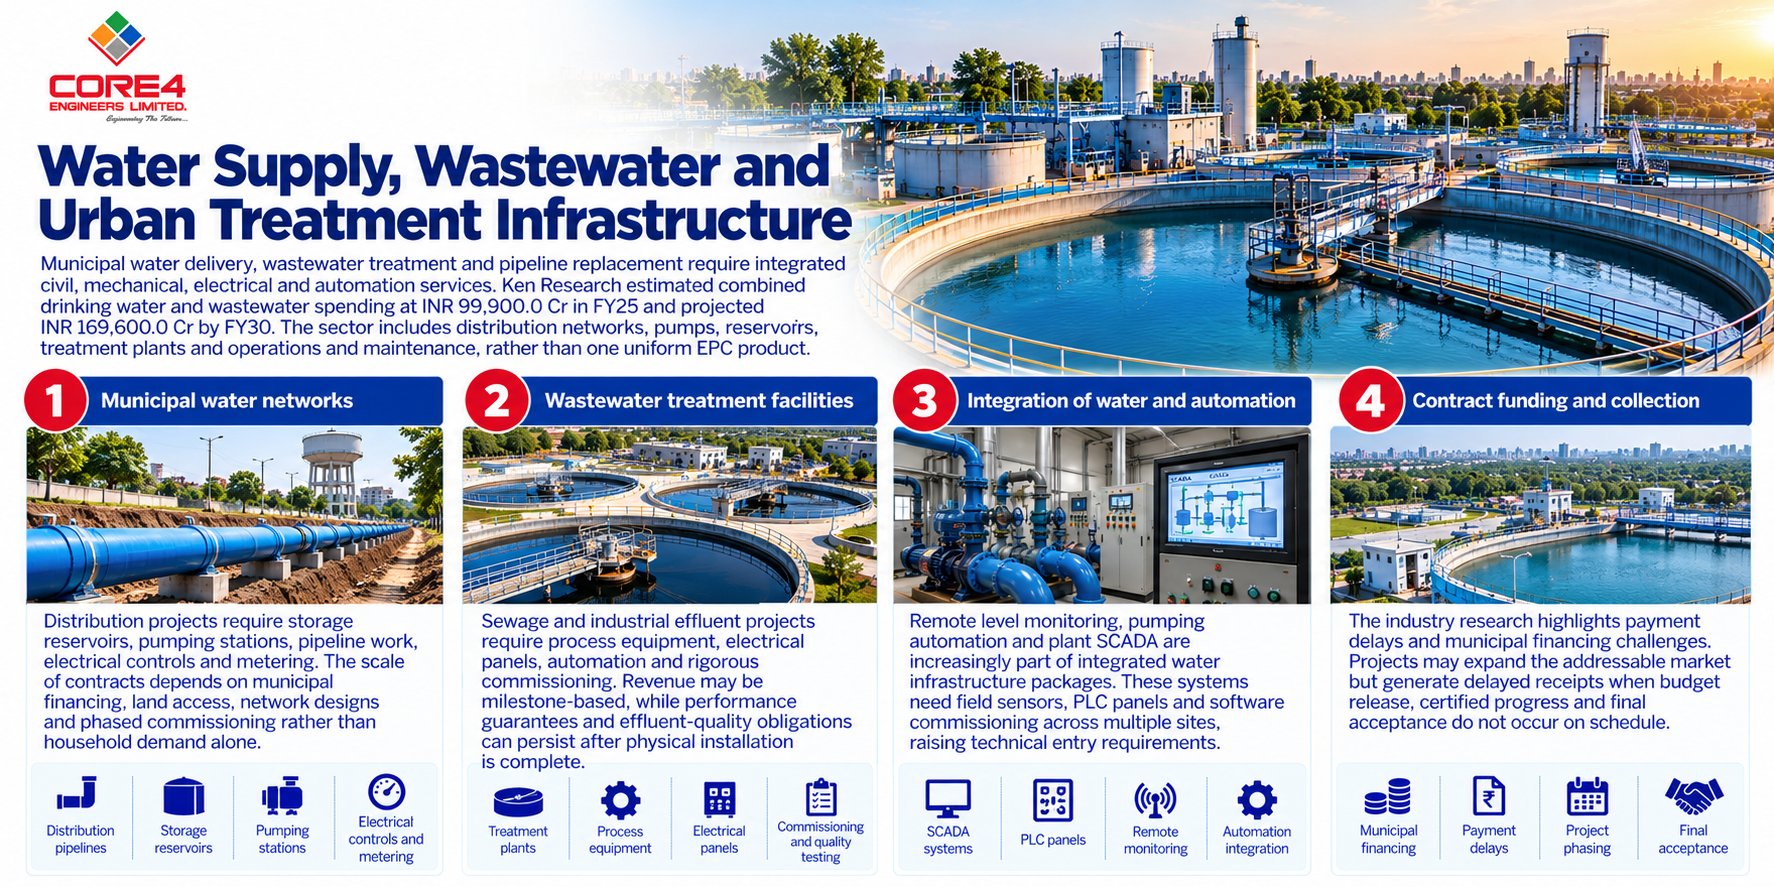
Municipal water delivery, wastewater treatment and pipeline replacement require integrated civil, mechanical, electrical and automation services. Ken Research estimated combined drinking water and wastewater spending at INR 99,900.0 Cr in FY25 and projected INR 169,600.0 Cr by FY30. The sector includes distribution networks, pumps, reservoirs, treatment plants and operations and maintenance, rather than one uniform EPC product. Demand is supported by the requirement to improve service reliability, reduce pollution and extend urban and rural access. Contractors capable of integrating pumping, instrumentation and SCADA can pursue specialised work packages, subject to tenders and reliable payment mechanisms.
The key drivers are:
Municipal water networks: Distribution projects require storage reservoirs, pumping stations, pipeline work, electrical controls and metering. The scale of contracts depends on municipal financing, land access, network designs and phased commissioning rather than household demand alone
Wastewater treatment facilities: Sewage and industrial effluent projects require process equipment, electrical panels, automation and rigorous commissioning. Revenue may be milestone-based, while performance guarantees and effluent-quality obligations can persist after physical installation is complete
Integration of water and automation: Remote level monitoring, pumping automation and plant SCADA are increasingly part of integrated water infrastructure packages. These systems need field sensors, PLC panels and software commissioning across multiple sites, raising technical entry requirements
Contract funding and collection: The industry research highlights payment delays and municipal financing challenges. Projects may expand the addressable market but generate delayed receipts when budget release, certified progress and final acceptance do not occur on schedule
Power Distribution Modernisation and SCADA Automation
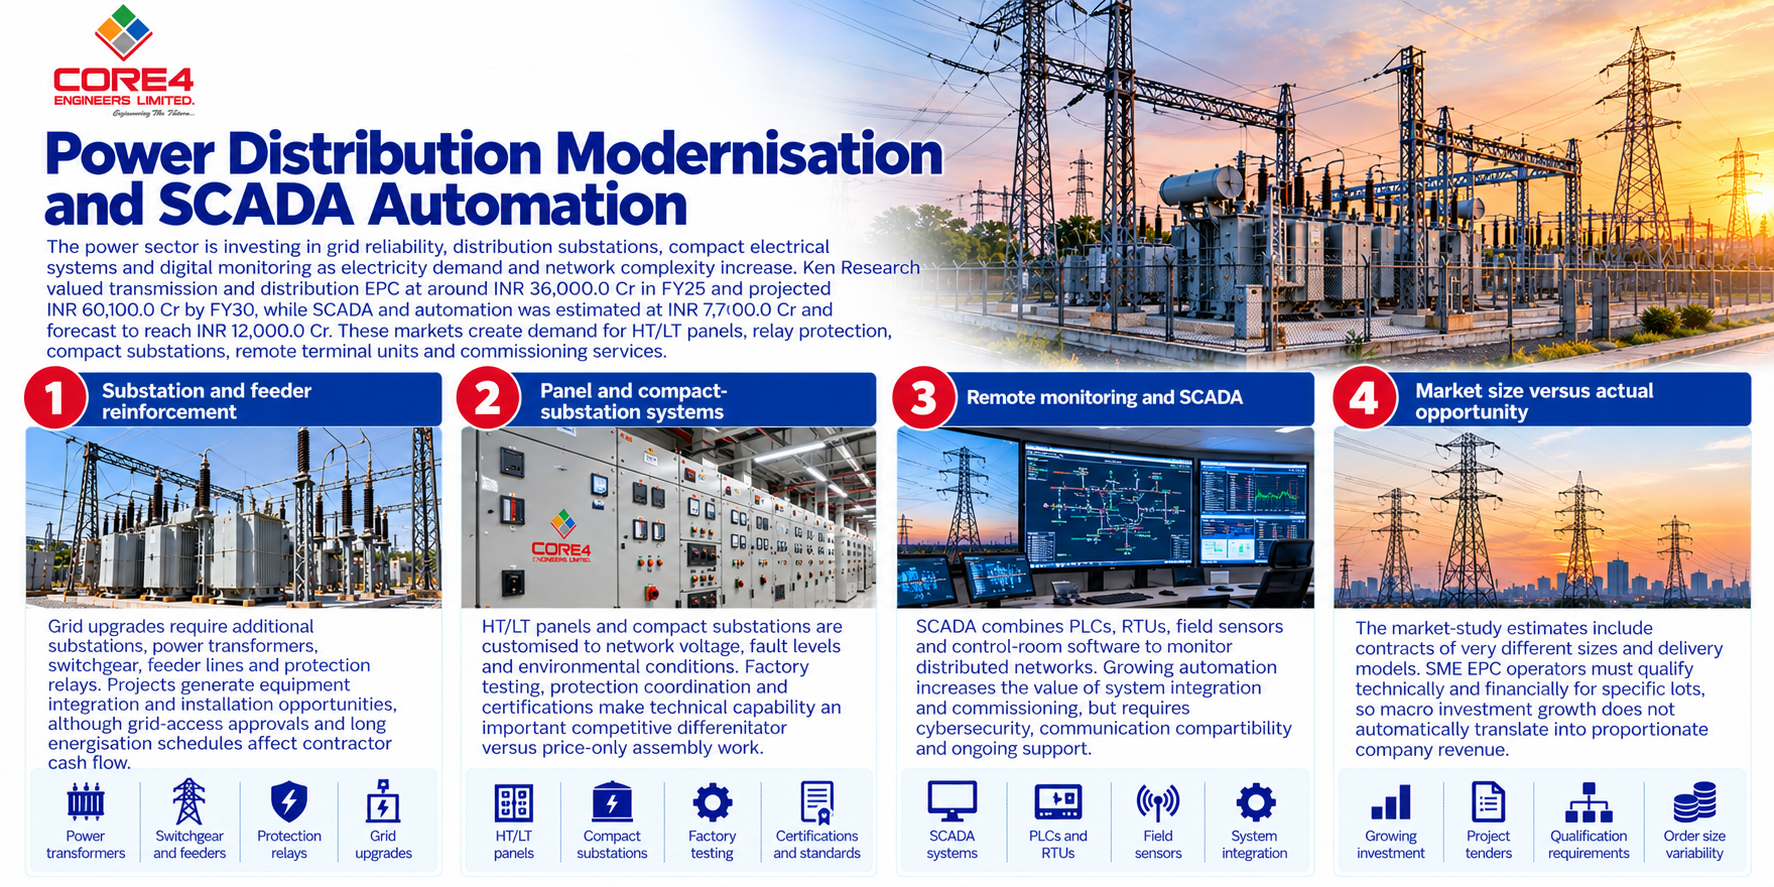
The power sector is investing in grid reliability, distribution substations, compact electrical systems and digital monitoring as electricity demand and network complexity increase. Ken Research valued transmission and distribution EPC at around INR 36,000.0 Cr in FY25 and projected INR 60,100.0 Cr by FY30, while SCADA and automation was estimated at INR 7,700.0 Cr and forecast to reach INR 12,000.0 Cr. These markets create demand for HT/LT panels, relay protection, compact substations, remote terminal units and commissioning services. Growth is linked to approved utility investments and project tenders, while material costs and technical standards shape attainable margins.
The key drivers are:
Substation and feeder reinforcement: Grid upgrades require additional substations, power transformers, switchgear, feeder lines and protection relays. Projects generate equipment integration and installation opportunities, although grid-access approvals and long energisation schedules affect contractor cash flow
Panel and compact-substation systems: HT/LT panels and compact substations are customised to network voltage, fault levels and environmental conditions. Factory testing, protection coordination and certifications make technical capability an important competitive differentiator versus price-only assembly work
Remote monitoring and SCADA: SCADA combines PLCs, RTUs, field sensors and control-room software to monitor distributed networks. Growing automation increases the value of system integration and commissioning, but requires cybersecurity, communication compatibility and ongoing support
Market size versus actual opportunity: The market-study estimates include contracts of very different sizes and delivery models. SME EPC operators must qualify technically and financially for specific lots, so macro investment growth does not automatically translate into proportionate company revenue
Risks in the Industry
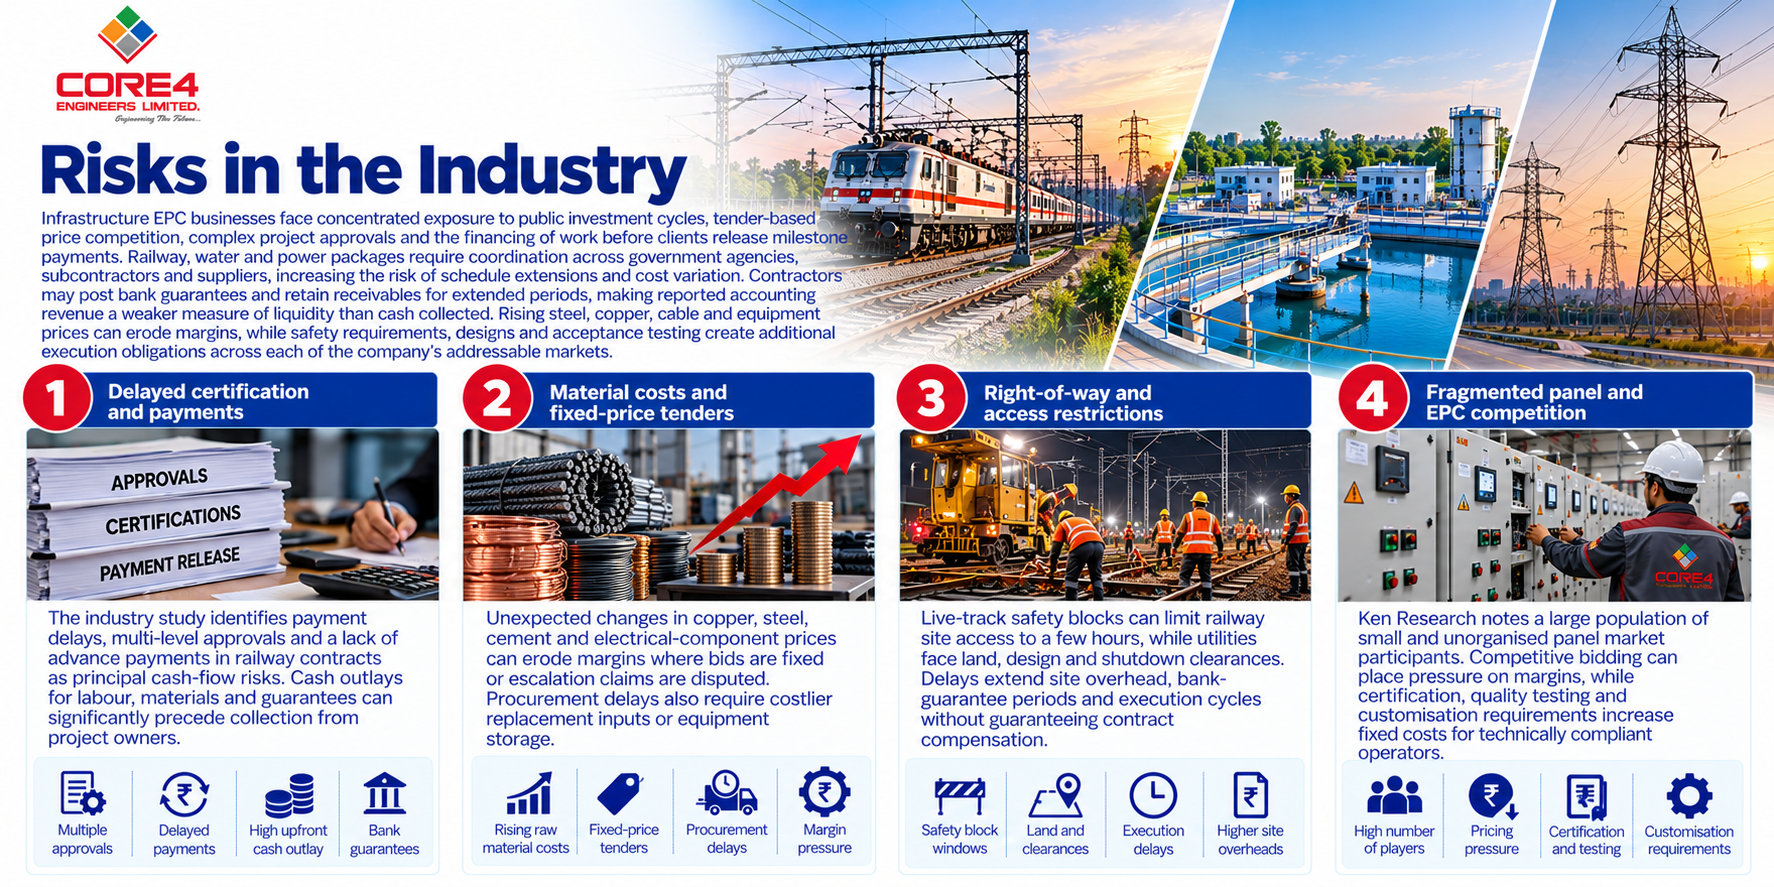
Infrastructure EPC businesses face concentrated exposure to public investment cycles, tender-based price competition, complex project approvals and the financing of work before clients release milestone payments. Railway, water and power packages require coordination across government agencies, subcontractors and suppliers, increasing the risk of schedule extensions and cost variation. Contractors may post bank guarantees and retain receivables for extended periods, making reported accounting revenue a weaker measure of liquidity than cash collected. Rising steel, copper, cable and equipment prices can erode margins, while safety requirements, designs and acceptance testing create additional execution obligations across each of the company’s addressable markets.
The key risks are:
Delayed certification and payments: The industry study identifies payment delays, multi-level approvals and a lack of advance payments in railway contracts as principal cash-flow risks. Cash outlays for labour, materials and guarantees can significantly precede collection from project owners
Material costs and fixed-price tenders: Unexpected changes in copper, steel, cement and electrical-component prices can erode margins where bids are fixed or escalation claims are disputed. Procurement delays also require costlier replacement inputs or equipment storage
Right-of-way and access restrictions: Live-track safety blocks can limit railway site access to a few hours, while utilities face land, design and shutdown clearances. Delays extend site overhead, bank-guarantee periods and execution cycles without guaranteeing contract compensation
Fragmented panel and EPC competition: Ken Research notes a large population of small and unorganised panel market participants. Competitive bidding can place pressure on margins, while certification, quality testing and customisation requirements increase fixed costs for technically compliant operators
Government Policy Support
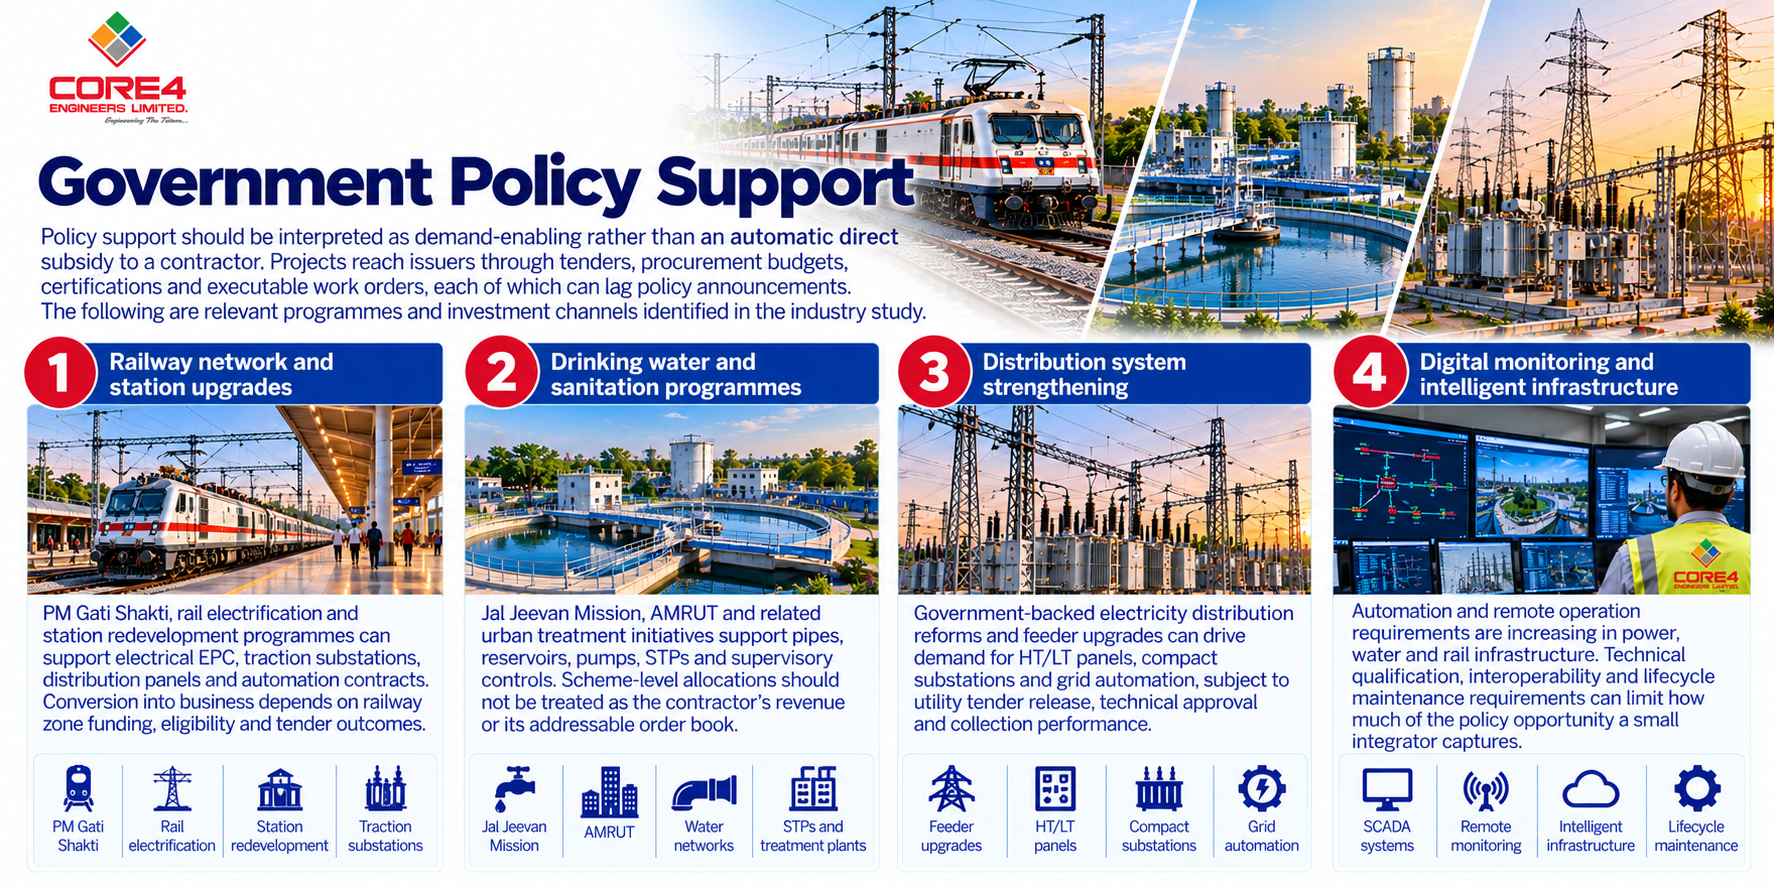
Policy support should be interpreted as demand-enabling rather than an automatic direct subsidy to a contractor. Projects reach issuers through tenders, procurement budgets, certifications and executable work orders, each of which can lag policy announcements. The following are relevant programmes and investment channels identified in the industry study.
The key policies are:
Railway network and station upgrades: PM Gati Shakti, rail electrification and station redevelopment programmes can support electrical EPC, traction substations, distribution panels and automation contracts. Conversion into business depends on railway zone funding, eligibility and tender outcomes
Drinking water and sanitation programmes: Jal Jeevan Mission, AMRUT and related urban treatment initiatives support pipes, reservoirs, pumps, STPs and supervisory controls. Scheme-level allocations should not be treated as the contractor’s revenue or its addressable order book
Distribution system strengthening: Government-backed electricity distribution reforms and feeder upgrades can drive demand for HT/LT panels, compact substations and grid automation, subject to utility tender release, technical approval and collection performance
Digital monitoring and intelligent infrastructure: Automation and remote operation requirements are increasing in power, water and rail infrastructure. Technical qualification, interoperability and lifecycle maintenance requirements can limit how much of the policy opportunity a small integrator captures
Fundraise/Future Plans
Shareholding
Pre-issue shareholding
Promoter Holding 0.0%
Post-Issue Shareholding
Promoter Holding 0.0%
Category
Pre-Issue%Post-Issue%
Promoters
Agrahara Chamaraje Gowda Abhinandan
50.0%35.7%
Hosahalli Appagigowda Savitha
29.8%21.3%
Mahadevappa Tejus
1.4%1.0%
Anala
0.9%0.7%
Total Promoter Holding
82.1%58.7%
Additional Shareholders
Other Shareholders
17.9%41.3%
Total Additional Holding
17.9%41.3%
Total Shareholding
100.0%100.0%
- Overview
- Business
- Financial Highlights
- Industry Overview
- Fundraise/Future Plans
- Documentation
Get the Preqt App and keep in touch around the clock!
 Monitor your investments in real-time.
- Receive tailored deal suggestions.
- Get real-time updates and alerts.