


Cosmic PV Power Limited
Powering Solar ProgressEngineering Clean Energy
IPO Review and Rating
Considerable
DRHP approvedOverall Recommendation
FY23-FY25 revenue CAGR of 123.8%, PAT CAGR of 254.8%, FY25 EBITDA margin of 15.2%, year-end ROE of approximately 33.9%, positive operating cash flow of INR 27.1 Cr and the improvement in D/E from 2.9x to 0.8x are all substantial positives. Module capacity has increased to approximately 3.0 GW, the Company has adopted TOPCon technology, CARE reported an order book of approximately INR 1,622.0 Cr, and India continues to add solar capacity at record rates. Governance has also been significantly professionalised ahead of the IPO, with independent directors now representing 50.0% of the Board
PARAMETER
WEIGHT
SCORE
KEY FACTORS
Financial Performance
25.0%
4.2/5
Exceptional growth, margin expansion, strong cash conversion and improving leverage
Show more
Detailed Analysis
FY25 revenue increased 144.7% to INR 241.5 Cr, while FY23-FY25 CAGR was an exceptional 123.8%
EBITDA increased to INR 36.8 Cr, with margin expanding from 10.7% to 15.2%
PAT increased to INR 23.7 Cr, while PAT margin expanded strongly from 6.3% to 9.8%
Gross debt increased to INR 52.7 Cr, but the equity raise reduced D/E sharply from 2.9x to 0.8x
FY25 PAT represents approximately 33.9% ROE on year-end equity, which is very strong despite the sizeable equity infusion
Industry
25.0%
3.7/5
Solar demand and government policy provide exceptional structural growth, but rapidly expanding manufacturing capacity creates significant pricing and margin risk
Show more
Detailed Analysis
India added a record 44.6 GW of solar capacity in FY26, almost double the previous year's addition
Domestic solar installations and manufacturing remain in a structural growth cycle driven by electrification and renewable targets
Domestic module capacity has expanded to approximately 172.0 GW, creating excess supply and significant pricing competition
ALMM, domestic-manufacturing policy, PLI and renewable-capacity targets provide meaningful structural support
Management
25.0%
3.0/5
Relevant promoter expertise, substantially strengthened independent governance and clean audit observations are positives
Show more
Detailed Analysis
Jenish Ghael and Shravan Gupta have approximately a decade or more of renewable-energy experience, providing relevant domain knowledge
The current eight-member Board includes four independent directors, giving 50.0% independent representation
Promoter shares are unpledged; audit disclosures show no material default, fraud or financially material litigation
RPTs are meaningful but not overwhelming, including group-company sales/purchases and promoter/director unsecured loans
Valuation Metrics
25.0%
1.7/5
Cosmic's operational growth is exceptional, but the current unlisted valuation is significantly richer than listed solar-module peers
Show more
Detailed Analysis
Cosmic's 67.4x P/E is approximately 179.8% above the peer median of 24.1x
The FY25 trailing proxy of 46.3x is approximately 219.5% above the peer median of 14.5x
At 20.4x book, Cosmic trades at an exceptionally large premium even to high-growth listed solar peers
TOTAL
100%
3.1/5
Weighted Composite Score
Per Share Price
₹199.0
As of 24 Oct 2026
Lot Size
1,000.0 Shares
Minimum Investment
₹1,99,000.0 / 1,000 shares
Market Cap. (₹ Cr)
Revenue FY’25
PAT FY’25
P/E Multiple
Face Value
₹ 10.0Lot Size
1,000.0 sharesPAT FY’25
₹ 23.7 CrPAT Margin (%)
9.8 %P/E Multiple
67.4xCAGR Growth 2Y
123.8 %ROE (FY’25)
57.8 %ROCE (FY’25)
38.3 %Price to Book Value ratio
20.4xDebt/Equity (FY’25)
0.8xMerchant banker appointed
✅ YesCompany Website
www.cosmicpvpower.comDisclaimer: Unlisted shares are unregulated & illiquid. This is NOT investment advice. Please do your own due diligence before investing.
Minimum Investment
₹1,99,000.0 / 1,000 sharesShares Lot 1000 X 1
Investment amount
₹1,99,000.0
Overview
Business
Products
Business Model
Geographical Presence
Sales Channel
Financial Highlights
Income Statement
Revenue growth with EBITDA and PAT margins
| Financial Metric | FY 2023 | FY 2024 | FY 2025 |
|---|---|---|---|
| Revenue (₹ Cr) | 48.2 | 98.7 | 241.5 |
| Growth (%) | 0.0% | 104.7% | 144.7% |
| EBITDA (₹ Cr) | 4.2 | 10.5 | 36.8 |
| EBITDA Margin (%) | 8.8% | 10.7% | 15.2% |
| PAT (₹ Cr) | 1.9 | 6.2 | 23.7 |
| PAT Margin (%) | 3.9% | 6.3% | 9.8% |
OBSERVATIONS & INSIGHTS
Revenue more than doubled in FY24 and increased another 144.7% in FY25, producing a two-year CAGR of 123.8% from INR 48.2 Cr to INR 241.5 Cr
EBITDA increased from INR 4.2 Cr in FY23 to INR 10.5 Cr in FY24 and INR 36.8 Cr in FY25, while EBITDA margin expanded from 8.8% to 15.2%
PAT rose from INR 1.9 Cr to INR 23.7 Cr over two years and PAT margin improved from 3.9% to 9.8%, showing stronger conversion of incremental revenue into earnings
Other income remained small relative to operating revenue in each statutory year, so the earnings expansion was predominantly driven by the core operating business rather than treasury or exceptional income
Balance Sheet
| Financial Metric | FY 2023 | FY 2024 | FY 2025 |
|---|---|---|---|
| EQUITY & LIABILITIES | ₹ 25.4 Cr | ₹ 68.9 Cr | ₹ 195.3 Cr |
| Net Worth | ₹ 3.7 Cr | ₹ 12.1 Cr | ₹ 69.8 Cr |
| Share Capital | ₹ 1.5 Cr | ₹ 1.6 Cr | ₹ 1.7 Cr |
| Reserves & Surplus | ₹ 2.2 Cr | ₹ 10.5 Cr | ₹ 68.1 Cr |
| Total Liabilities | ₹ 21.7 Cr | ₹ 56.8 Cr | ₹ 125.5 Cr |
| Current Liabilities | ₹ 13.8 Cr | ₹ 34.6 Cr | ₹ 85.0 Cr |
| Borrowings | ₹ 6.3 Cr | ₹ 12.5 Cr | ₹ 12.2 Cr |
| Trade Payables | ₹ 6.2 Cr | ₹ 19.4 Cr | ₹ 41.3 Cr |
| Other Current Liabilities | ₹ 1.3 Cr | ₹ 2.7 Cr | ₹ 31.5 Cr |
| Non-Current Liabilities | ₹ 7.9 Cr | ₹ 22.2 Cr | ₹ 40.5 Cr |
| Borrowings | ₹ 7.9 Cr | ₹ 22.2 Cr | ₹ 40.5 Cr |
| Other Non-Current Liabilities | ₹ 0.0 Cr | ₹ 0.0 Cr | ₹ 0.0 Cr |
| ASSETS | ₹ 25.5 Cr | ₹ 69.0 Cr | ₹ 195.4 Cr |
| Current Assets | ₹ 18.3 Cr | ₹ 41.7 Cr | ₹ 98.6 Cr |
| Trade Receivables | ₹ 5.6 Cr | ₹ 8.9 Cr | ₹ 34.4 Cr |
| Inventory | ₹ 7.1 Cr | ₹ 21.7 Cr | ₹ 46.3 Cr |
| Cash & Cash Equivalents | ₹ 0.1 Cr | ₹ 0.2 Cr | ₹ 0.2 Cr |
| Other Current Assets | ₹ 5.5 Cr | ₹ 10.9 Cr | ₹ 17.7 Cr |
| Non-Current Assets | ₹ 7.2 Cr | ₹ 27.3 Cr | ₹ 96.8 Cr |
| Fixed Assets | ₹ 5.7 Cr | ₹ 23.1 Cr | ₹ 87.1 Cr |
| Other Non-Current Assets | ₹ 1.5 Cr | ₹ 4.2 Cr | ₹ 9.7 Cr |
OBSERVATIONS & INSIGHTS
Shareholders' wealth increased from INR 3.7 Cr in FY23 to INR 69.8 Cr in FY25, driven predominantly by a sharp rise in reserves and surplus
Total borrowings increased from about INR 14.2 Cr in FY23 to INR 52.7 Cr in FY25. The balance sheet therefore became larger and more debt-funded in absolute terms
Fixed assets including CWIP increased from INR 5.7 Cr to INR 87.1 Cr
Inventory increased from INR 7.1 Cr to INR 46.3 Cr and receivables from INR 5.6 Cr to INR 34.4 Cr, making inventory management, collections and customer credit increasingly important as the business scales
Cash Flow
| Financial Metric | FY 2023 | FY 2024 | FY 2025 |
|---|---|---|---|
CFO (₹ Cr) Cash generated from core business operations. | +2.0 Cr | +4.8 Cr | +27.1 Cr |
CFI (₹ Cr) Cash used for investments and long-term assets. | -1.1 Cr | -25.5 Cr | -75.5 Cr |
CFF (₹ Cr) Cash flow related to funding and borrowings. | -1.0 Cr | +20.8 Cr | +48.4 Cr |
Working Capital
| Efficiency Metric | FY 2023 | FY 2024 | FY 2025 |
|---|---|---|---|
Debtor Days Average number of days taken to collect customer payments. | - | - | - |
Creditor Days Average time taken to pay suppliers and vendors. | - | - | - |
Inventory Days Average number of days inventory remains unsold. | - | - | - |
CCC (Cash Conversion Cycle) (Debtor Days + Inventory Days - Creditor Days) | - | - | - |
Financial Ratios
Measures the company’s leverage relative to shareholder equity.
OBSERVATIONS & INSIGHTS
ROE increased to 78.0% in FY24 before moderating to 57.8% in FY25. The decline in FY25 reflects the much larger average equity base after reserves and capital expanded
ROCE improved consistently from 20.9% to 29.1% and 38.3%, indicating that operating earnings have so far grown faster than the average capital employed despite aggressive expansion
ROA rose from 8.8% in FY23 to 17.9% in FY25 even as total assets expanded nearly eightfold, demonstrating improving profit productivity of the enlarged asset base
Debt / equity fell from 3.8x to 0.8x by FY25 because net worth expanded much faster than borrowings
Industry Overview
Industry Drivers
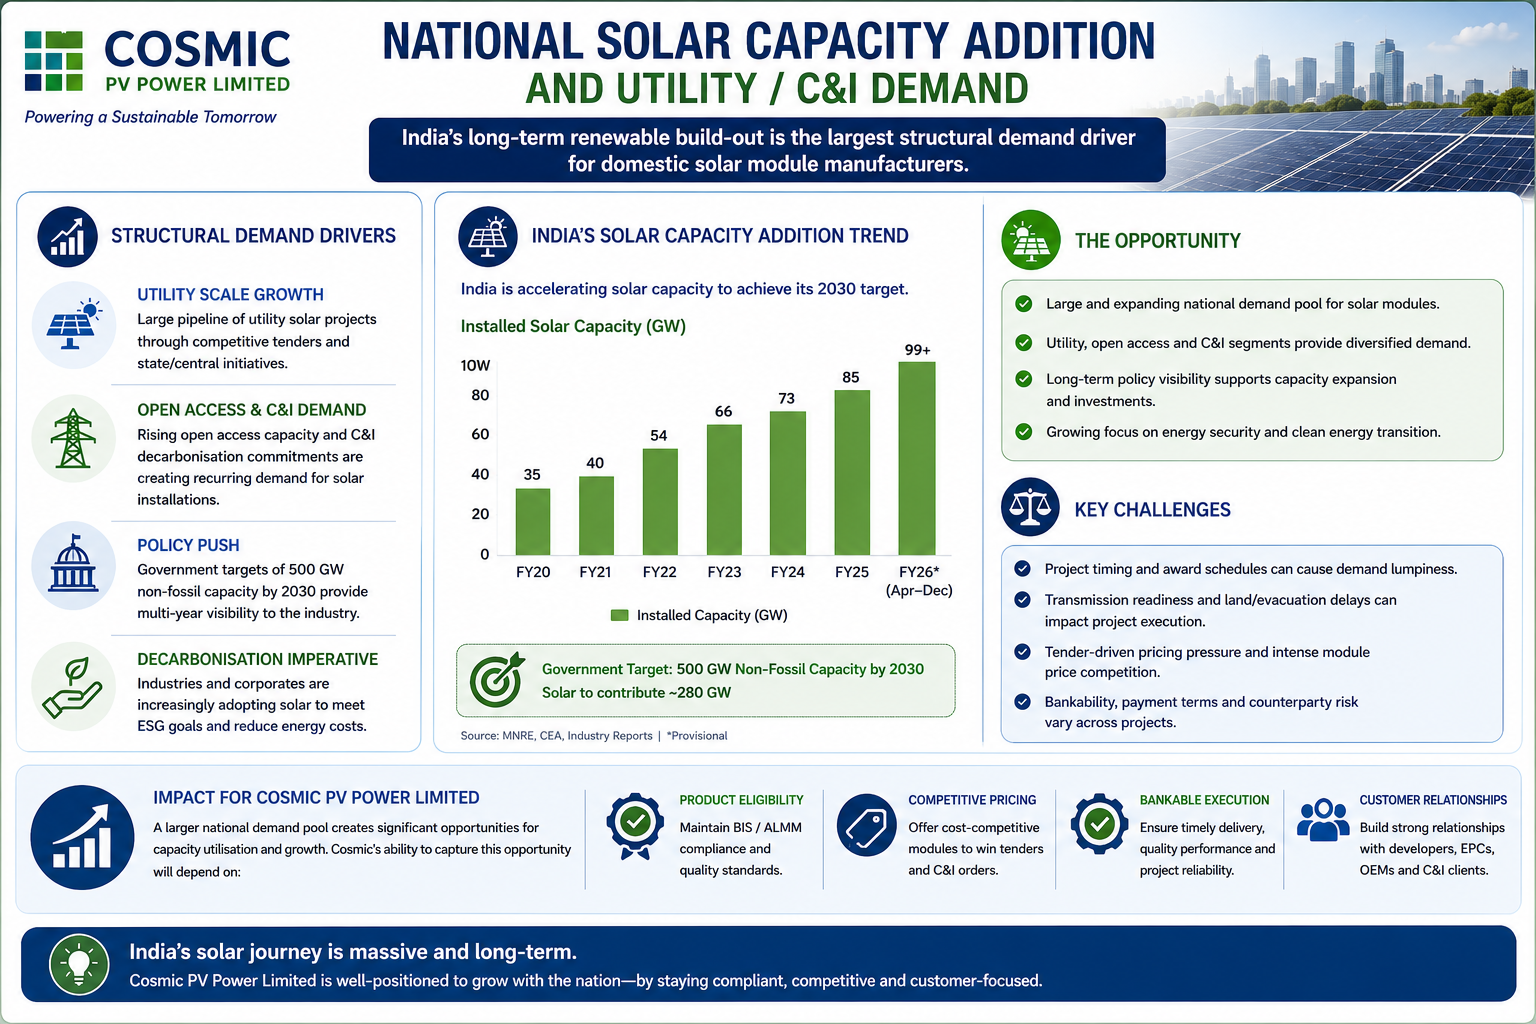
National Solar Capacity Addition and Utility / C&I Demand
India's long-term renewable build-out remains the largest structural demand driver for domestic module manufacturers
Utility tenders, openaccess capacity and commercial / industrial decarbonisation create recurring module demand
The opportunity is large, but project timing, transmission readiness, tender economics and module-price competition can make annual demand uneven
For Cosmic, a larger national demand pool supports capacity utilisation only if the Company can maintain product eligibility, competitive pricing and bankable execution
Domestic Manufacturing, ALMM and Supply-Chain Localisation
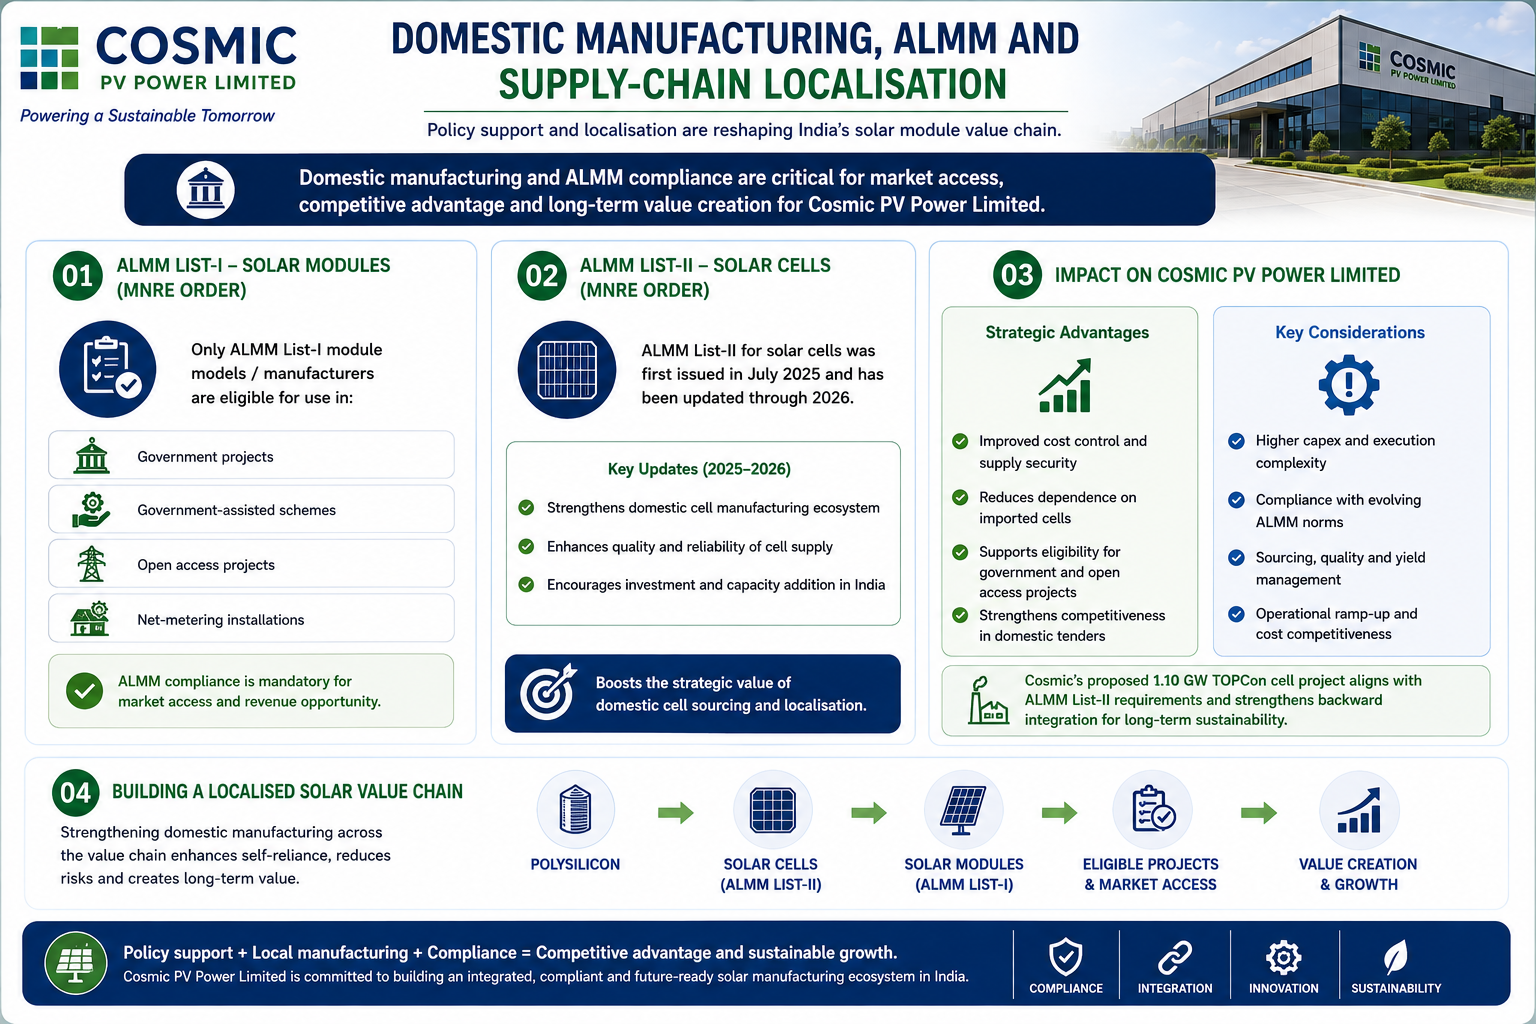
The Approved List of Models and Manufacturers is an important market-access mechanism
MNRE states that only eligible List-I module models / manufacturers can be used in government projects, government-assisted schemes, open-access and net-metering categories covered by the order
ALMM List-II for solar cells was first issued in July 2025 and has been updated through 2026
This raises the strategic value of domestic cell sourcing and helps explain Cosmic's proposed TOPCon cell backward integration, while also increasing compliance and sourcing complexity
Technology Shift toward N-Type TOPCon and Higher-Efficiency Modules
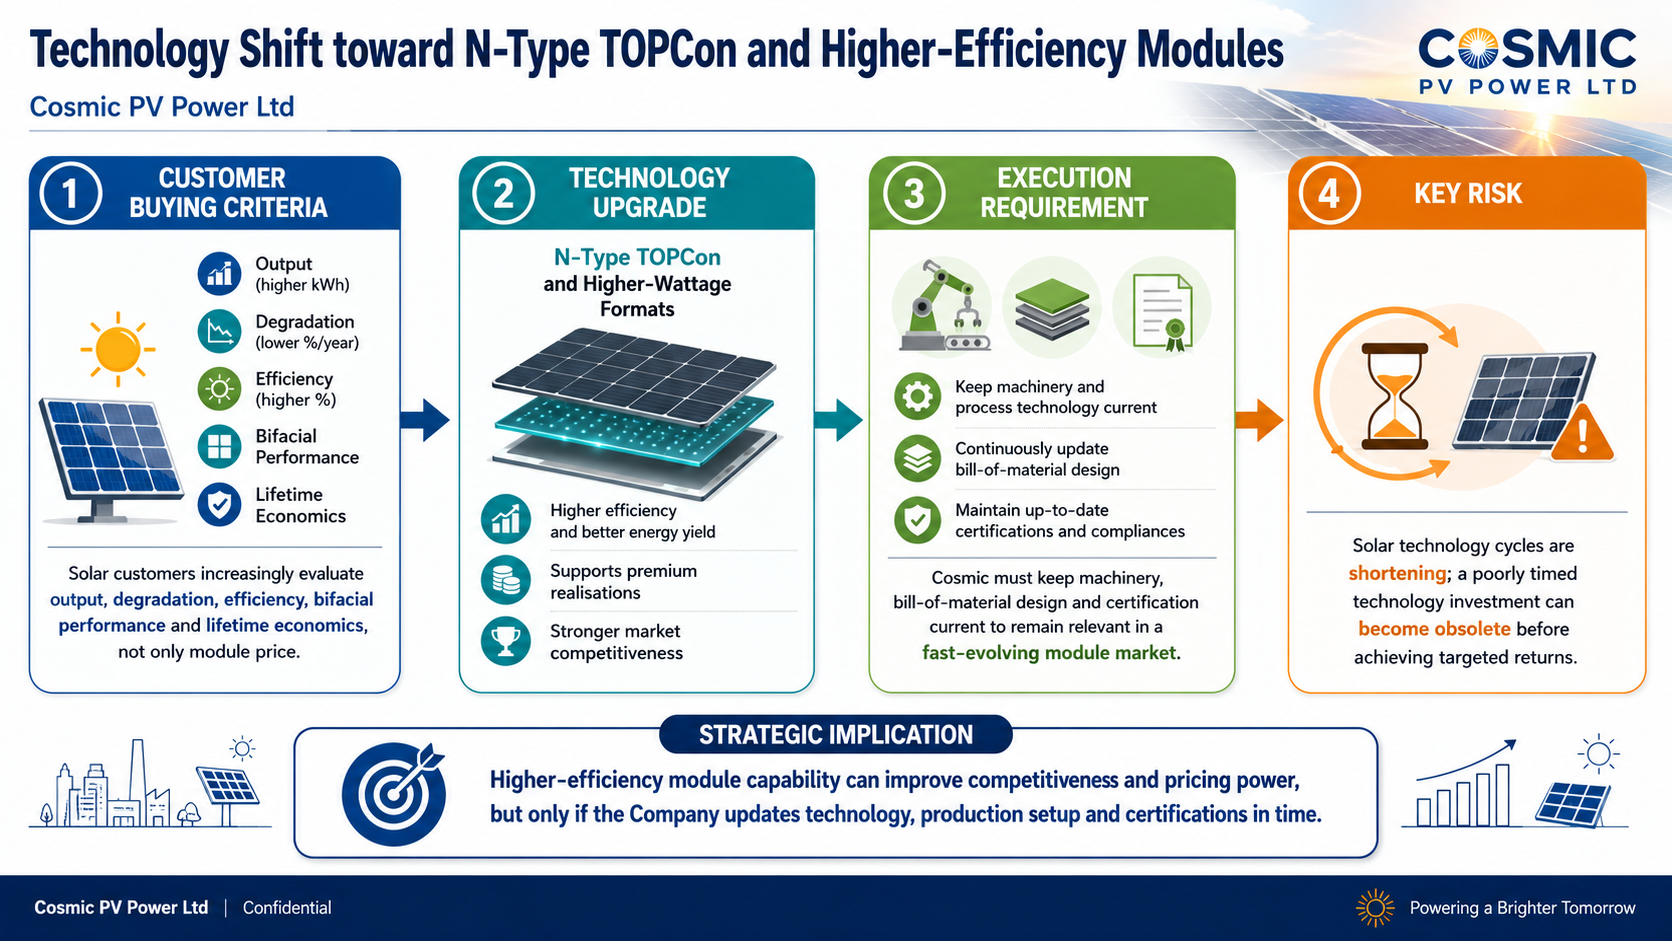
Solar customers increasingly evaluate output, degradation, efficiency, bifacial performance and lifetime economics rather than only module price
The shift toward N-Type TOPCon and higher-wattage formats can support premium realisations and better competitiveness, but also shortens technology cycles
Cosmic must keep machinery, bill-of-material design and certification current; a poorly timed technology investment can become obsolete before achieving targeted returns
Government Policy Support
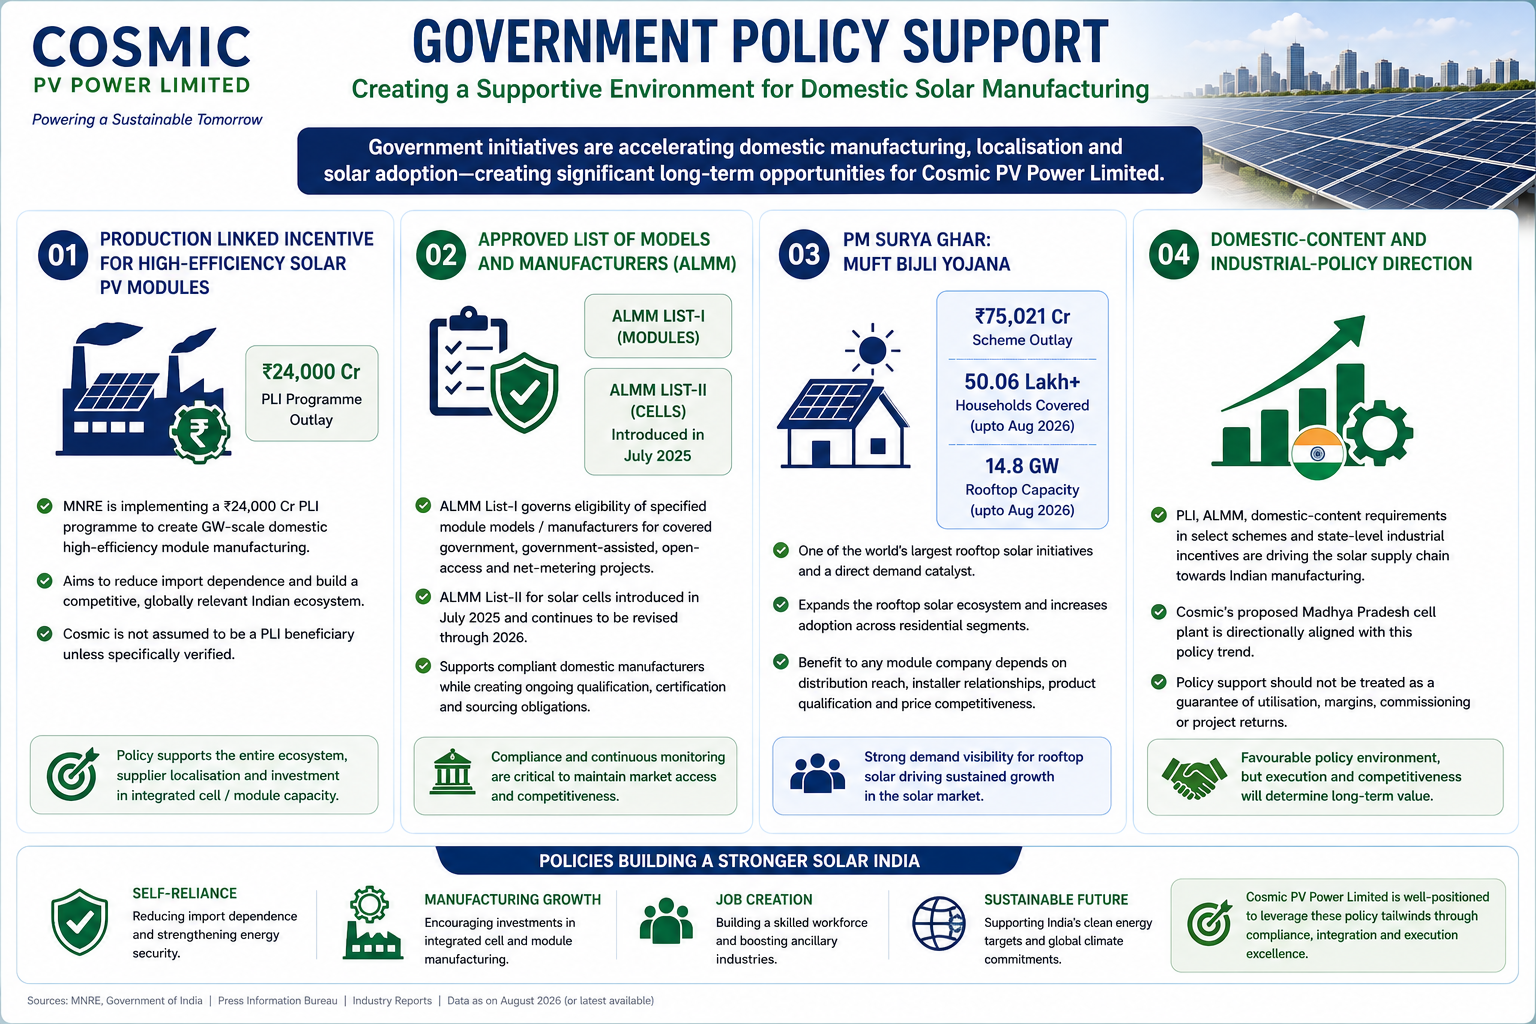
Production Linked Incentive for High-Efficiency Solar PV Modules: MNRE is implementing a ₹24,000 Cr PLI programme intended to create GW-scale domestic high-efficiency module manufacturing and reduce import dependence
Approved List of Models and Manufacturers: ALMM List-I governs eligibility of specified module models / manufacturers for covered government, government-assisted, open-access and net-metering projects. MNRE also introduced ALMM List-II for solar cells in July 2025 and continued revising it through 2026. This policy architecture can support compliant domestic manufacturers while creating qualification, certification and sourcing obligations that need continuous monitoring
PM Surya Ghar Muft Bijli Yojana: The rooftop scheme carries an outlay of ₹75,021 Cr and had crossed 50.06 lakh households and 14.8 GW of rooftop capacity by August 2026. This is a direct demand catalyst for the rooftop solar ecosystem, although the benefit to any module company depends on distribution reach, installer relationships, product qualification and price competitiveness
- Overview
- Business
- Financial Highlights
- Industry Overview
- Documentation
Get the Preqt App and keep in touch around the clock!
 Monitor your investments in real-time.
- Receive tailored deal suggestions.
- Get real-time updates and alerts.
