


Deepa Jewellers
Jewels with DistinctionCrafting Timeless Elegance
IPO Summary (PrEqT)
Deepa Jewellers Limited is a Hyderabad-based organised B2B designer, processor and supplier of hallmarked gold jewellery, with a concentration in South India and specialisation in Vaddanam and CNC machine-cut bangles. FY26 revenue from operations rose 37.9% to INR 1,926.7 Cr, EBITDA increased to INR 146.3 Cr with margin expanding to 7.6%, and PAT reached INR 104.8 Cr. FY26 ROE was 56.5%, ROCE 52.1% and debt/equity 0.5x. The IPO combines up to INR 250.0 Cr of fresh capital with a fixed OFS of 1,18,48,340 shares; at the cap price the post-issue market capitalisation is approximately INR 1,701.4 Cr and FY26 P/E is 13.8x. The investment case is supported by strong growth, organised-retail formalisation and a deep South Indian customer network, but requires close monitoring of customer concentration, receivable-led working-capital intensity, gold-price volatility and outsourced-karigar dependence.
IPO Review Rating
Average
MainboardCreating Distinctive Jewellery Designed to Celebrate Life’s Special Moments
Deepa Jewellers is fundamentally much stronger than its industry score alone suggests. The Company's standout feature is the pace of financial improvement: Revenue has compounded at 37.1%, EBITDA Margin expanded from 3.5% to 7.6%, PAT reached INR 104.8 Cr, ROE reached 56.5%, and D/E improved to 0.5x. The key issue to watch is quality of growth rather than reported growth itself. Operating cash flow has been negative for two consecutive years as trade receivables expanded sharply, and INR 215.0 Cr of IPO proceeds is itself being raised to fund additional working capital. Top-10 customer concentration of 64.7%, product concentration of 72.7% in Vaddanam and CNC bangles, and 94.4% geographic dependence on South India add operating concentration risk. The industry is large and formalising, but its forward B2B growth is only 2–3%, so Deepa will need to continue taking market share to sustain anything close to recent growth rates.
PARAMETER
WEIGHT
SCORE
KEY FACTORS
Financial Performance
40.0%
3.0/5
Revenue has compounded at 37.1%, EBITDA Margin more than doubled from 3.5% to 7.6%, PAT reached INR 104.8 Cr, ROE reached 56.5%, and leverage moderated to 0.5x. The major weakness is cash conversion.
Show more
Detailed Analysis
Revenue increased from INR 1,024.6 Cr in FY24 to INR 1,926.7 Cr in FY26, representing 37.1% CAGR
FY26 operating EBITDA was INR 146.3 Cr, with Margin improving to 7.6% from 4.0% in FY25 and 3.5% in FY24
PAT increased to INR 104.8 Cr in FY26 and PAT Margin expanded to 5.4%, from 2.9% in FY25
D/E improved consistently from 0.8x in FY24 to 0.6x in FY25 and 0.5x in FY26
FY26 ROE was exceptionally strong at 56.5%, versus 36.0% in FY25 and 30.3% in FY24
OCF was INR -14.7 Cr in FY26, INR -9.9 Cr in FY25, versus positive INR 4.8 Cr in FY24
Largest FY26 customer represented 16.8% of Revenue, although Top-10 customers collectively contributed 64.7%
Industry
15.0%
2.0/5
The jewellery industry provides a large and formalising addressable market, but its headline historical growth should not be extrapolated. The Indian B2B market's projected 2–3%.
Show more
Detailed Analysis
Indian B2B gems & jewellery market is projected to grow only 2–3% CAGR from FY26 to FY30, after strong historical expansion
Jewellery is a mature industry, although organised B2B wholesalers continue gaining relevance through formalisation
Small B2B wholesalers still account for 75–80% of the market
Hallmarking, GST, KYC/AML, bullion-import regulations and volatile import duties create meaningful regulatory exposure
Management
15.0%
4.0/5
The principal promoter has more than 25 years of industry experience, the Board is 50.0% independent, promoter shares carry no pledge, and the RHP discloses no criminal, regulatory, material civil or tax proceedings against the promoters.
Show more
Detailed Analysis
Chairman and Managing Director Ashish Agarwal has over 25 years of jewellery-industry experience
Board comprises 6 Directors, including 3 Independent Directors, resulting in exactly 50.0% independence
Promoter shares are unpledged and no criminal, regulatory, material civil or tax proceedings are disclosed against promoters
Recurring FY26 RPTs excluding loan principal were approximately INR 4.9 Cr, or only about 0.3% of Revenue
Valuation
20.0%
4.0/5
At the INR 177 cap price, Deepa trades at approximately 13.8x FY26 earnings, around 42.1% below the 23.9x RHP peer average, while generating FY26 RoNW of 56.5%.
Show more
Detailed Analysis
P/E is 13.8x, approximately 42.1% below peer average P/E of 23.9x
INR 177 / FY26 NAV INR 29.0 gives P/B of approximately 6.1x
FY26 RoNW was 56.5%, with weighted-average RoNW of 45.3%
Merchant Banker Track Record
10.0%
4.0/5
Emkay has demonstrated meaningful mainboard execution capability, but its latest disclosed listing record is mixed at 50.0% positive openings. Valmiki Leela has no comparable disclosed IPO history over the review period..
Show more
Detailed Analysis
Emkay's four disclosed recent IPOs generated an average listing-opening return of approximately 14.6%
Available recent Emkay deals average approximately 55.9x subscription, albeit with significant dispersion
2 of 4, or 50.0%, of Emkay's disclosed recent IPOs opened above issue price
Emkay has an established institutional track record; Valmiki Leela has no IPOs disclosed for the preceding review period
TOTAL
100%
3.3/5
Weighted Composite Score
Issue Price
₹168.0 to ₹177.0
As of 29 Aug 2026
GMP
₹12.0
As of 29 Aug 2026
Estimated Gain / Loss
+6.8%
Lot Size
84.0 Shares
Grey Market Premium (GMPs) are shared for knowledge purpose only. PrEqt doesn’t promote or execute the trades.
| Issue size | |
|---|---|
| Overall | ₹460.0 Cr |
| Fresh Issue | ₹250.0 Cr |
| Offer for Sale | ₹210.0 Cr |
Minimum Investment
₹14,868.0 / 7,056 shares

Merchant Banker
Emkay Global Financial Services Ltd.; Valmiki Leela
IPO Document
RHP / Anchor Document
Offer Start Date
1st Sept 2026
Offer End Date
3rd Sept 2026
Valuation
₹1,701.4 Cr
Revenue (FY'26)
₹1,927.7 Cr
PAT (FY'26)
₹104.8 Cr
Issue Size
₹460.0 Cr
Face Value
₹ 2.0Offer Price
₹ 177.0Lot Size
84.0 sharesSale Type
Fresh capital cum OFSPAT (FY'26)
₹ 104.8 CrPAT Margin (FY'26)
5.4 %P/E Multiple
13.8xEBITDA (FY'26)
₹ 146.3 CrCAGR Growth 2Y
37.1 %ROE (FY'26)
56.5 %ROCE (FY'26)
52.1 %Price to Book Value
6.1xDebt/Equity
0.5xCompany Website
www.deepajewel.comExplore new deals
Overview
Fund Allocation
Total: ₹0 CrSource:Company DRHP
Timeline
IPO Open Date
To Be Announced
IPO Close Date
To Be Announced
Tentative Allotment
To Be Announced
Initiation of Refunds
To Be Announced
Credit of Shares to Demat
To Be Announced
Tentative Listing Date
To Be Announced
Business
Business Model
Geographical Presence
Sales Channel
Key Risk Factor
Financial Highlights
Income Statement
Revenue growth with EBITDA and PAT margins
| Financial Metric | FY 2024 | FY 2025 | FY 2026 |
|---|---|---|---|
| Revenue (₹ Cr) | 1,025.7 | 1,400.1 | 1,927.7 |
| Growth (%) | - | 36.4% | 37.9% |
| EBITDA (₹ Cr) | 35.8 | 56.0 | 146.3 |
| EBITDA Margin (%) | 3.5% | 4.0% | 7.6% |
| PAT (₹ Cr) | 24.3 | 40.6 | 104.8 |
| PAT Margin (%) | 2.4% | 2.9% | 5.4% |
OBSERVATIONS & INSIGHTS
Revenue from operations increased from INR 1,024.6 Cr in FY24 to INR 1,926.7 Cr in FY26, a two-year CAGR of 37.1%, reflecting higher sales volumes and gold-price realisations
EBITDA increased 56.6% in FY25 and 161.3% in FY26 to INR 146.3 Cr, substantially faster than revenue in FY26
PAT increased from INR 24.3 Cr to INR 104.8 Cr across FY24-FY26; FY26 growth of 158.2% reflects the stronger EBITDA base despite higher finance costs and taxes
Balance Sheet
| Financial Metric | FY 2024 | FY 2025 | FY 2026 |
|---|---|---|---|
| Net Worth | ₹ 92.6 Cr | ₹ 133.2 Cr | ₹ 238.1 Cr |
| Total Assets | ₹ 174.6 Cr | ₹ 217.7 Cr | ₹ 357.2 Cr |
| Total Borrowing | ₹ 77.9 Cr | ₹ 80.8 Cr | ₹ 111.1 Cr |
| Reserves & Surplus | ₹ 88.5 Cr | ₹ 129.1 Cr | ₹ 221.7 Cr |
OBSERVATIONS & INSIGHTS
Total equity rose from INR 92.6 Cr in FY24 to INR 238.1 Cr in FY26, mainly through retained profits; the FY26 bonus issue reclassified reserves into share capital but did not create new net worth
Total assets increased 64.1% in FY26 to INR 357.2 Cr, primarily because trade receivables expanded as revenue accelerated
Gross current and non-current borrowings increased to INR 111.1 Cr in FY26 to support the larger working-capital base, but D/E still reduced to 0.5x because equity grew faster
Cash Flow
| Financial Metric | FY 2024 | FY 2025 | FY 2026 |
|---|---|---|---|
CFO (₹ Cr) Cash generated from core business operations. | +4.8 Cr | -9.9 Cr | -14.7 Cr |
CFI (₹ Cr) Cash used for investments and long-term assets. | +5.8 Cr | +10.3 Cr | -4.4 Cr |
CFF (₹ Cr) Cash flow related to funding and borrowings. | -9.5 Cr | -1.5 Cr | +19.1 Cr |
Working Capital
| Efficiency Metric | FY 2023 | FY 2024 | FY 2025 |
|---|---|---|---|
Debtor Days Average number of days taken to collect customer payments. | - | - | - |
Creditor Days Average time taken to pay suppliers and vendors. | - | - | - |
Inventory Days Average number of days inventory remains unsold. | - | - | - |
CCC (Cash Conversion Cycle) (Debtor Days + Inventory Days - Creditor Days) | - | - | - |
Financial Ratios
Measures the company’s leverage relative to shareholder equity.
OBSERVATIONS & INSIGHTS
ROE improved to 56.5% in FY26 because PAT increased 158.2%, materially faster than average shareholders' equity
Debt / Equity declined from 0.8x in FY24 to 0.5x in FY26 even though borrowings increased, because retained earnings expanded equity more quickly
Interest Coverage Ratio improved from 9.2x to 23.2x as operating profit scaled much faster than finance costs
Current Ratio improved to 4.9x, reflecting a large current-asset base; the ratio is high largely because trade receivables and inventory are substantial
ROA year-end asset proxy increased to 29.3% in FY26 because PAT growth significantly exceeded growth in the asset base
ROCE improved to 52.1% in FY26 as EBIT rose faster than average capital employed
Industry Overview
Industry Drivers
Formalisation and Organised B2B Supply
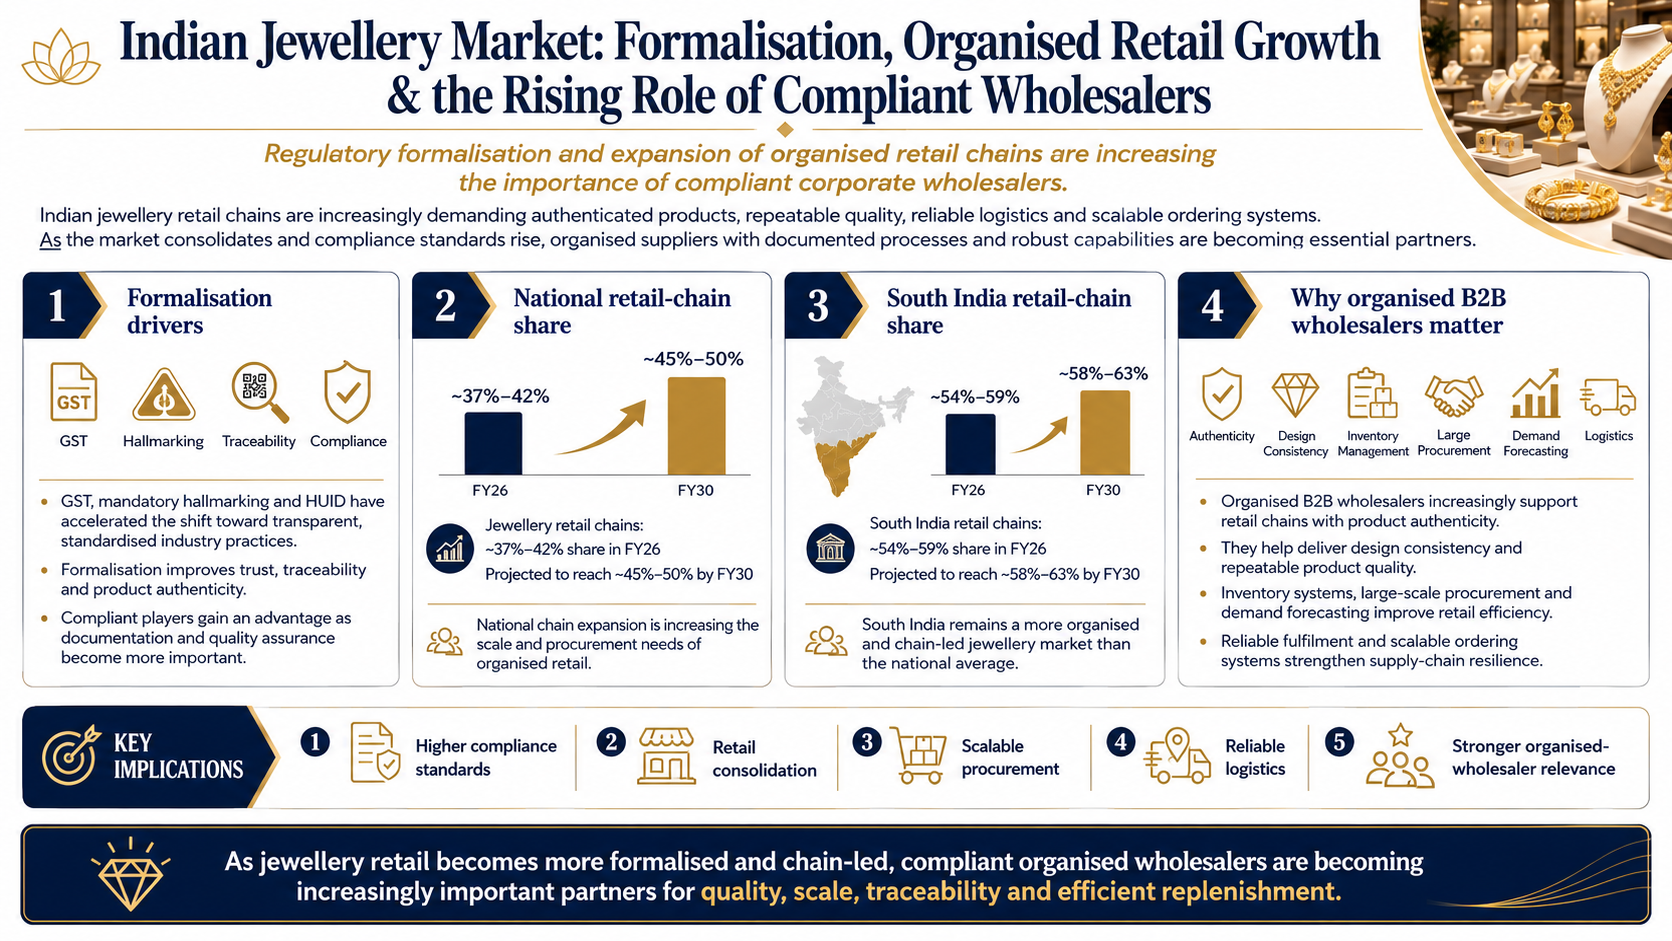
Regulatory formalisation and the expansion of organised retail chains are increasing the role of compliant corporate wholesalers. Retail chains require authenticated products, repeatable quality, reliable logistics and scalable ordering systems, making organised suppliers more important as the retail market consolidates.
The key details are:
GST, mandatory hallmarking and HUID have accelerated the shift toward transparent, standardised industry practices
Jewellery retail chains increased their national market share to approximately 37%-42% in FY26 and are projected to reach 45%-50% by FY30
In South India, retail chains held approximately 54%-59% of the jewellery market in FY26 and are projected to reach 58%-63% by FY30
Organised B2B wholesalers increasingly support retail chains with product authenticity, design consistency, inventory systems, large-scale procurement and demand forecasting
Weddings, Festivals and Gold as a Cultural / Financial Asset
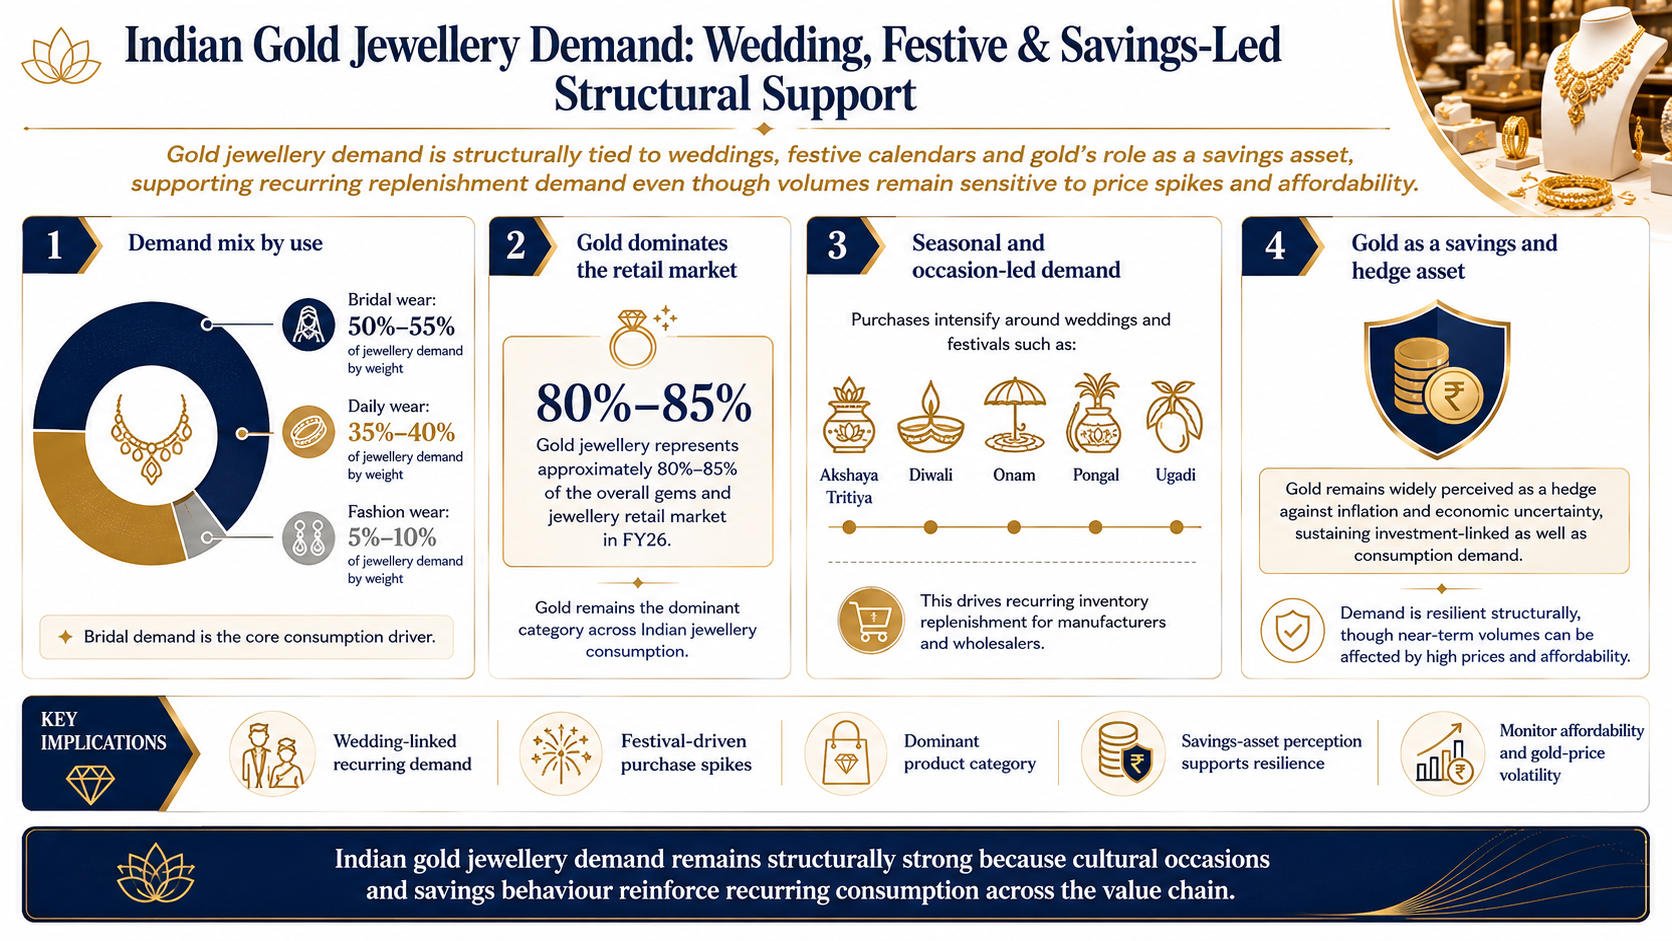
Gold jewellery demand is structurally tied to weddings, festive calendars and gold's role as a savings asset. These demand pools support recurring replenishment for manufacturers and wholesalers even though volumes remain sensitive to price spikes and affordability.
The key details are:
Bridal wear accounts for approximately 50%-55% of jewellery demand by weight, with daily wear at 35%-40% and fashion wear at 5%-10%
Gold jewellery represents approximately 80%-85% of the overall gems and jewellery retail market in FY26
Purchases intensify around weddings and festivals such as Akshaya Tritiya, Diwali, Onam, Pongal and Ugadi
Gold remains widely perceived as a hedge against inflation and economic uncertainty, sustaining investment-linked as well as consumption demand
Rising Income, Urbanisation and Branded Design Preference
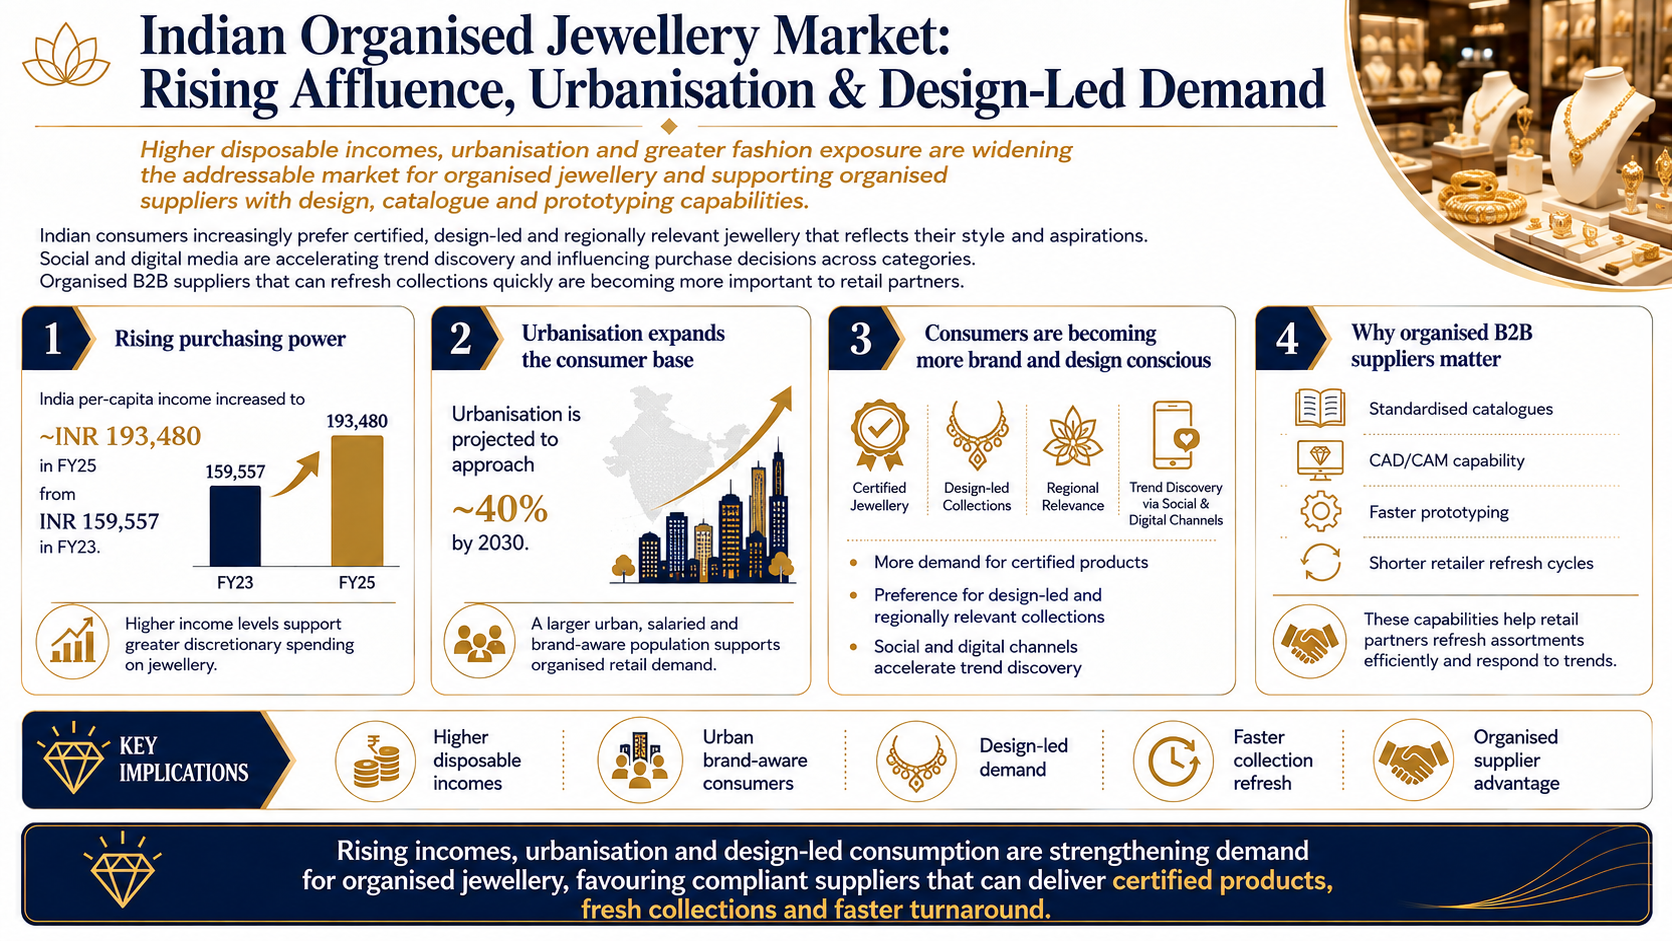
Higher disposable incomes, urbanisation and greater fashion exposure are widening the addressable market for organised jewellery. Consumers increasingly demand certified, design-led and regionally relevant products, which supports suppliers capable of refreshing collections and customising products for retail partners.
The key details are:
India's per-capita income increased to about INR 193,480 in FY25 from INR 159,557 in FY23, supporting discretionary purchasing power
Urbanisation is projected to approach about 40% by 2030, increasing the salaried and brand-aware consumer base
Consumers are becoming more brand conscious and design driven, with social and digital channels accelerating trend discovery
B2B suppliers with design infrastructure, standardised catalogues, CAD/CAM capability and faster prototyping can shorten retailer refresh cycles
Risks in the Industry
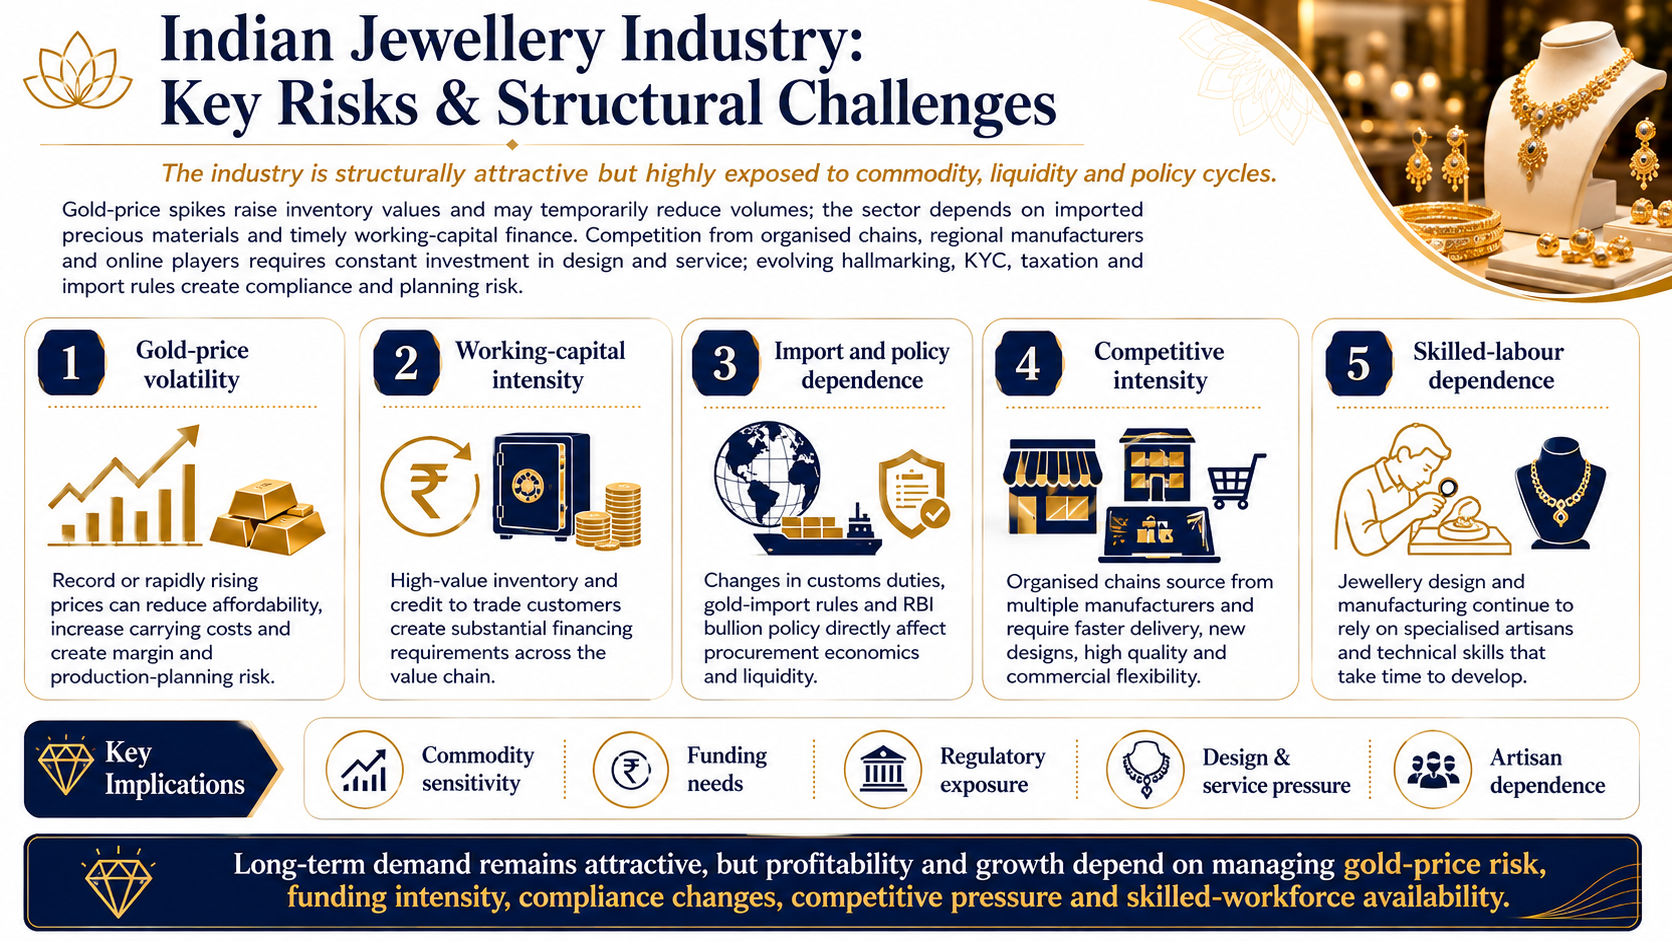
The industry is structurally attractive but highly exposed to commodity, liquidity and policy cycles. Gold-price spikes raise inventory values and may temporarily reduce volumes; the sector also depends on imported precious materials and timely working-capital finance. Competition from organised chains, regional manufacturers and online players requires constant investment in design and service, while evolving hallmarking, KYC, taxation and import rules create compliance and planning risk.
The key risks are:
Record or rapidly rising prices can reduce affordability, increase carrying costs and create margin / production-planning risk
High-value inventory and credit to trade customers create substantial financing requirements across the value chain
Changes in customs duties, gold-import rules and RBI bullion policy directly affect procurement economics and liquidity
Organised chains source from multiple manufacturers and require faster delivery, new designs, high quality and commercial flexibility
Jewellery design and manufacturing continue to rely on specialised artisans and technical skills that take time to develop
Government Policy Support
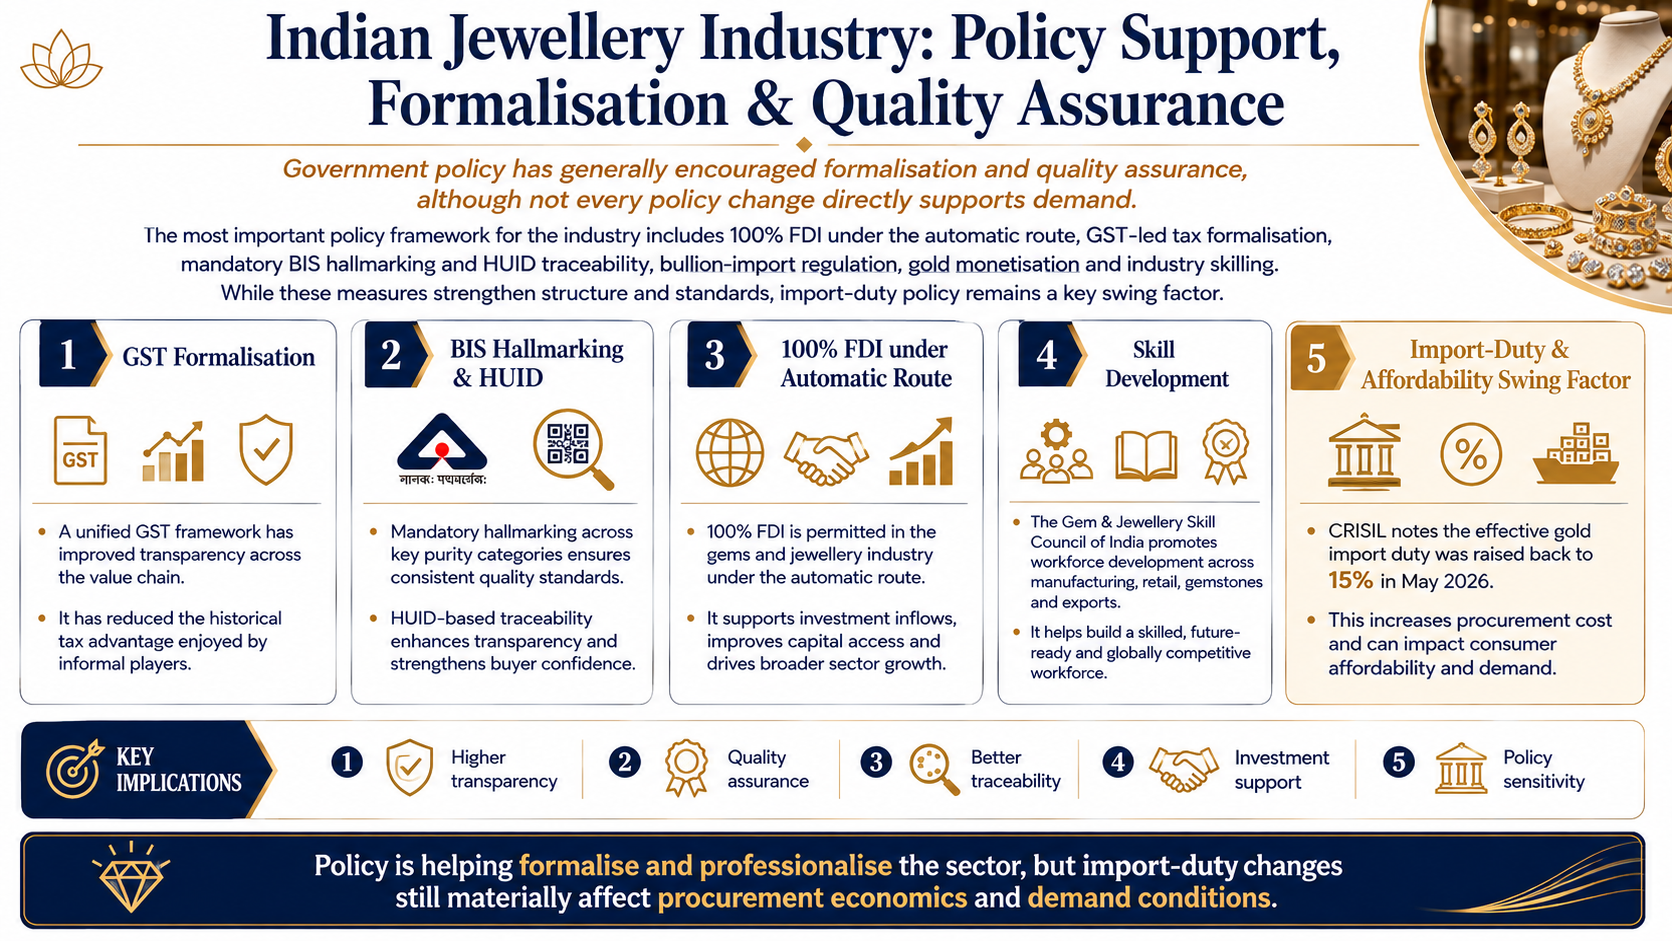
Government policy has generally encouraged formalisation and quality assurance, but not every policy change is supportive of demand. The most important framework includes 100% FDI under the automatic route, GST-led tax formalisation, mandatory BIS hallmarking and HUID traceability, bullion-import regulation, gold monetisation and industry skilling. Import-duty policy remains a swing factor: CRISIL notes that the effective gold import duty was raised back to 15% in May 2026, which increases procurement cost and can affect consumer affordability.
The key policies are:
A unified tax framework like GST has improved transparency and reduced the historical tax advantage of informal players
Mandatory hallmarking across key purity categories and HUID-based traceability improve standardisation and buyer confidence
100% FDI is permitted in the gems and jewellery industry under the automatic route
The Gem & Jewellery Skill Council of India supports workforce development across manufacturing, retail, gemstones and exports
Fundraise/Future Plans
Shareholding
Pre-issue shareholding
Promoter Holding 0.0%
Post-Issue Shareholding
Promoter Holding 0.0%
Category
Pre-Issue%Post-Issue%
Promoters
Ashish Agarwal
48.8%35.4%
Seema Agarwal
48.8%35.4%
Dev Agarwal
2.4%2.1%
Total Promoter Holding
100.0%72.9%
Additional Shareholders
Chandrakala Agarwal
0.0%0.0%
Ashish Agarwal HUF
0.0%0.0%
Total Additional Holding
0.0%0.0%
Total Shareholding
100.0%72.9%
- Overview
- Business
- Financial Highlights
- Industry Overview
- Fundraise/Future Plans
- Documentation
Get the Preqt App and keep in touch around the clock!
 Monitor your investments in real-time.
- Receive tailored deal suggestions.
- Get real-time updates and alerts.
