

Digvijay Finlease Ltd
Capital with ConvictionInvesting for Enduring Value
IPO Review and Rating
Strong Buy
DRHP Not FiledOverall Recommendation
Digvijay Finlease is a very unusual unlisted investment opportunity. It has virtually no leverage, CRAR above 100.0%, audited net worth of approximately INR 10,968.1 Cr, a quoted investment-heavy asset base, strong promoter pedigree and a clean regulatory/audit history.
FY26 reported fundamentals also improved materially: total income increased 18.3%, PAT increased 68.2% to INR 63.2 Cr, and operating cash flow doubled to INR 54.0 Cr. But earnings are not the main investment thesis. The real thesis is the balance sheet: INR 2,114.9 Cr market capitalisation versus INR 10,968.1 Cr audited net worth. That is an 80.7% holding-company discount.The biggest reason not to give it a straightforward 4.5+/5 score is concentration. Approximately 85.8% of the FY26 investment portfolio is represented by Shree Cement, and FY26's INR 2,698.6 Cr OCI loss demonstrates how directly Digvijay's net worth moves with equity-market prices.
PARAMETER
WEIGHT
SCORE
KEY FACTORS
Financial Performance
33.0%
5.0/5
Digvijay Finlease has a debt-free balance sheet, strong capital adequacy, rising PAT and healthy cash generation. However, ROE remains extremely low because of its large investment base, while portfolio concentration in Shree Cement creates significant mark-to-market volatility
Show more
Detailed Analysis
FY26 income increased 18.3%, while FY24-FY26 CAGR was 19.0
PBT margin was exceptionally strong at 94.6%, reflecting the very low-cost investment-holding structure
PAT margin recovered strongly to 72.5%, versus 51.0% in FY25
The Company has no borrowings, resulting in D/E ratio of 0
FY26 ROE on average equity was only approximately 0.5%, reflecting very low income generation relative to the huge investment portfolio
Industry
33.0%
3.0/5
The Company operates more like an investment holding vehicle than a conventional lending NBFC. Its model benefits from low operating costs, negligible credit risk and limited funding dependence, but growth remains closely linked to equity-market performance and portfolio appreciation
Show more
Detailed Analysis
A mature and simple investment-holding model with very low operating costs and negligible credit risk
RBI oversight remains significant, but Type-I NBFC-ND status materially reduces public-fund and customer-interface risk
Long-term growth in Indian equity markets supports investment values and dividend income, but Digvijay does not earn management fees from third-party AUM
Management
33.0%
5.0/5
Management quality is supported by experienced promoters, a reasonably independent Board, clean statutory audits and strong RBI compliance. Related-party transactions remain limited, while conservative capital structure and regulatory discipline strengthen governance comfort for long-term minority investors
Show more
Detailed Analysis
Hari Mohan Bangur and Prashant Bangur bring decades of large-scale capital allocation and industrial management experience
Two of six directors are independent, exactly 33.3%, while key Audit/NRC committees have majority independent representation
Related-party transactions are limited in scale and no materially adverse RPT issue is disclosed
TOTAL
100%
4.3/5
Weighted Composite Score
Per Share Price
₹1575.0
As of 25 Oct 2026
Minimum Investment
₹1,575.0 / 1 shares
Market Cap. (₹ Cr)
Revenue FY’26
PAT FY’26
P/E Multiple
Face Value
₹ 10.0Sale Type
Secondary SalePAT FY’26
₹ 63.2 CrPAT Margin (%)
72.5 %P/E Multiple
32.9xCAGR Growth 3Y
27.3 %ROE (FY’26)
0.5 %ROCE (FY’26)
0.7 %Price to Book Value ratio
0.2xDebt/Equity (FY’26)
0.0xMerchant banker appointed
❌ NoCompany Website
digvijayfin.comDisclaimer: Unlisted shares are unregulated & illiquid. This is NOT investment advice. Please do your own due diligence before investing.
Minimum Investment
₹1,575.0 / 1 sharesShares Lot 1 X 1
Investment amount
₹1,575.0
Overview
Business
Business Model
Geographical Presence
Sales Channel
Key Risk Factor
Financial Highlights
Income Statement
Revenue growth with EBITDA and PAT margins
| Financial Metric | FY 2024 | FY 2025 | FY 2026 |
|---|---|---|---|
| Revenue (₹ Cr) | 61.5 | 54.1 | 87.1 |
| Growth (%) | 34.8% | -12.0% | 60.9% |
| EBITDA (₹ Cr) | 57.0 | 50.8 | 82.4 |
| EBITDA Margin (%) | 92.7% | 93.8% | 94.6% |
| PAT (₹ Cr) | 43.2 | 37.6 | 63.2 |
| PAT Margin (%) | 70.3% | 69.4% | 72.5% |
OBSERVATIONS & INSIGHTS
FY26 operating revenue grew 60.9% after a 12.0% decline in FY25. Higher dividends and investment gains both contributed; total income grew only 18.3% because FY25 included a large impairment reversal
Other income included INR 19.5 Cr of impairment reversal, while other expenses included an equal loan write-off. These offset in PBT. Treating the reversal alone as recurring revenue would misstate the underlying trend
FY26 PAT rose 68.2% to INR 63.2 Cr, but the after-tax OCI loss of INR 2,696.6 Cr produced a total comprehensive loss of INR 2,633.4 Cr. The equity movement is essential to assessing the year
An EBITDA margin of 94.6% reflects an investment vehicle with limited administrative costs. It coexists with ROE of only 0.5% because annual accounting earnings are small relative to the fair-valued equity base
Balance Sheet
| Financial Metric | FY 2024 | FY 2025 | FY 2026 |
|---|---|---|---|
| EQUITY & LIABILITIES | ₹ 12,328.5 Cr | ₹ 14,498.2 Cr | ₹ 11,411.8 Cr |
| Net Worth | ₹ 11,789.8 Cr | ₹ 13,601.6 Cr | ₹ 10,968.2 Cr |
| Share Capital | ₹ 13.3 Cr | ₹ 13.3 Cr | ₹ 13.3 Cr |
| Reserves & Surplus | ₹ 11,776.5 Cr | ₹ 13,588.3 Cr | ₹ 10,954.9 Cr |
| Total Liabilities | ₹ 538.7 Cr | ₹ 896.6 Cr | ₹ 443.6 Cr |
| Current Liabilities | ₹ 0.7 Cr | ₹ 0.7 Cr | ₹ 0.5 Cr |
| Borrowings | ₹ 0.0 Cr | ₹ 0.0 Cr | ₹ 0.0 Cr |
| Trade Payables | ₹ 0.0 Cr | ₹ 0.0 Cr | ₹ 0.1 Cr |
| Other Current Liabilities | ₹ 0.7 Cr | ₹ 0.7 Cr | ₹ 0.4 Cr |
| Non-Current Liabilities | ₹ 538.0 Cr | ₹ 895.9 Cr | ₹ 443.1 Cr |
| Borrowings | ₹ 0.0 Cr | ₹ 0.0 Cr | ₹ 0.0 Cr |
| Other Non-Current Liabilities | ₹ 538.0 Cr | ₹ 895.9 Cr | ₹ 443.1 Cr |
| ASSETS | ₹ 12,328.5 Cr | ₹ 14,498.1 Cr | ₹ 11,411.6 Cr |
| Current Assets | ₹ 13.8 Cr | ₹ 103.0 Cr | ₹ 331.7 Cr |
| Trade Receivables | ₹ 0.0 Cr | ₹ 0.5 Cr | ₹ 13.7 Cr |
| Inventory | ₹ 0.0 Cr | ₹ 0.0 Cr | ₹ 0.0 Cr |
| Cash & Cash Equivalents | ₹ 0.4 Cr | ₹ 0.4 Cr | ₹ 10.6 Cr |
| Other Current Assets | ₹ 13.4 Cr | ₹ 102.1 Cr | ₹ 307.4 Cr |
| Non-Current Assets | ₹ 12,314.7 Cr | ₹ 14,395.1 Cr | ₹ 11,079.9 Cr |
| Fixed Assets | ₹ 5.2 Cr | ₹ 5.2 Cr | ₹ 5.2 Cr |
| Other Non-Current Assets | ₹ 12,309.5 Cr | ₹ 14,389.9 Cr | ₹ 11,074.7 Cr |
OBSERVATIONS & INSIGHTS
Equity fell from INR 13,601.5 Cr to INR 10,968.1 Cr. The INR 2,696.6 Cr after-tax OCI loss outweighed FY26 PAT and explains the reduction in book value per share
Shree Cement represented 85.8% of investments and 85.4% of total assets. Its share count remained unchanged, while the reported value declined from INR 12,917.3 Cr to INR 9,748.5 Cr
Deferred tax liabilities were INR 442.8 Cr, compared with total liabilities of INR 443.5 Cr. The reduction from FY25 partly offsets portfolio-value losses in net worth and should not be described as repayment of debt
Current investments increased, but most assets remain long-term holdings. Unquoted equity of INR 905.1 Cr needs scrutiny of valuation assumptions and realisation prospects, particularly where ownership links overlap with the promoter group
Cash Flow
| Financial Metric | FY 2024 | FY 2025 | FY 2026 |
|---|---|---|---|
CFO (₹ Cr) Cash generated from core business operations. | +35.4 Cr | +26.6 Cr | -1.9 Cr |
CFI (₹ Cr) Cash used for investments and long-term assets. | -35.6 Cr | -26.6 Cr | +12.1 Cr |
CFF (₹ Cr) Cash flow related to funding and borrowings. | +0.0 Cr | +0.0 Cr | +0.0 Cr |
Financial Ratios
Measures the company’s leverage relative to shareholder equity.
OBSERVATIONS & INSIGHTS
ROE increased from 0.3% to 0.5%, and ROCE rose to 0.7%. These ratios measure recognised earnings, excluding the substantial negative FVOCI movement in FY26
Debt to equity remained 0.0x across the review period. Deferred tax is a liability, but it is not borrowing and should not be included as interest-bearing debt
FY26 arithmetic interest coverage was 2,675.4x against 2,526.3x in FY25. Tiny income-tax interest is the denominator; the ratio does not establish a lending franchise or a recurring interest spread
The regrouped current ratio rose to 783.3x as current investment holdings expanded and current obligations remained small. Investment liquidity and settlement timing are more informative than comparison with an industrial company’s normal current ratio
Industry Overview
Industry Drivers
Underlying investee performance
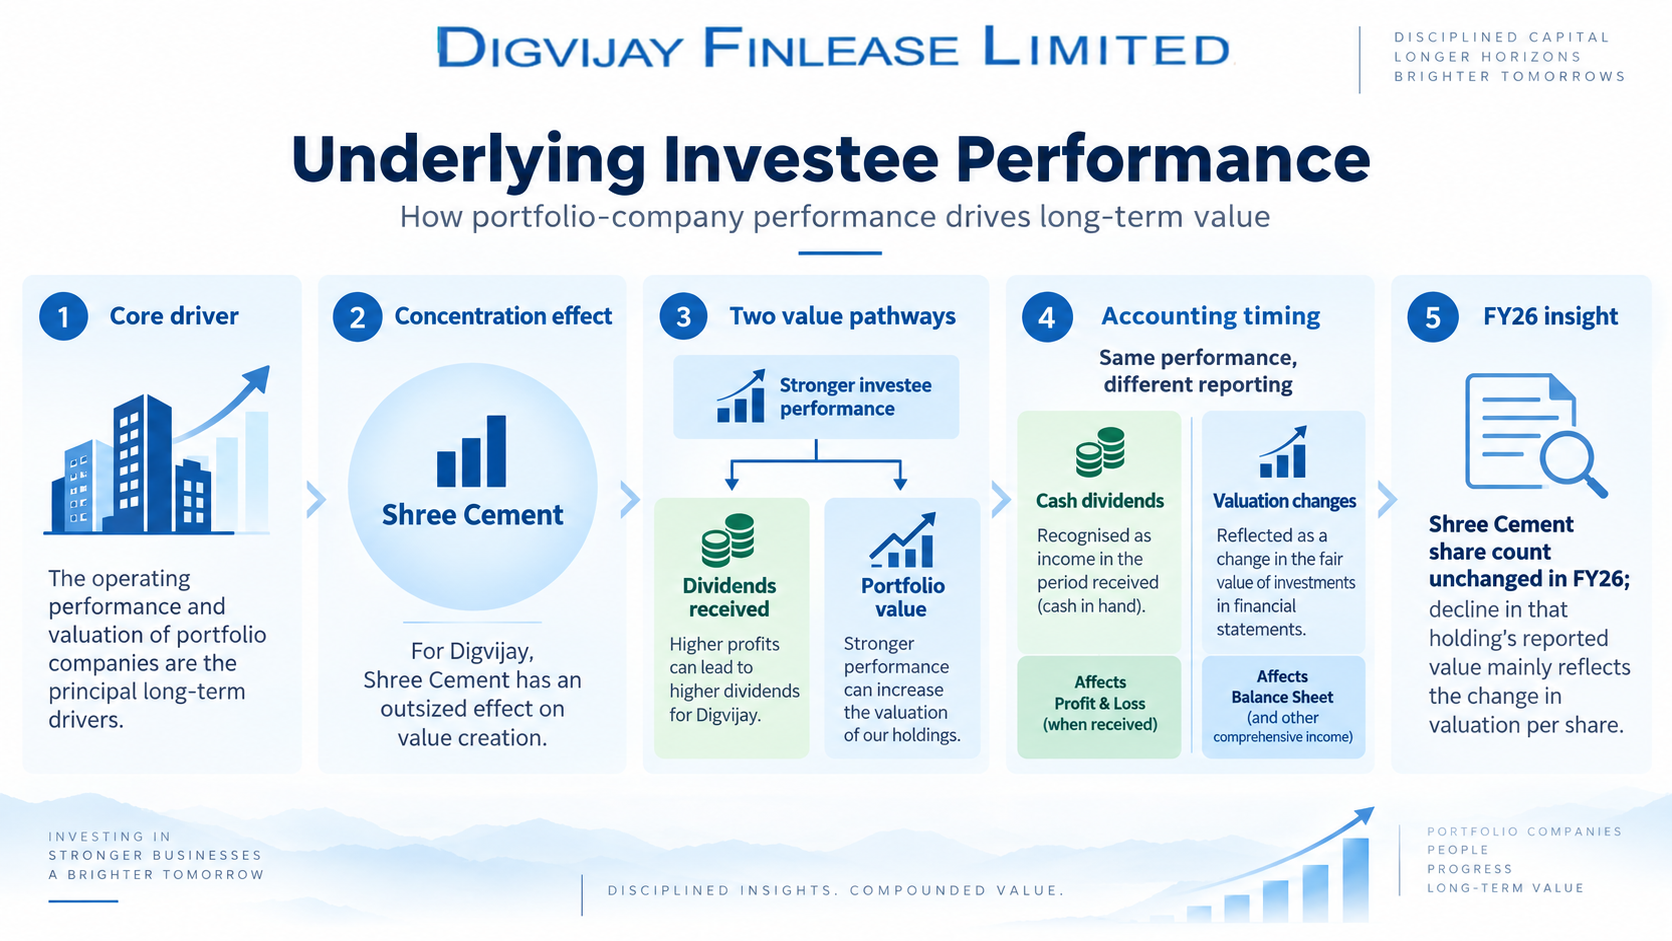
The operating performance and valuation of portfolio companies are the principal long-term drivers. For Digvijay, Shree Cement’s profitability, capital allocation and investor valuation have an outsized effect
A stronger investee can lift both dividends received and portfolio value, although the timing and accounting presentation of those benefits differ. The Company’s unchanged Shree Cement share count in FY26 means the fall in that holding’s reported value largely reflects the change in valuation per share
Dividend capacity and reinvestment
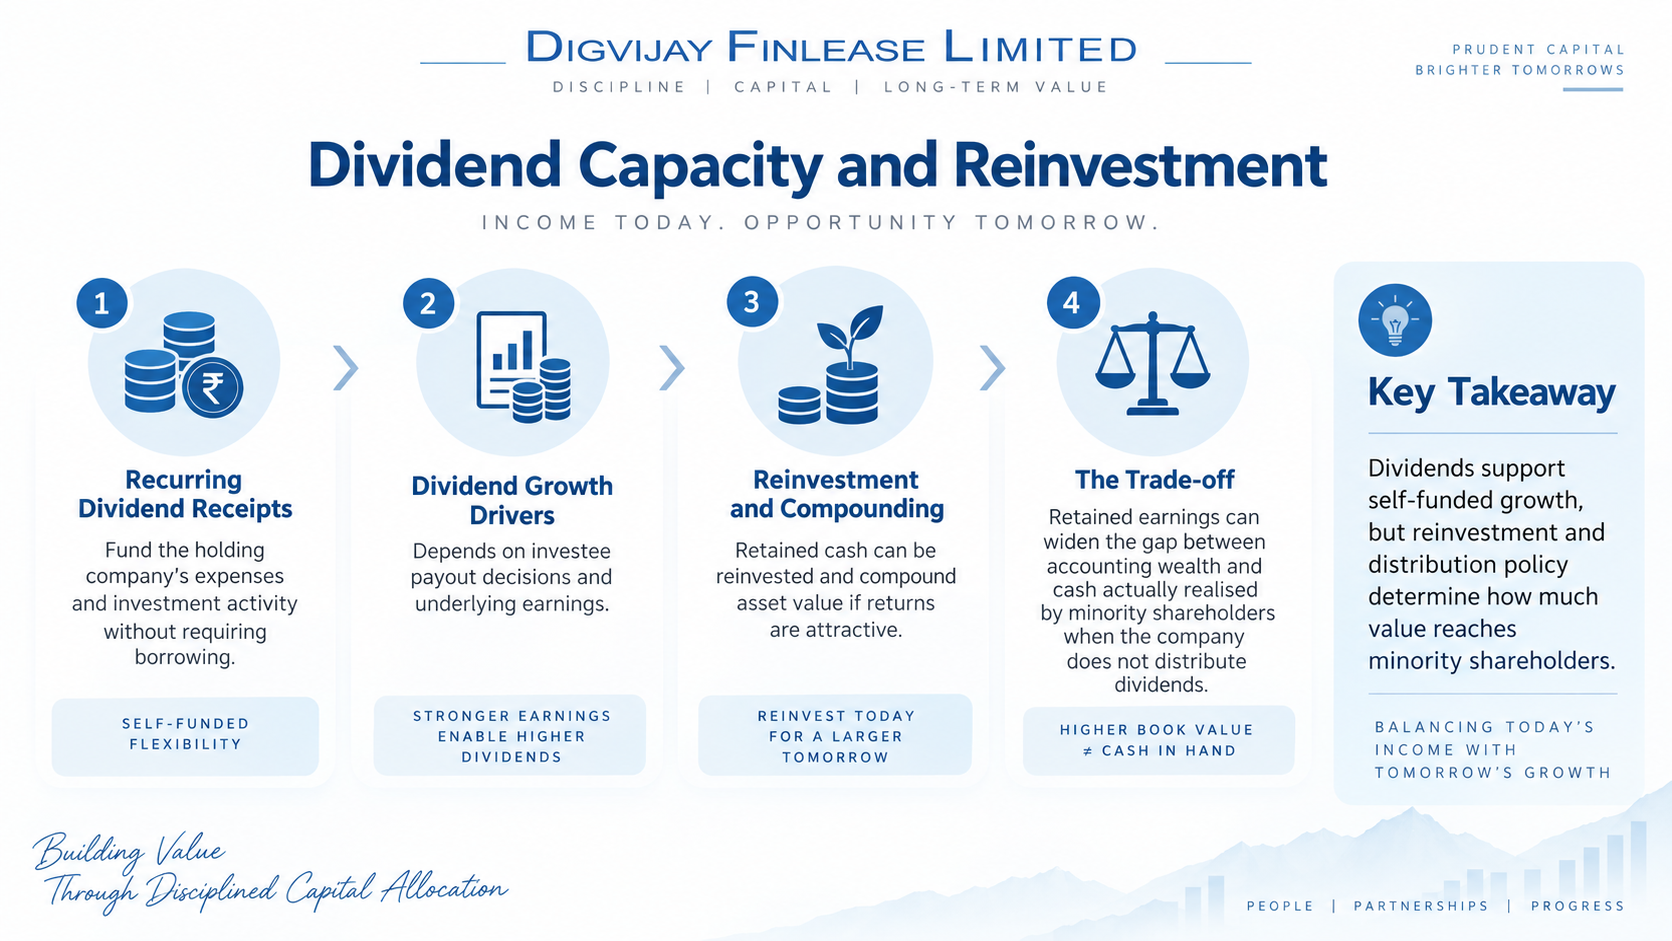
Recurring dividend receipts fund the holding company’s expenses and investment activity without requiring borrowing. Their growth depends on investee payout decisions as well as underlying earnings
Retaining this cash can compound asset value if reinvestment earns adequate returns; it can also widen the disconnect between accounting wealth and cash realised by minority shareholders when the holding company does not distribute dividends
Capital allocation and portfolio mix
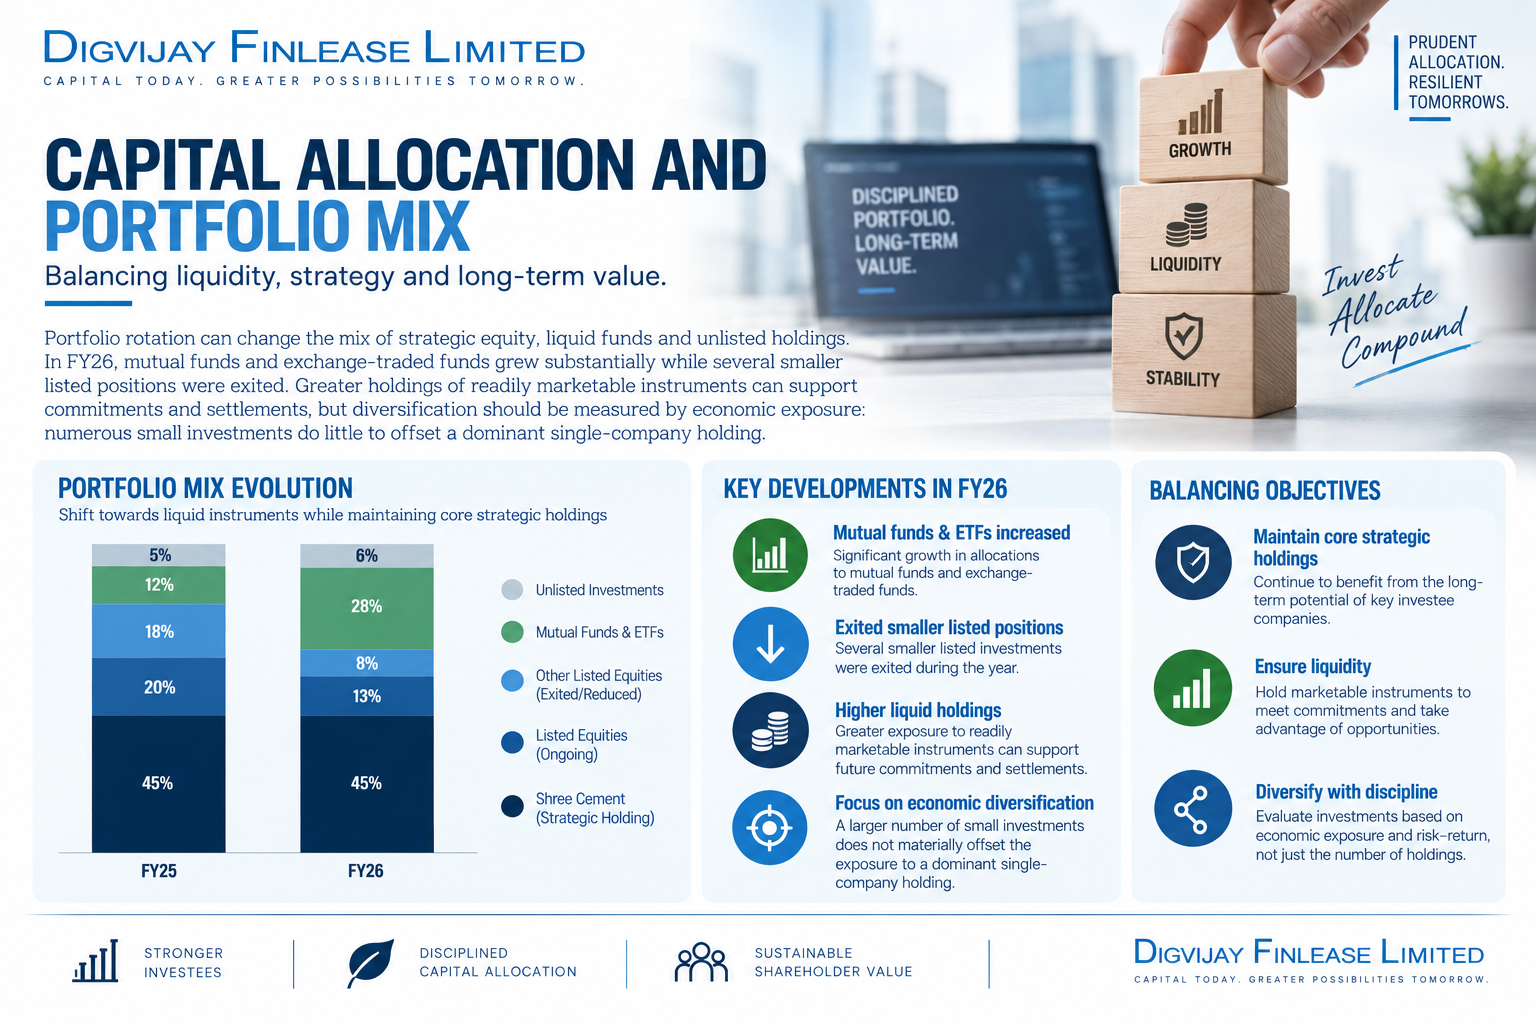
Portfolio rotation can change the mix of strategic equity, liquid funds and unlisted holdings. In FY26, mutual funds and exchange-traded funds grew substantially while several smaller listed positions were exited
Greater holdings of readily marketable instruments can support commitments and settlements, but diversification should be measured by economic exposure: numerous small investments do little to offset a dominant single-company holding
Government Policy Support
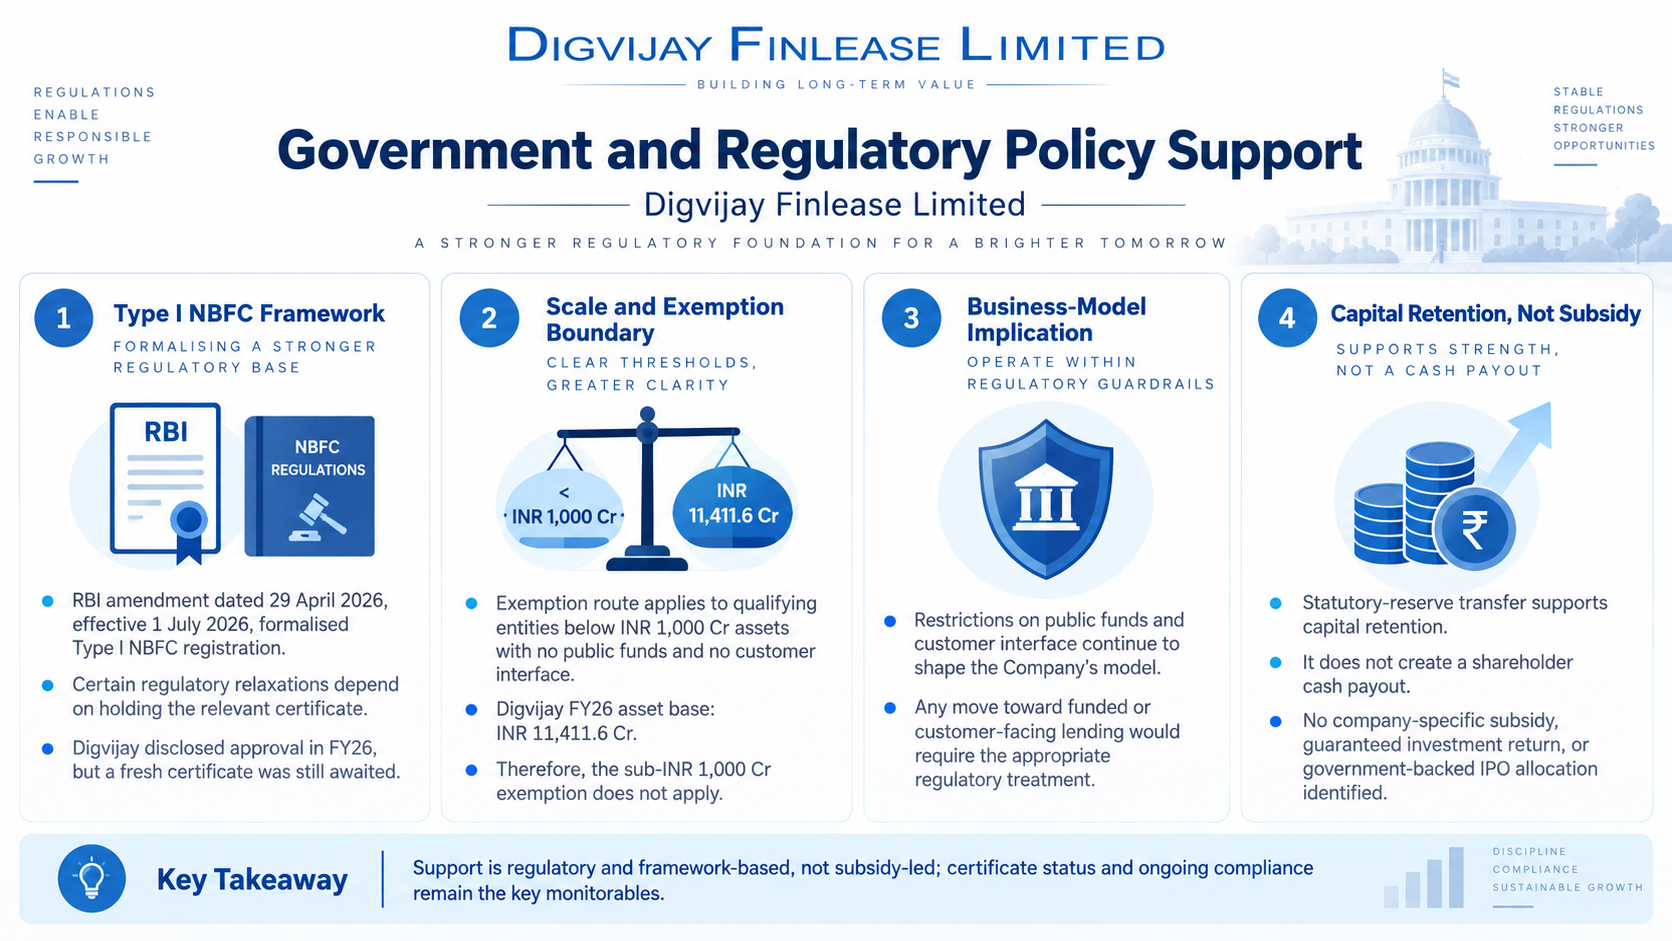
The relevant policy framework is differentiated NBFC regulation rather than a direct operating subsidy. RBI’s April 2026 amendments formalised Type I registration for entities without public funds or customer interface and linked specified regulatory relaxations to holding the relevant certificate. Digvijay’s FY26 disclosure of approval with a fresh certificate still awaited therefore requires follow-up before assuming all available relaxations apply
The exemption route for qualifying entities with assets below INR 1,000.0 Cr does not fit the Company’s FY26 asset base of INR 11,411.6 Cr. Its scale remains above that threshold. Continued restrictions on public funds and customer interface also define the business model: a future move into funded or customer-facing lending would require the appropriate regulatory treatment
The annual report records a transfer of a portion of annual profit to the statutory reserve. This supports retention of capital but does not create a shareholder cash distribution. No company-specific subsidy, guaranteed investment return or government-supported IPO allocation was identified in the reviewed reports
- Overview
- Business
- Financial Highlights
- Industry Overview
- Documentation
Get the Preqt App and keep in touch around the clock!
 Monitor your investments in real-time.
- Receive tailored deal suggestions.
- Get real-time updates and alerts.
