


Elevate Campuses
Building Better CampusesInfrastructure for Education
IPO Summary (PreQT)
Elevate Campuses Limited is an institutionalised education-infrastructure platform that owns, operates and manages on-campus student accommodation for higher education institutions (HEIs) and owns K-12 education assets. The student accommodation business operates under the Good Host Spaces and ScholarZ brands and combines an asset-heavy owned portfolio with an asset-light managed portfolio. As of March 31, 2026, the Pre-Acquisition Group had seven owned student accommodation campuses with 20,368 beds, 14 managed campuses with 55,487 beds and two K-12 assets in Dubai, representing capacity for 80,255 students across 16 cities. Restated FY26 revenue from operations was INR 568.6 Cr, up 53.8% year-on-year, while total income was INR 603.4 Cr. Reported EBITDA was INR 545.0 Cr and PAT was INR 173.8 Cr. The reported FY26 EBITDA margin of 90.3% and PAT margin of 28.8% should be read together with a material exceptional gain: EBITDA before exceptional items was INR 440.1 Cr with a 72.9% margin. Net debt increased to INR 2,712.9 Cr following acquisition-led expansion, taking reported Net Debt / EBITDA to 5.0x; excluding the exceptional gain, the RHP states FY26 Net Debt / EBITDA at 6.2x. The IPO is a 100.0% fresh issue of 5,80,11,049 shares at a price band of INR 343.0-INR 362.0 per share. At the cap, gross proceeds are approximately INR 2,100.0 Cr and post-Issue market capitalisation is approximately INR 6,100.8 Cr. The principal objects are INR 1,100.0 Cr for acquisition of K-12 entities/campuses from promoter-affiliated entities and INR 750.0 Cr for repayment or prepayment of borrowings. There is no offer for sale.
IPO Review Rating
Above Avg
MainboardEnabling Institutions Through Quality Accommodation and Education Infrastructure
Elevate Campuses's strongest attributes are its ~28% FY24–FY26 Revenue CAGR, exceptionally high underlying EBITDA margins, strong operating cash generation and exposure to structurally attractive student-accommodation and education-infrastructure markets.
The main financial weakness is leverage. Gross D/E is approximately 4.3x and Net Debt/EBITDA is 5.0x on reported earnings, rising to about 6.2x after removing the exceptional hostel-sale gain. The INR 750 Cr debt-repayment object therefore has meaningful financial value rather than being merely cosmetic.
Management quality benefits from institutional sponsorship by Hillhouse and professional operating leadership. However, only 33.3% of the Board is independent, and the proposed INR 1,100 Cr promoter-related K-12 acquisition, 52.4% of gross IPO proceeds, is the most important governance monitor. This transaction is independently valued, but its scale makes execution and capital-allocation discipline important.
Valuation is harder to judge than for the other IPOs scored. Using the required methodology, Elevate's post-Issue P/E is 35.1x, but the RHP explicitly states that no directly comparable listed Indian business exists. It would therefore be misleading to manufacture a peer premium or discount. The same limitation applies to EV/EBITDA and P/B peer comparisons.
Overall, the operating platform and industry opportunity are strong enough to support the current score, while high leverage, exceptional-item contribution to FY26 earnings and promoter-related use of proceeds are the principal offsets. The next major swing factors will be the September 22 anchor book and subsequent QIB/overall subscription data.
PARAMETER
WEIGHT
SCORE
KEY FACTORS
Financial Performance
40.0%
4.0/5
Elevate combines strong ~28% Revenue CAGR, very high operating margins, 18.2% RoNW and healthy cash generation. However, acquisition-led leverage is substantial at ~4.3x D/E, while FY26 reported profitability benefited materially from exceptional gains
Show more
Detailed Analysis
Revenue increased from INR 347.0 Cr in FY24 to INR 568.6 Cr in FY26, implying a strong ~28.0% CAGR.
FY26 EBITDA before exceptional items was INR 440.1 Cr with 72.9% RHP-reported margin, indicating exceptional underlying profitability
FY26 PAT was INR 173.8 Cr, equal to ~30.6% of Revenue from Operations; however, earnings benefited materially from exceptional gains
FY26 gross borrowings were INR 4,120.5 Cr against equity of ~INR 956.3 Cr, implying a high ~4.3x D/E
FY26 RoNW improved to 18.2% from 7.1% in FY25
FY26 operating cash flow was INR 297.1 Cr, comfortably exceeding reported PAT
Owned student accommodation contributed 65.7% of FY26 Revenue and geographical concentration remains meaningful
Industry
15.0%
4.0/5
Elevate operates in a high-growth and underpenetrated education-infrastructure segment, with PMSA revenue opportunity growing ~14% and K-12 infrastructure ~19%. Structural demand is attractive, although regulation, institutional-counterparty exposure and capital intensity remain meaningful risks
Show more
Detailed Analysis
PMSA annual revenue potential is projected at ~14.0% CAGR, while K-12 infrastructure opportunity is projected at ~19.2% CAGR
Professionally managed student accommodation is highly underpenetrated in India and remains at an early formalisation stage
Education, land, building, affiliation and fee regulations create meaningful execution and compliance risk
Management
15.0%
3.0/5
Elevate benefits from strong institutional sponsorship and experienced professional management, while promoters retain substantial post-IPO ownership. However, only 33.3% of the Board is independent and the large promoter-related K-12 acquisition creates a meaningful governance and capital-allocation consideration
Show more
Detailed Analysis
Promoters are ultimately backed by Hillhouse Investment, a global alternatives manager with US$90+ Bn AUM and significant real-asset experience
2 of 6 Directors are Independent, 33.3%, including one woman Independent Director
Issuer-level promoter contribution is unpledged, although the ownership of Genius Bidco itself is pledged and certain project disputes remain
INR 1,100 Cr or 52.4% of gross IPO proceeds will fund acquisitions from promoter-affiliated entities
Valuation
20.0%
3.0/5
Elevate's 35.1x post-Issue P/E is meaningful in absolute terms, but a premium/discount conclusion cannot be made because there is no directly comparable listed Indian peer. Strong margins and 18.2% RoNW support valuation, while leverage and exceptional FY26 earnings require caution
Show more
Detailed Analysis
35.1x post-issue P/E, but no directly comparable listed peer exists to calculate a defensible premium/discount
P/E is 35.1 but no directly comparable listed peer set exists; peer premium/discount cannot be reliably calculated
FY26 RoNW is 18.2%, materially improved from 7.1% in FY25, although FY26 PAT contains an exceptional gain
RHP post-Issue NAV is not finalized, instrument conversions also make the historical FY26 NAV unsuitable for a clean post-Issue P/B comparison
Merchant Banker Track Record
10.0%
4.0/5
Elevate is backed by a strong institutional BRLM consortium, with a recent 30-issue sample showing ~17.7% average listing gains and ~76.7% positive openings. The combination materially reduces execution risk for a large INR 2,100 Cr offering
Show more
Detailed Analysis
Last 10 disclosed issues for each BRLM imply a combined ~17.7% average opening return across 30 observations
All three have extensive institutional book-building histories across large Indian mainboard IPOs
23 of 30 recent disclosed issues, or ~76.7%, opened above issue price
TOTAL
100%
3.6/5
Weighted Composite Score
Issue Price
₹343.0 to ₹362.0
As of 19 Sep 2026
GMP
₹16.0
As of 19 Sep 2026
Estimated Gain / Loss
+4.4%
Lot Size
41.0 Shares
Grey Market Premium (GMPs) are shared for knowledge purpose only. PrEqt doesn’t promote or execute the trades.
| Issue Size (in Cr) | |
|---|---|
| Overall | ₹2,100.0 Cr |
| Fresh Issue | ₹2,100.0 Cr |
| Offer for Sale | ₹0.0 Cr |
Minimum Investment
₹14,842.0 / 1,681 shares

Merchant Banker
JM Financial Ltd., IIFL Capital Services
JM Financial Ltd.
IIFL Capital Services
IPO Document
Offer Start Date
Offer End Date
Valuation
Revenue (FY'26)
PAT (FY'26)
Issue Size (in Cr)
Face Value
₹ 1.0Offer Price
₹ 362.0Lot Size
41.0 sharesSale Type
Fresh capital onlyPAT (FY'26)
₹ 173.8 CrPAT Margin (FY'26)
28.8 %P/E Multiple
35.1xEBITDA (FY'26)
₹ 545.0 CrCAGR Growth 3Y
29.0 %ROCE (FY'26)
6.4 %Debt/Equity
4.3xCompany Website
www.elevatecampuses.comExplore new deals
Overview
Fund Allocation
Total: ₹0 CrSource:Company DRHP
Timeline
IPO Open Date
To Be Announced
IPO Close Date
To Be Announced
Tentative Allotment
To Be Announced
Initiation of Refunds
To Be Announced
Credit of Shares to Demat
To Be Announced
Tentative Listing Date
To Be Announced
Business
Business Model
Geographical Presence
Sales Channel
Key Risk Factor
Financial Highlights
Income Statement
Revenue growth with EBITDA and PAT margins
| Financial Metric | FY 2024 | FY 2025 | FY 2026 |
|---|---|---|---|
| Revenue (₹ Cr) | 362.6 | 394.1 | 603.4 |
| Growth (%) | - | 6.6% | 53.8% |
| EBITDA (₹ Cr) | 220.1 | 256.4 | 545.0 |
| EBITDA Margin (%) | 60.7% | 65.1% | 90.3% |
| PAT (₹ Cr) | 39.7 | 49.7 | 173.8 |
| PAT Margin (%) | 10.9% | 12.6% | 28.8% |
OBSERVATIONS & INSIGHTS
Revenue from operations increased 6.6% in FY25 and accelerated 53.8% in FY26 as the platform added managed accommodation and Dubai K-12 assets
EBITDA before exceptional items increased from INR 230.2 Cr in FY24 to INR 440.1 Cr in FY26, with margin improving to 72.9%. · FY26 reported EBITDA of INR 545.0 Cr includes the effect of exceptional items and should not be interpreted as a purely recurring margin of 90.3%.
Reported PAT increased to INR 173.8 Cr in FY26, but the INR 104.9 Cr net exceptional gain materially contributed to the increase
Balance Sheet
| Financial Metric | FY 2024 | FY 2025 | FY 2026 |
|---|---|---|---|
| Net Worth | ₹ 655.8 Cr | ₹ 699.8 Cr | ₹ 956.3 Cr |
| Total Assets | ₹ 2,104.7 Cr | ₹ 2,421.2 Cr | ₹ 5,773.4 Cr |
| Total Borrowing | ₹ 984.7 Cr | ₹ 1,206.6 Cr | ₹ 4,120.5 Cr |
| Reserves & Surplus | ₹ 653.6 Cr | ₹ 697.6 Cr | ₹ 947.5 Cr |
OBSERVATIONS & INSIGHTS
Total assets increased from INR 2,104.7 Cr in FY24 to INR 5,773.4 Cr in FY26, driven principally by acquisition-led growth in investment properties, intangibles and education assets
Non-current borrowings increased to INR 4,003.2 Cr in FY26 from INR 1,183.7 Cr in FY25, materially increasing balance-sheet leverage
Investment properties and investment properties under development together increased to INR 3,908.4 Cr in FY26, making education real estate the dominant asset category
The equity base strengthened to INR 956.3 Cr, but debt grew considerably faster than equity during FY26
Cash Flow
| Financial Metric | FY 2024 | FY 2025 | FY 2026 |
|---|---|---|---|
CFO in Cr Cash generated from core business operations. | +264.5 Cr | +218.7 Cr | +297.1 Cr |
CFI in Cr Cash used in / generated from investing activities. | -119.5 Cr | -104.0 Cr | -3,184.3 Cr |
CFF in Cr Cash from / used in financing activities. | -151.4 Cr | +114.6 Cr | +2,679.5 Cr |
Working Capital
| Efficiency Metric | FY 2023 | FY 2024 | FY 2025 |
|---|---|---|---|
Debtor Days Average number of days taken to collect customer payments. | - | - | - |
Creditor Days Average time taken to pay suppliers and vendors. | - | - | - |
Inventory Days Average number of days inventory remains unsold. | - | - | - |
CCC (Cash Conversion Cycle) (Debtor Days + Inventory Days - Creditor Days) | - | - | - |
Financial Ratios
Measures the company’s leverage relative to shareholder equity.
OBSERVATIONS & INSIGHTS
ROE increased to 18.2% in FY26, while ROCE declined to 6.4% from 9.9% in FY25 as the capital base expanded significantly through acquisitions
FY26 gross borrowings / equity increased to approximately 4.3x and net debt / equity to approximately 2.8x. The IPO debt-repayment object is therefore financially meaningful
the current ratio improved to 1.3x in FY25 but declined to 0.9x in FY26. The business nevertheless benefits from advance collection of student fees, so the ratio should be interpreted together with its cash-collection model
The Company’s interest coverage remained relatively modest at 1.7x in FY24 and FY25, before declining to 1.4x in FY26. The deterioration reflects the significant increase in finance costs following debt-funded acquisitions and portfolio expansionv
Industry Overview
Industry Drivers
Underpenetrated Professionally Managed Student Accommodation
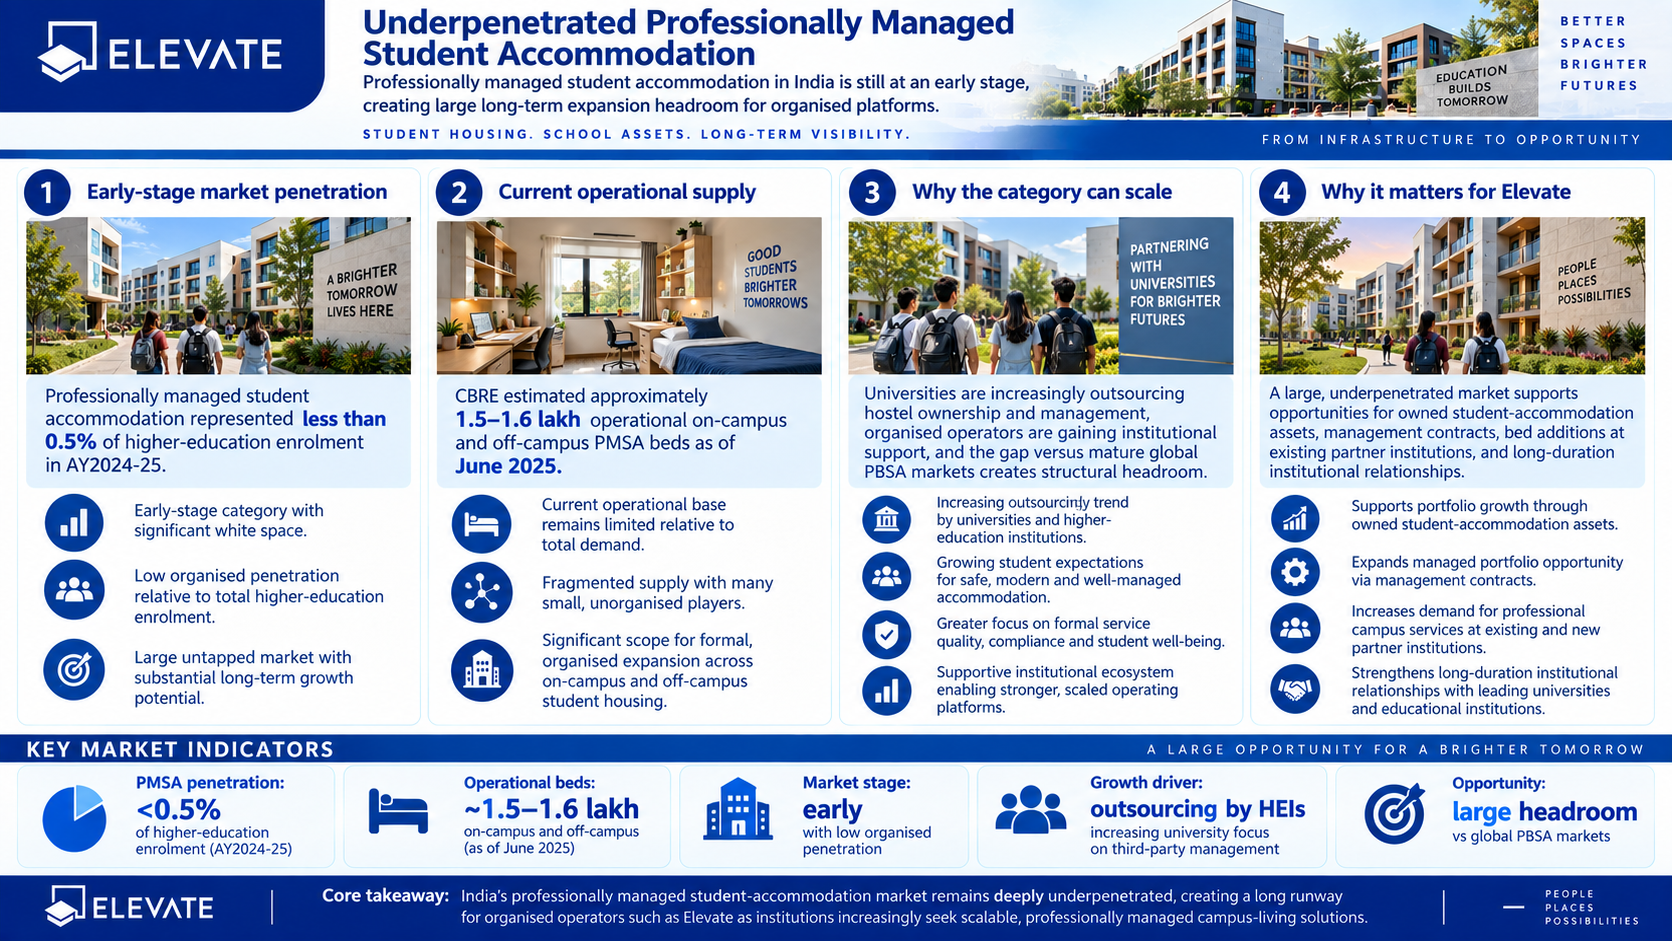
India’s professionally managed student accommodation market remains significantly underpenetrated relative to the size of the higher-education ecosystem. Professionally managed accommodation represented less than 0.5% of higher-education enrolment in AY2024-25, while CBRE estimated only approximately 1.5-1.6 lakh operational on- and off-campus PMSA beds as of June 2025. This large gap between student enrolment and organised accommodation supply creates substantial long-term expansion potential. As universities increasingly outsource hostel development and management, and specialised operators gain institutional capital, professionally managed accommodation can become a larger part of campus infrastructure.
The key points are:
Significant supply gap: Professionally managed accommodation represents less than 0.5% of higher-education enrolment, indicating substantial room for organised capacity expansion
Limited organised inventory: India had only approximately 1.5-1.6 lakh PMSA beds as of June 2025 despite a large student population
University outsourcing: Institutions are increasingly evaluating specialised partners for hostel development, ownership and professional management
Higher-Education Enrolment and Private-Sector Expansion
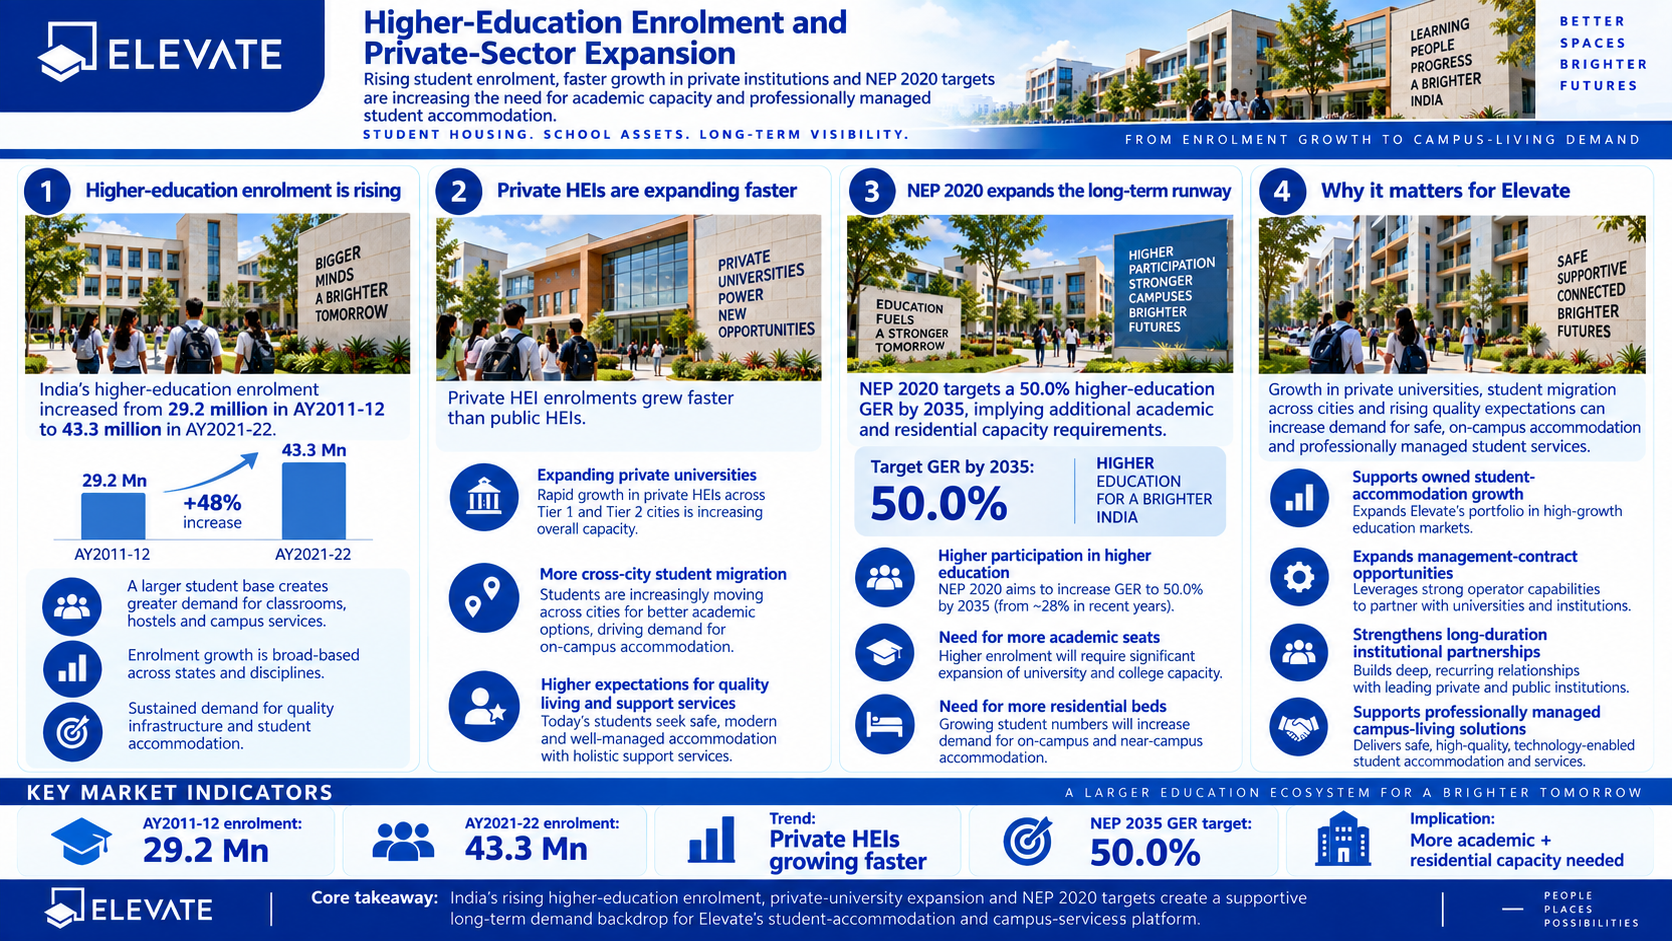
India’s expanding higher-education ecosystem is creating a larger addressable market for student accommodation and related campus infrastructure. Higher-education enrolment increased from approximately 29.2 million in AY2011-12 to 43.3 million in AY2021-22, supported by rising participation, new institutions and improving access to tertiary education. NEP 2020 targets a 50.0% higher-education Gross Enrolment Ratio by 2035, which would require significant expansion in academic capacity and supporting infrastructure.
The key points are:
Rising student enrolment: Higher-education enrolment increased from 29.2 million to 43.3 million between AY2011-12 and AY2021-22
NEP-led expansion: The 50.0% GER target by 2035 implies substantial additional academic and student-infrastructure requirements
Private-sector growth: Expansion of private universities and colleges is increasing opportunities for professionally developed campus infrastructure
Shift Toward Private, National and International K-12 Schools
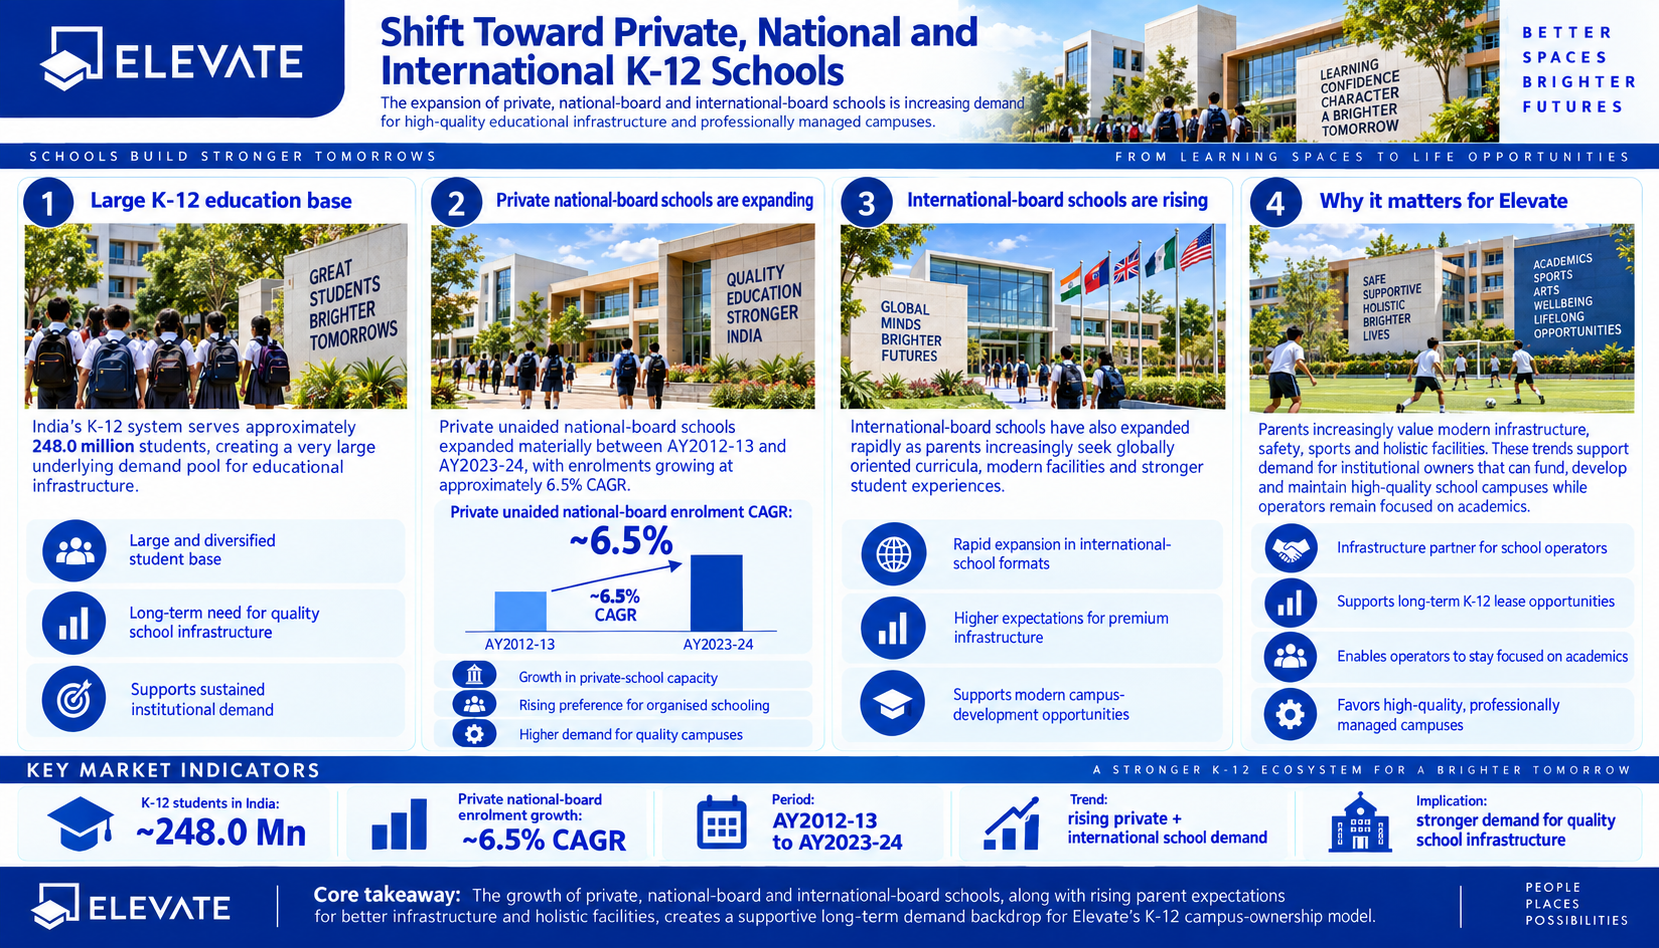
India’s large K-12 education market is gradually shifting toward private, national-board and international-board institutions that increasingly compete on academic quality as well as infrastructure. The K-12 system serves approximately 248.0 million students, providing a significant underlying base for institutional expansion. Private unaided national-board schools recorded enrolment growth of approximately 6.5% CAGR between AY2012-13 and AY2023-24, while international-board schools have also expanded rapidly. Parents are increasingly evaluating schools based on safety, modern classrooms, sports facilities, technology, accessibility and overall campus experience.
The key points are:
Large addressable market: India’s K-12 education system serves approximately 248.0 million students, creating significant underlying infrastructure demand
Private-school expansion: Private unaided national-board school enrolments grew at approximately 6.5% CAGR between AY2012-13 and AY2023-24
International-school growth: Rising demand for international curricula is supporting expansion of premium and globally benchmarked school infrastructure
Risks in the Industry
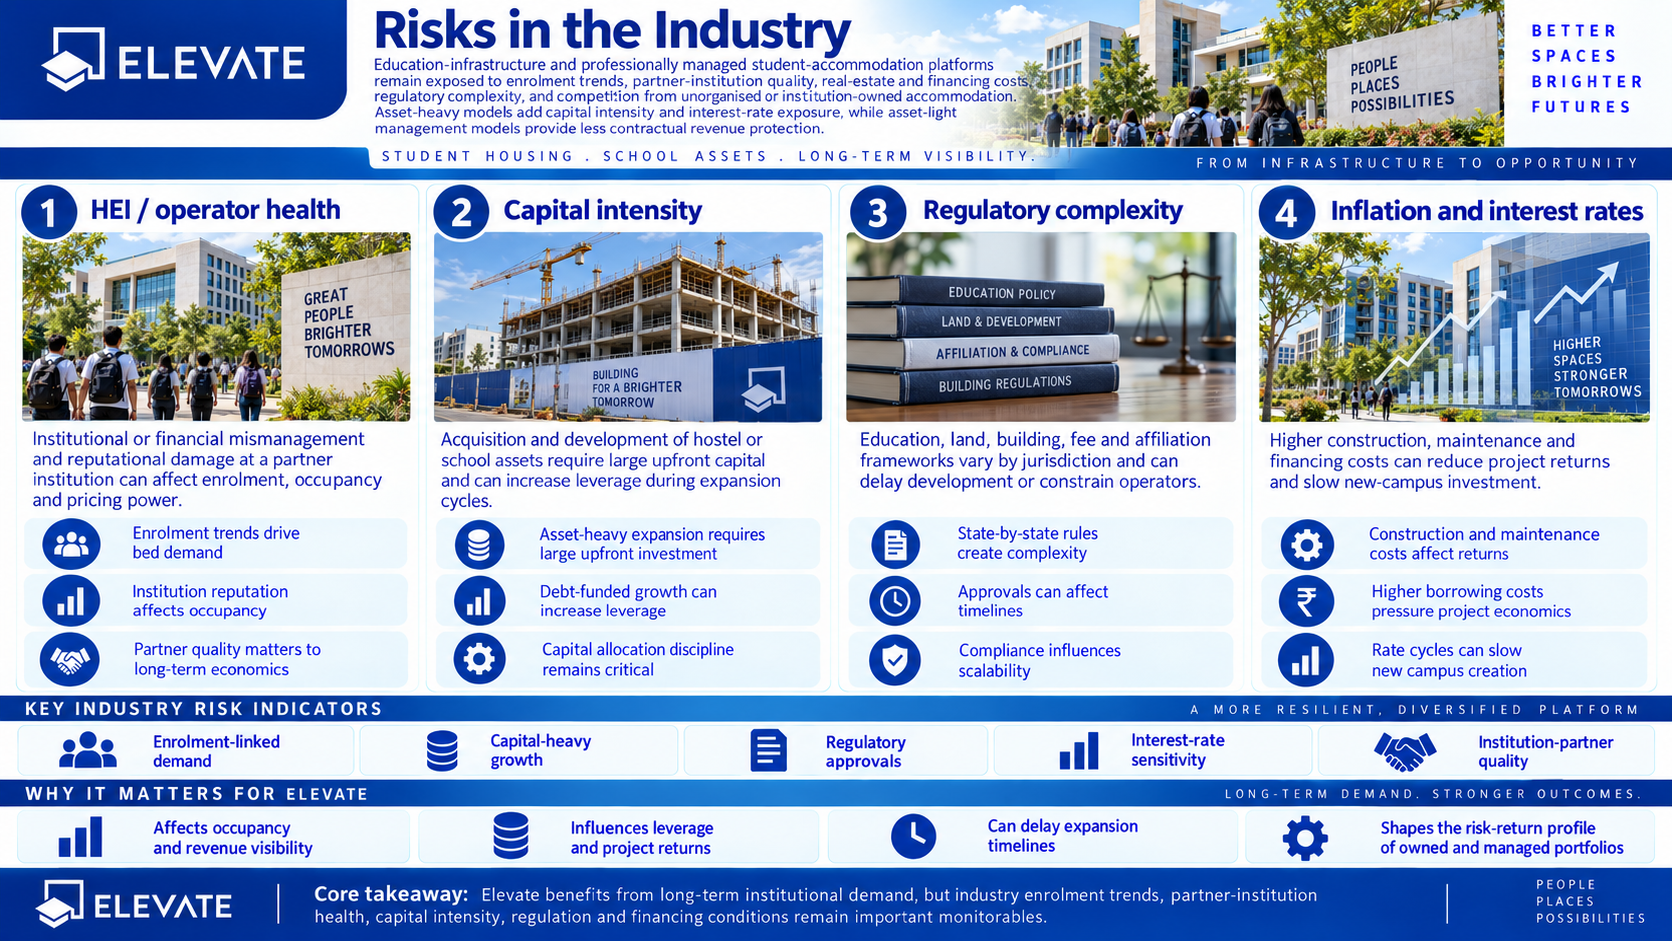
The education-infrastructure and PMSA segments are exposed to education enrolment trends, the financial and reputational health of partner institutions, real-estate acquisition and financing costs, regulatory requirements, and competition from unorganised or institution-owned accommodation. Asset-heavy models add capital intensity and interest-rate exposure, while asset-light management models provide less contractual revenue protection.
The key risks are:
HEI / operator health: institutional or financial mismanagement and reputational damage at a partner institution can affect enrolment and occupancy
Capital intensity: acquisition of hostel or school assets requires large upfront capital and can increase leverage during expansion cycles
Regulatory complexity: education, land, building, fee and affiliation frameworks vary by jurisdiction and can delay development or constrain operators
Inflation and interest rates: higher construction, maintenance and financing costs can reduce project returns and slow new-campus investment
Government Policy Support
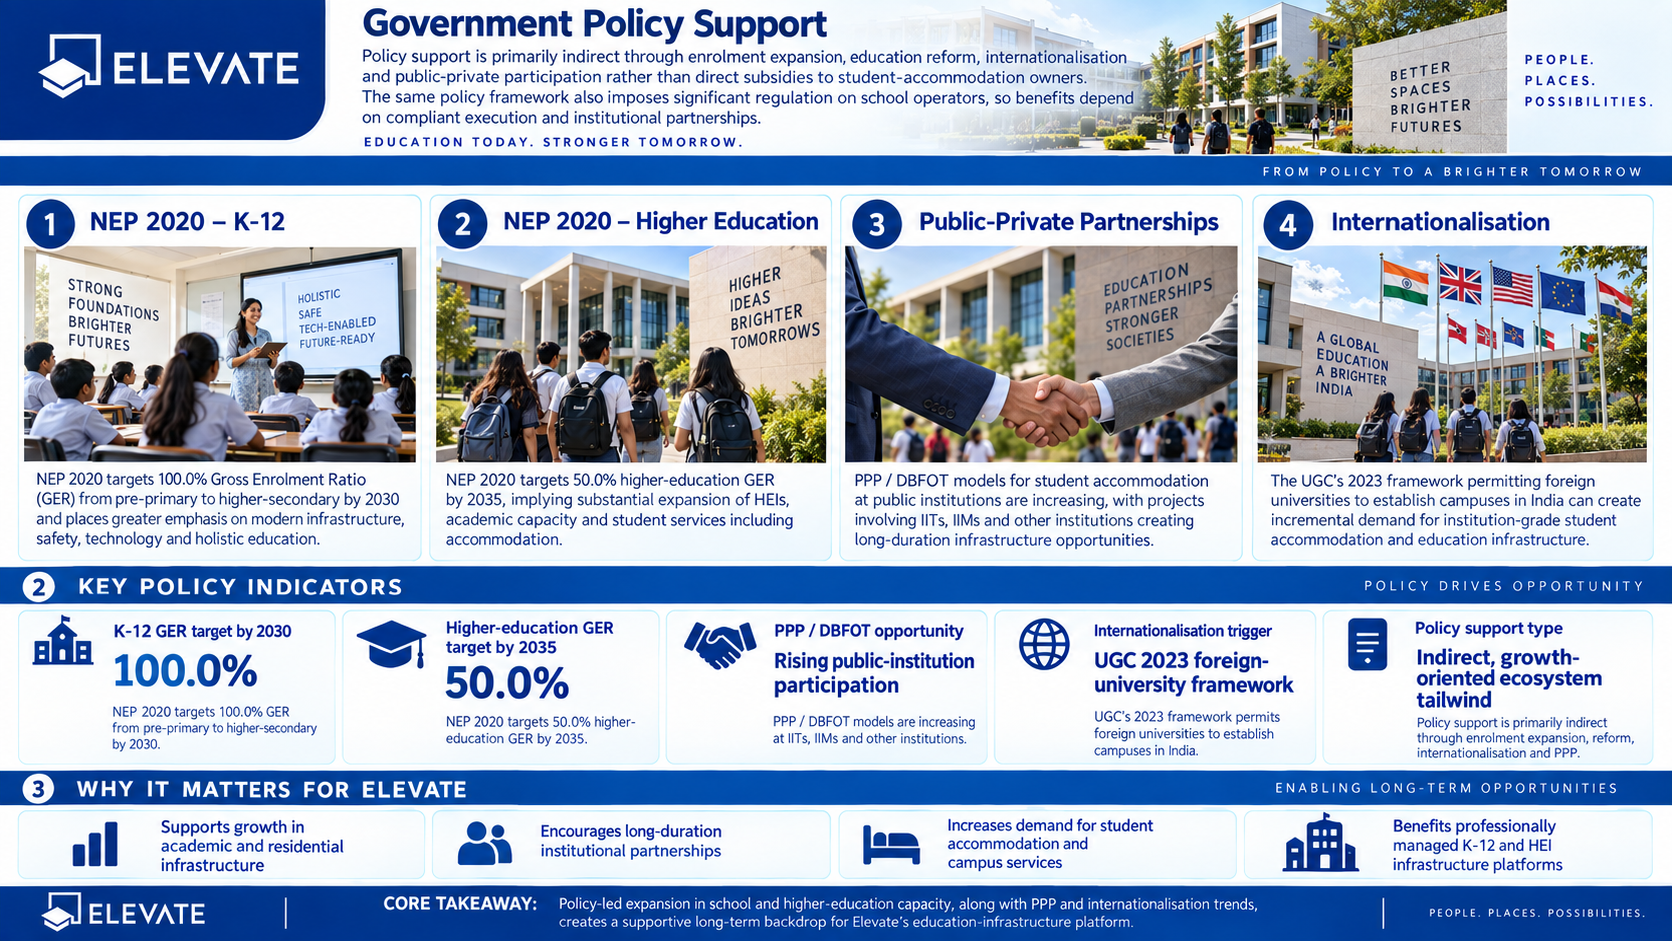
Policy support is primarily indirect through enrolment expansion, education reform, internationalisation and public-private participation rather than direct subsidies to student-accommodation owners. The same policy framework also imposes significant regulation on school operators, so benefits depend on compliant execution and institutional partnerships.
The key policies are:
NEP 2020 - K-12: NEP 2020 targets 100.0% Gross Enrolment Ratio (GER) from pre-primary to higher-secondary education by 2030. The policy places greater emphasis on improving school infrastructure, safety standards, technology integration and holistic learning, supporting long-term demand for better-quality education facilities and professionally managed campus infrastructure
NEP 2020 - Higher Education: NEP 2020 targets a 50.0% GER in higher education by 2035, requiring substantial expansion in universities, colleges, academic capacity and supporting infrastructure. Higher student enrolment can increase demand for institution-grade hostels, student accommodation, campus services and other education-linked real-estate infrastructure
Public-Private Partnerships: CBRE highlights increasing adoption of PPP and DBFOT models for student accommodation and education infrastructure, particularly at public institutions. Projects involving IITs, IIMs and other institutions can create long-duration opportunities for private operators to finance, develop, own, operate and maintain student housing and related campus assets
Internationalisation of Higher Education: The UGC’s 2023 framework allowing eligible foreign universities to establish campuses in India can support incremental demand for high-quality academic and residential infrastructure. Entry of international institutions may increase the requirement for professionally managed student accommodation, modern campus facilities and internationally benchmarked education infrastructure
Fundraise/Future Plans
Shareholding
Pre-issue shareholding
Promoter Holding 0.0%
Post-Issue Shareholding
Promoter Holding 0.0%
Category
Pre-Issue%Post-Issue%
Promoters
Genius Bidco Holdings Pte. Ltd
80.0%52.5%
Genius Rajkot Investment Holdings Pte. Ltd.
20.0%13.1%
Total Promoter Holding
100.0%65.6%
Additional Shareholders
0.0%0.0%
Total Additional Holding
0.0%0.0%
Total Shareholding
100.0%65.6%
- Overview
- Business
- Financial Highlights
- Industry Overview
- Fundraise/Future Plans
- Documentation
Get the Preqt App and keep in touch around the clock!
 Monitor your investments in real-time.
- Receive tailored deal suggestions.
- Get real-time updates and alerts.
