


ESDS Software Solution
Powering Digital InfrastructureDriving Digital Transformation
IPO Summary (PrEqT)
ESDS Software Solution Limited is an AI-enabled cloud, managed-services, data-centre infrastructure and software-solutions provider operating five Tier-3 data centres across India and serving 2,501 customers in FY26. FY26 revenue from operations reached INR 472.2 Cr, EBITDA margin expanded to 49.6% and PAT reached INR 120.8 Cr, while foreign revenue rose to 25.5% of sales. The IPO is a 100% fresh issue of 1,67,83,216 shares; at INR 429.0, post-issue market capitalisation is approximately INR 5,028.4 Cr and FY26 diluted P/E is about 36.3x. The investment case combines strong margin expansion, low financial debt, rising managed-services mix and exposure to cloud/AI/data-centre growth, offset by customer concentration, government exposure, rapid technology change, large capex requirements and a FY26 cash balance materially influenced by a customer advance for a GPUaaS project.
IPO Review Rating
Strong Buy
MainboardEnabling Businesses Through Sovereign, Secure, and Scalable Digital Infrastructure
ESDS has delivered strong financial growth, with Revenue increasing from INR 286.5 Cr in FY24 to INR 472.2 Cr in FY26, representing a 28.4% CAGR. Profitability has improved substantially, with EBITDA increasing from INR 101.9 Cr in FY24 to INR 234.2 Cr in FY26 and EBITDA Margin expanding from 35.6% to 49.6%. PAT increased from INR 13.6 Cr in FY24 to INR 120.8 Cr in FY26, while PAT Margin expanded from 4.8% to 25.6%, reflecting significant operating leverage. The balance sheet is strong, with D/E improving from 0.7x in FY24 to 0.1x in FY26, while ROE increased from 6.2% to 25.1% over the same period. ESDS benefits from exposure to high-growth cloud, data-centre and AI/GPU infrastructure markets, while international Revenue has increased to 25.5% of FY26 Revenue. Management has 20+ years of IT-sector experience, while the INR 720.0 Cr IPO is entirely fresh issue with INR 0.0 Cr OFS, indicating no promoter monetisation through the issue. Governance is broadly adequate, although pending civil litigation involving claims of INR 14.3 Cr and INR 4.2 Cr, GST-related proceedings and meaningful RPT exposure remain key monitorables. Overall, ESDS presents a strong operating and industry-growth profile, but future returns will depend on sustaining high margins, converting the proposed INR 576.0 Cr infrastructure investment into profitable growth and justifying the premium valuation through continued earnings expansion.
PARAMETER
WEIGHT
SCORE
KEY FACTORS
Financial Performance
40.0%
5.0/5
ESDS has an unusually strong financial profile with 28.4% revenue CAGR, 49.6% EBITDA margin, 25.6% PAT margin, 25.1% ROE and only 0.1x D/E.
Show more
Detailed Analysis
Revenue increased from INR 286.5 Cr in FY24 to INR 361.3 Cr in FY25 and INR 472.2 Cr in FY26, implying a FY24-FY26 CAGR of 28.4%
EBITDA increased from INR 101.9 Cr to INR 234.2 Cr, while EBITDA margin expanded from 35.6% in FY24 to 49.6% in FY26
PAT increased from INR 13.6 Cr in FY24 to INR 120.8 Cr in FY26, with PAT margin expanding from 4.8% to 25.6%
D/E improved from 0.7x in FY24 to 0.1x in FY25 and 0.1x in FY26
ROE increased from 6.2% in FY24 to 17.3% in FY25 and 25.1% in FY26
OCF was INR 162.6 Cr in FY25 and INR 1,367.7 Cr in FY26. FY26, however, was materially boosted by a large customer advance
The largest FY26 customer represented 15.9% of revenue, although Top-10 concentration remains materially higher
Industry
15.0%
5.0/5
ESDS benefits from one of the strongest sector backdrops in the current IPO universe, supported by 23%+ cloud growth, ~50% cloud-GPU growth, data localisation and IndiaAI-linked compute demand.
Show more
Detailed Analysis
India's cloud-services market is projected to grow at 23.6% CAGR from FY25-FY30, while the cloud-GPU market is projected at approximately 50.2% CAGR
AI/GPU cloud remains at an early development stage in India, with demand scaling rapidly from a relatively low installed base
IndiaAI, data-centre policy and localisation support demand, while DPDP and cybersecurity obligations increase compliance requirements
Management
15.0%
4.0/5
Management has 20+ years of promoter operating experience and zero OFS, however the Company has exactly 50% Board independence, approximately 10.5% RPT exposure and pending civil/tax matters.
Show more
Detailed Analysis
Piyush Somani has 20+ years of IT-sector experience and has led ESDS since incorporation
3 of 6 Directors are Independent, giving exactly 50.0% independent representation
No promoter pledge is disclosed, however a former-employee share-entitlement suit and a GST proceeding remain pending
FY26 RPT value was approximately 10.5% of revenue, down from 24.2% in FY25
Valuation
20.0%
4.0/5
Valuation is the most nuanced section. 36.3x historical P/E and 8.1x P/B are not cheap, however ESDS's 22.8% RoNW, strong margins, and apparently favourable EV/EBITDA comparison provide support.
Show more
Detailed Analysis
ESDS trades at approximately 36.3x FY26 diluted earnings, but the RHP's sole listed accounting peer, E2E Networks, reported negative FY26 PAT and EPS, so a like-for-like FY26 P/E discount/premium cannot be calculated meaningfully
ESDS is approximately 16.3x versus current E2E EV/EBITDA of approximately 54.2x, implying a peer/ESDS ratio of approximately 3.3x
INR 429.0 divided by FY26 NAV of INR 52.7 gives approximately 8.1x P/B
FY26 RoNW was 22.8%
Merchant Banker Track Record
10.0%
4.0/5
The BRLM combination of DAM Capital Advisors and Systematix Corporate Services provides a reasonably established IPO execution track record, with recent disclosed issues showing an average listing-day return of approximately 8.3% and a positive-listing success rate of around 62.5%.
Show more
Detailed Analysis
Across the 16 issue-level observations disclosed for the two BRLMs, average opening return is approximately 8.3%
DAM-led Caliber Mining was subscribed 146.6x, while Systematix-led Behari Lal Engineering was subscribed 108.4x
10 of the 16 disclosed issue-level observations opened above issue price, implying an approximate 62.5% positive-listing rate
DAM has a relatively deep recent IPO franchise, while Systematix has a smaller but active track record
TOTAL
100%
4.5/5
Weighted Composite Score
Issue Price
₹408.0 to ₹429.0
As of 29 Aug 2026
GMP
₹245.0
As of 29 Aug 2026
Estimated Gain / Loss
+57.1%
Lot Size
34.0 Shares
Grey Market Premium (GMPs) are shared for knowledge purpose only. PrEqt doesn’t promote or execute the trades.
| Issue Size (in Cr) | |
|---|---|
| Overall | ₹720.0 Cr |
| Fresh Issue | ₹720.0 Cr |
| Offer for Sale | ₹0.0 Cr |
Minimum Investment
₹14,586.0 / 1,156 shares

Merchant Banker
Dam Capital Advisors Ltd.; Systematix Corporate Services
IPO Document
RHP / Anchor Document
Offer Start Date
28th Aug 2026
Offer End Date
1st Sept 2026
Valuation
₹5,028.4 Cr
Revenue (FY'26)
₹480.7 Cr
PAT (FY'26)
₹120.8 Cr
Issue Size (in Cr)
₹720.0 Cr
Face Value
₹ 1.0Offer Price
₹ 429.0Lot Size
34.0 sharesSale Type
Fresh capital onlyPAT (FY'26)
₹ 120.8 CrPAT Margin (FY'26)
25.6 %P/E Multiple
36.3xEBITDA (FY'26)
₹ 234.2 CrCAGR Growth 2Y
28.4 %ROE (FY'26)
25.1 %ROCE (FY'26)
32.8 %Price to Book Value
8.1xDebt/Equity
0.1xCompany Website
www.esds.co.inExplore new deals
Overview
Fund Allocation
Total: ₹0 CrSource:Company DRHP
Timeline
IPO Open Date
To Be Announced
IPO Close Date
To Be Announced
Tentative Allotment
To Be Announced
Initiation of Refunds
To Be Announced
Credit of Shares to Demat
To Be Announced
Tentative Listing Date
To Be Announced
Business
Business Model
Geographical Presence
Sales Channel
Key Risk Factor
Financial Highlights
Income Statement
Revenue growth with EBITDA and PAT margins
| Financial Metric | FY 2024 | FY 2025 | FY 2026 |
|---|---|---|---|
| Revenue (₹ Cr) | 292.1 | 376.6 | 480.7 |
| Growth (%) | - | 26.1% | 30.7% |
| EBITDA (₹ Cr) | 101.9 | 154.9 | 234.2 |
| EBITDA Margin (%) | 35.6% | 42.9% | 49.6% |
| PAT (₹ Cr) | 13.6 | 55.6 | 120.8 |
| PAT Margin (%) | 4.8% | 15.4% | 25.6% |
OBSERVATIONS & INSIGHTS
Revenue grew 26.1% in FY25 and 30.7% in FY26. FY24-FY26 CAGR was approximately 28.4%, supported by customer growth, managed-services scale-up and higher foreign revenue
EBITDA increased from INR 101.9 Cr in FY24 to INR 234.2 Cr in FY26 as revenue scaled and the service mix shifted toward higher-value managed operations
PAT increased from INR 13.6 Cr in FY24 to INR 120.8 Cr in FY26 as EBITDA growth was combined with lower finance costs and stronger operating leverage
Balance Sheet
| Financial Metric | FY 2024 | FY 2025 | FY 2026 |
|---|---|---|---|
| Net Worth | ₹ 226.5 Cr | ₹ 417.6 Cr | ₹ 544.2 Cr |
| Total Assets | ₹ 547.7 Cr | ₹ 656.0 Cr | ₹ 1,937.9 Cr |
| Total Borrowing | ₹ 149.0 Cr | ₹ 62.7 Cr | ₹ 42.9 Cr |
| Reserves & Surplus | ₹ 216.6 Cr | ₹ 407.5 Cr | ₹ 533.6 Cr |
OBSERVATIONS & INSIGHTS
Total Equity increased from INR 226.5 Cr in FY24 to INR 544.2 Cr in FY26, strengthening the capital base ahead of the IPO
Total Assets increased moderately through FY25 and then nearly tripled to INR 1,937.9 Cr in FY26, primarily because cash rose sharply following the GPUaaS advance
Total Borrowings declined from INR 149.0 Cr in FY24 to INR 42.9 Cr in FY26, driving Debt/Equity down to 0.1x
Reserves & Surplus increased to INR 533.6 Cr in FY26 on the back of retained profits and prior equity issuance
Cash Flow
| Financial Metric | FY 2024 | FY 2025 | FY 2026 |
|---|---|---|---|
CFO (₹ Cr) Cash generated from core business operations. | +53 Cr | +162.6 Cr | +1,367.7 Cr |
CFI (₹ Cr) Cash used for investments and long-term assets. | -1.4 Cr | -109.3 Cr | -131.2 Cr |
CFF (₹ Cr) Cash flow related to funding and borrowings. | -66.4 Cr | +7.5 Cr | -44.7 Cr |
Working Capital
| Efficiency Metric | FY 2023 | FY 2024 | FY 2025 |
|---|---|---|---|
Debtor Days Average number of days taken to collect customer payments. | - | - | - |
Creditor Days Average time taken to pay suppliers and vendors. | - | - | - |
Inventory Days Average number of days inventory remains unsold. | - | - | - |
CCC (Cash Conversion Cycle) (Debtor Days + Inventory Days - Creditor Days) | - | - | - |
Financial Ratios
Measures the company’s leverage relative to shareholder equity.
OBSERVATIONS & INSIGHTS
ROE improved from 6.2% to 25.1% as PAT expanded substantially faster than the equity base
Debt / Equity reduced from 0.66x in FY24 to 0.08x in FY26 as borrowings declined and retained earnings/equity strengthened
Interest Coverage Ratio increased from 3.2x to 19.9x because EBITDA expanded while finance costs declined materially
Current Ratio improved in FY25 but fell to 1.16x in FY26 because a large customer advance was classified within current liabilities; the decline does not reflect a conventional liquidity squeeze
ROA increased sharply through FY25 and remained around 9.3% in FY26; FY26 asset growth was dominated by cash received in advance, which diluted incremental asset efficiency
ROCE improved from 14.5% to 32.8%, demonstrating stronger earnings generation from capital employed
Industry Overview
Industry Drivers
Cloud Adoption and Enterprise Digital Transformation
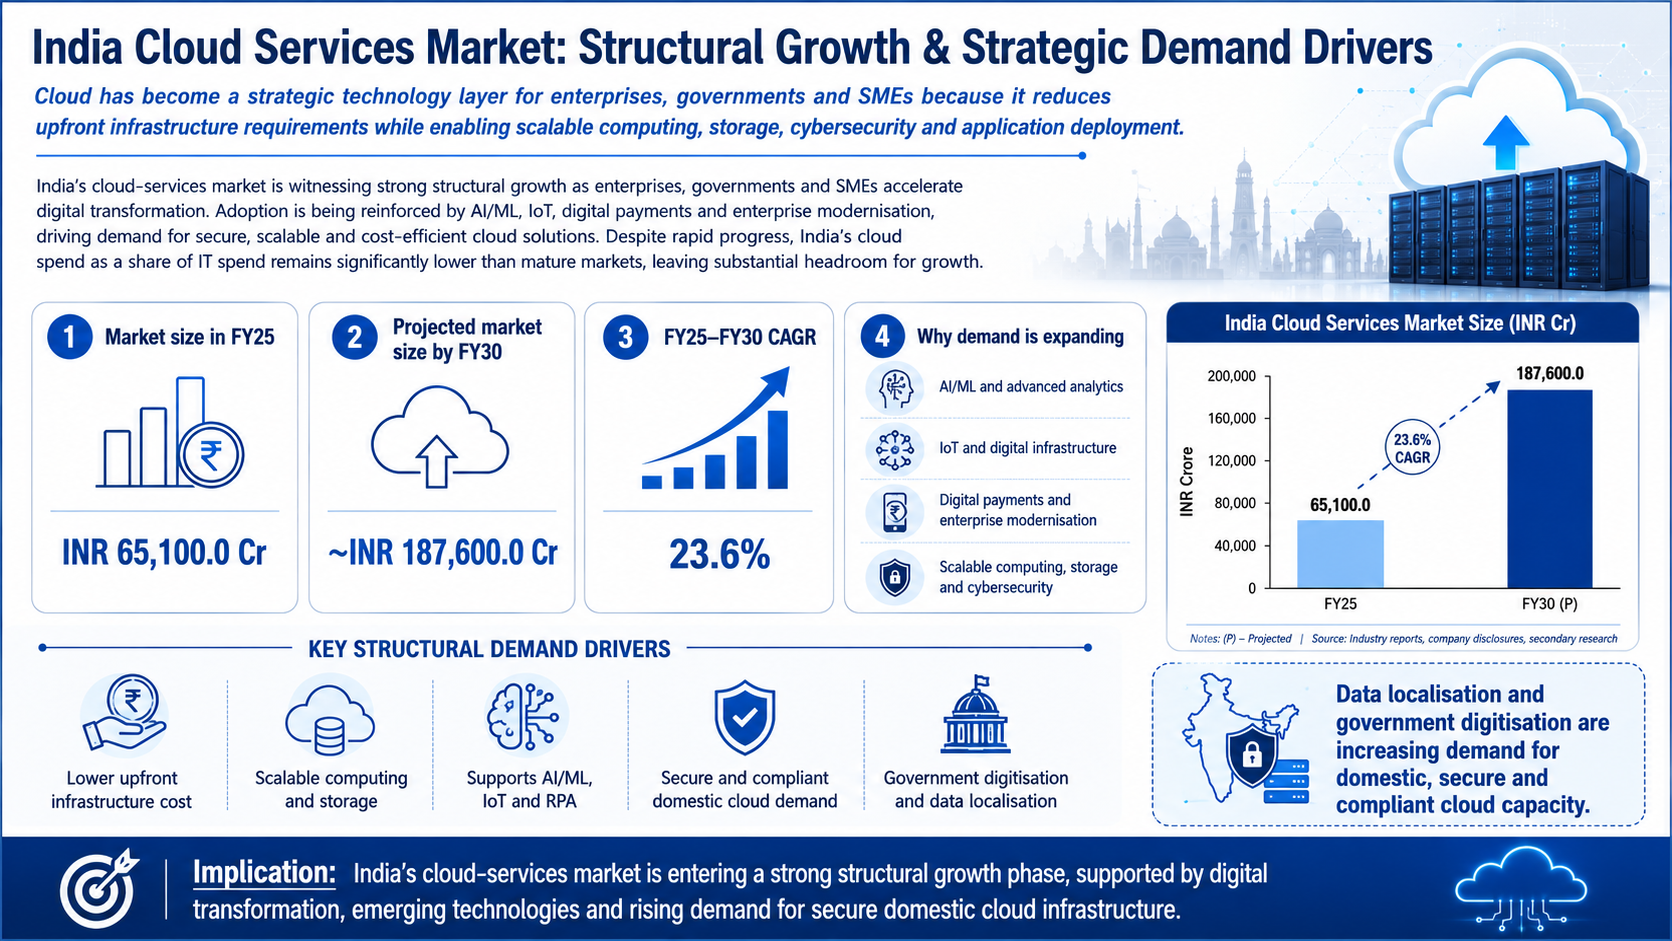
Cloud has become a strategic technology layer for enterprises, governments and SMEs because it reduces upfront infrastructure requirements while enabling scalable computing, storage, cybersecurity and application deployment. Adoption is being reinforced by AI/ML, IoT, digital payments and enterprise modernisation, while India still has room to close the cloud-spending gap versus mature markets.
The key details are:
The market is projected to reach approximately INR 187,600.0 Cr by FY30, implying a 23.6% CAGR from FY25
Cloud infrastructure underpins AI/ML, IoT, robotic process automation and other emerging technologies
Data localisation and government digitisation are increasing demand for domestic, secure and compliant cloud capacity
Data-Centre Capacity Expansion and Data Consumption
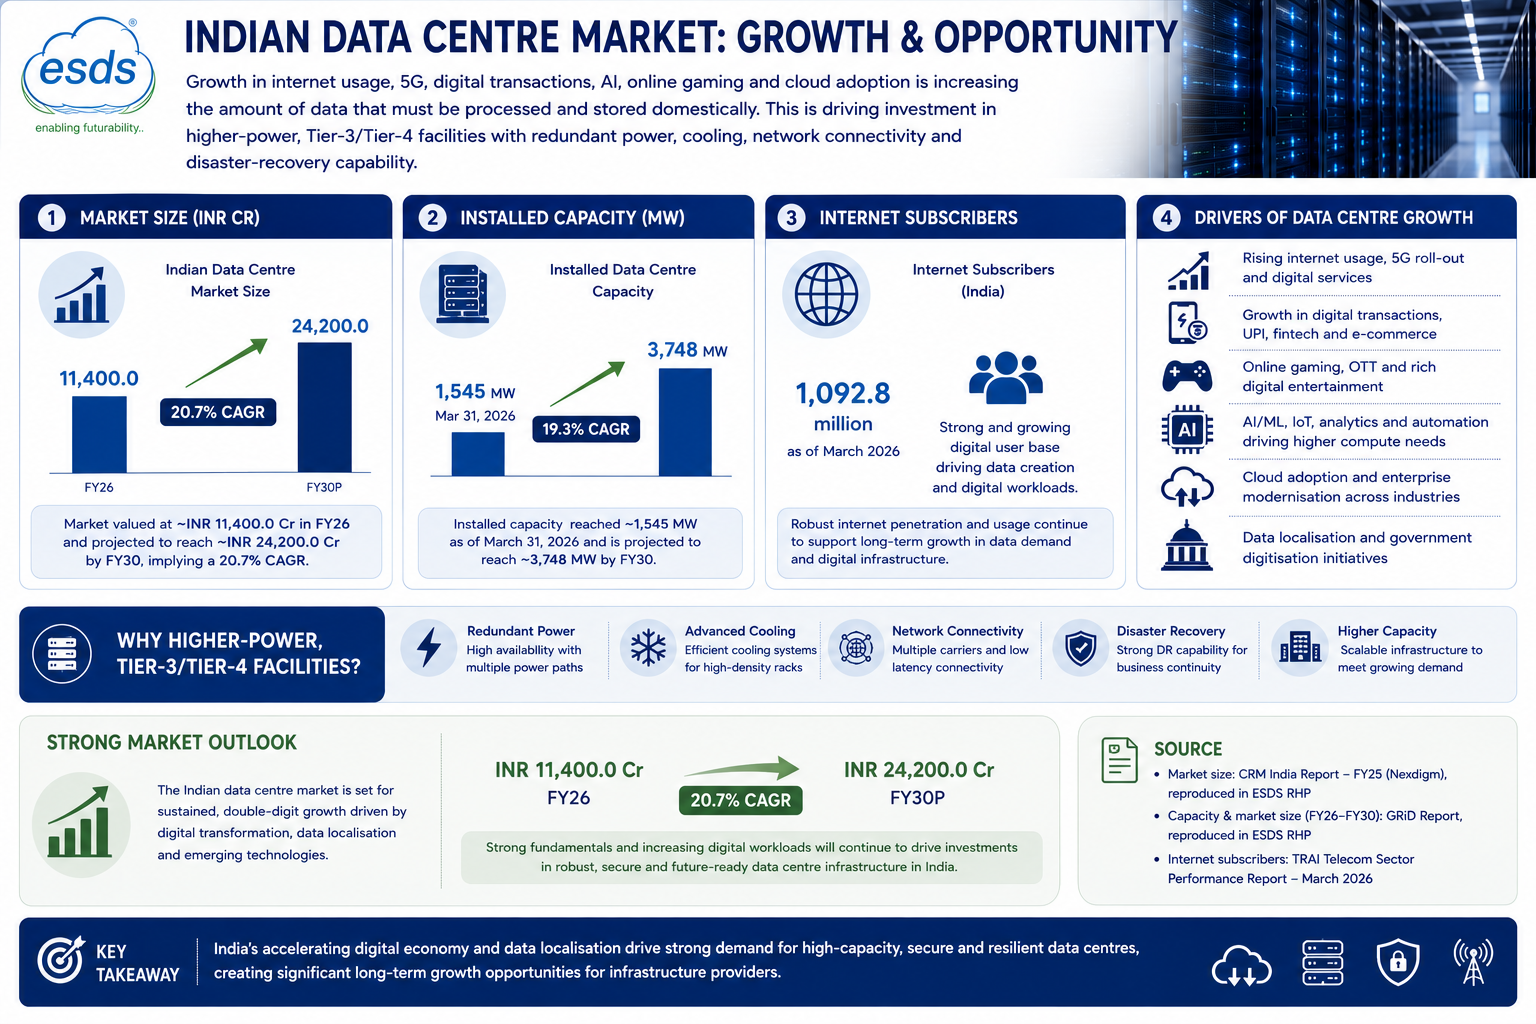
Growth in internet usage, 5G, digital transactions, AI, online gaming and cloud adoption is increasing the amount of data that must be processed and stored domestically. This is driving investment in higher-power, Tier-3/Tier-4 facilities with redundant power, cooling, network connectivity and disaster-recovery capability.
The key details are:
The Indian data-centre market was valued at approximately INR 11,400.0 Cr in FY26
The market is projected to reach approximately INR 24,200.0 Cr by FY30, implying a 20.7% CAGR from FY26
Installed data-centre capacity reached approximately 1,545 MW as of March 31, 2026 and is projected to reach approximately 3,748 MW by FY30
Internet subscribers were approximately 1,092.8 million as of March 2026, supporting continued growth in data creation and digital workloads
Managed Services, Cybersecurity and Complexity of Hybrid IT
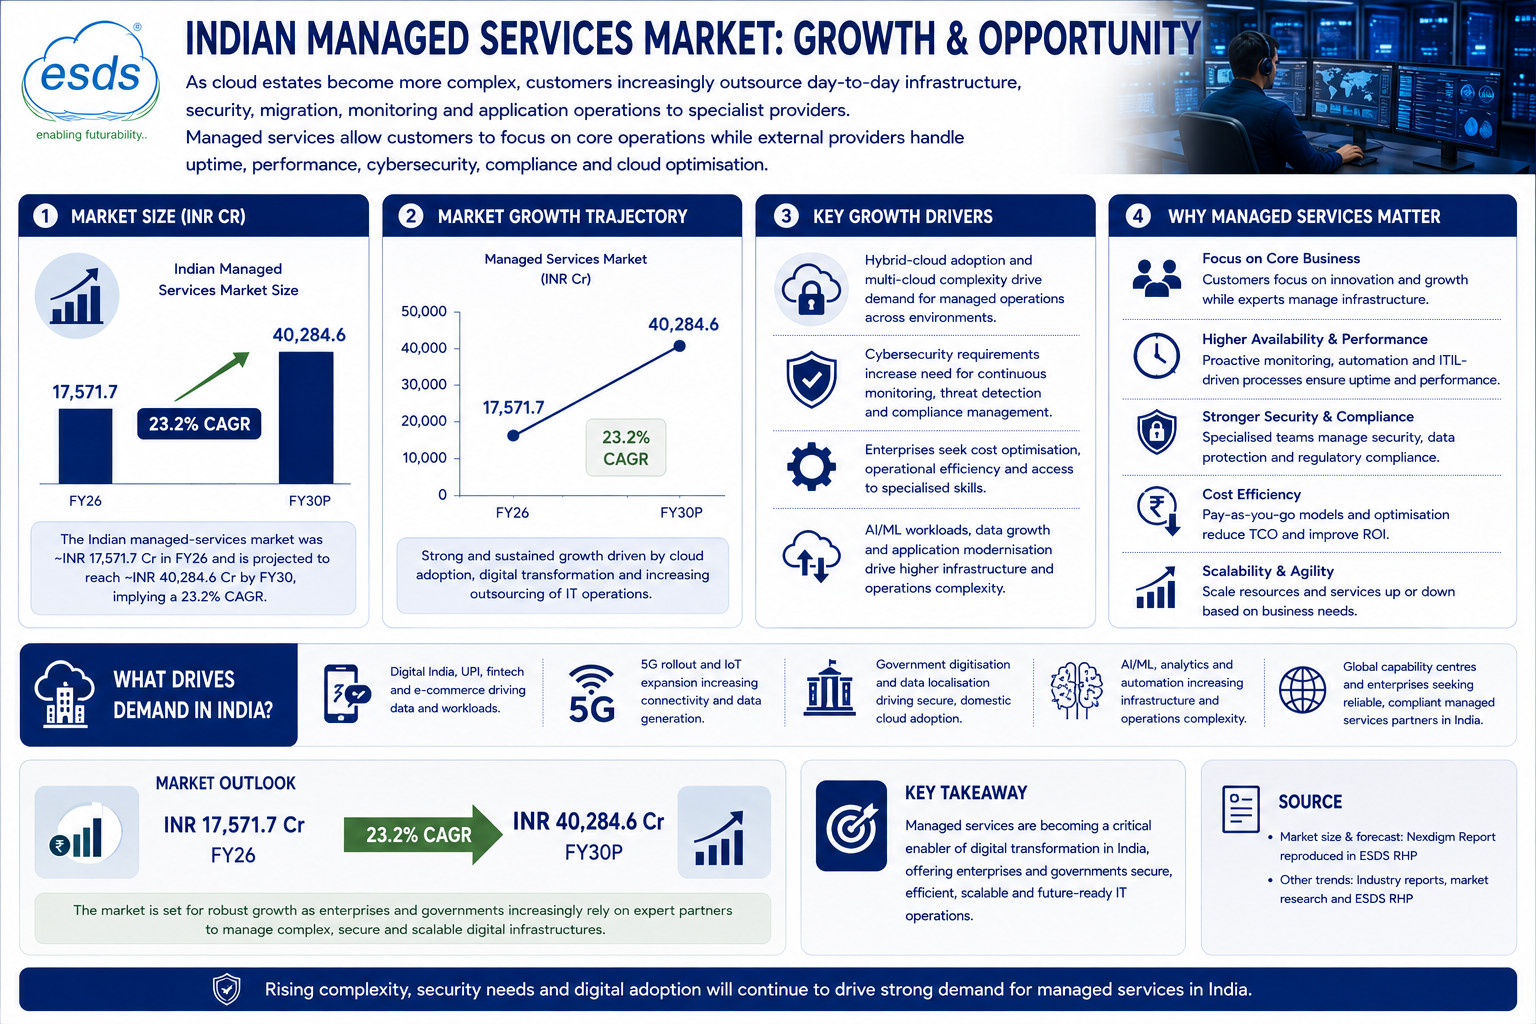
As cloud estates become more complex, customers increasingly outsource day-to-day infrastructure, security, migration, monitoring and application operations to specialist providers. Managed services allow customers to focus on core operations while external providers handle uptime, performance, cybersecurity, compliance and cloud optimisation.
The key details are:
The Indian managed-services market was approximately INR 17,571.7 Cr in FY26
The market is projected to reach approximately INR 40,284.6 Cr by FY30, implying a 23.2% CAGR from FY26
Hybrid-cloud adoption and cybersecurity requirements increase demand for continuous monitoring and specialised managed operations
Rising cyber threats increase the value of secure, resilient data-centre and cloud architectures
Risks in the Industry
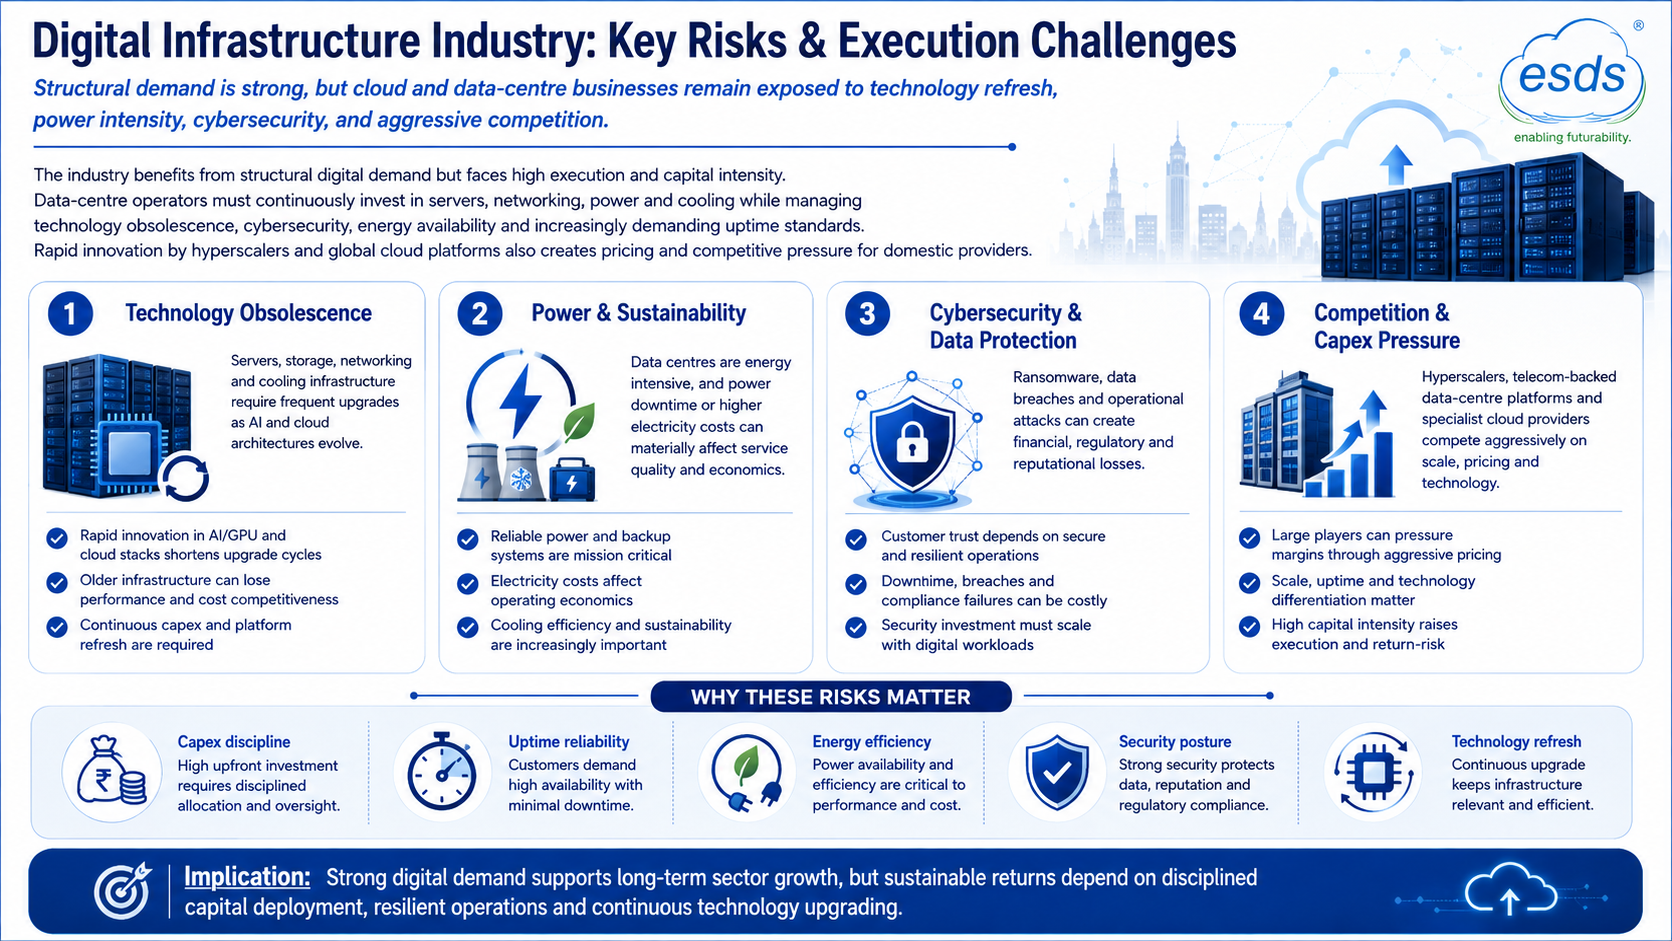
The industry benefits from structural digital demand but faces high execution and capital intensity. Data-centre operators must continuously invest in servers, networking, power and cooling while managing technology obsolescence, cybersecurity, energy availability and increasingly demanding uptime standards. Rapid innovation by hyperscalers and global cloud platforms also creates pricing and competitive pressure for domestic providers.
The key risks are:
Technology obsolescence: Servers, storage, networking and cooling infrastructure require frequent upgrades as AI and cloud architectures evolve
Power and sustainability: Data centres are energy intensive, and power downtime or higher electricity costs can materially affect service quality and economics
Cybersecurity and data protection: Ransomware, data breaches and operational attacks can create financial, regulatory and reputational losses
Competition and capex: Hyperscalers, telecom-backed data-centre platforms and specialist cloud providers compete aggressively on scale, pricing and technology
Government Policy Support
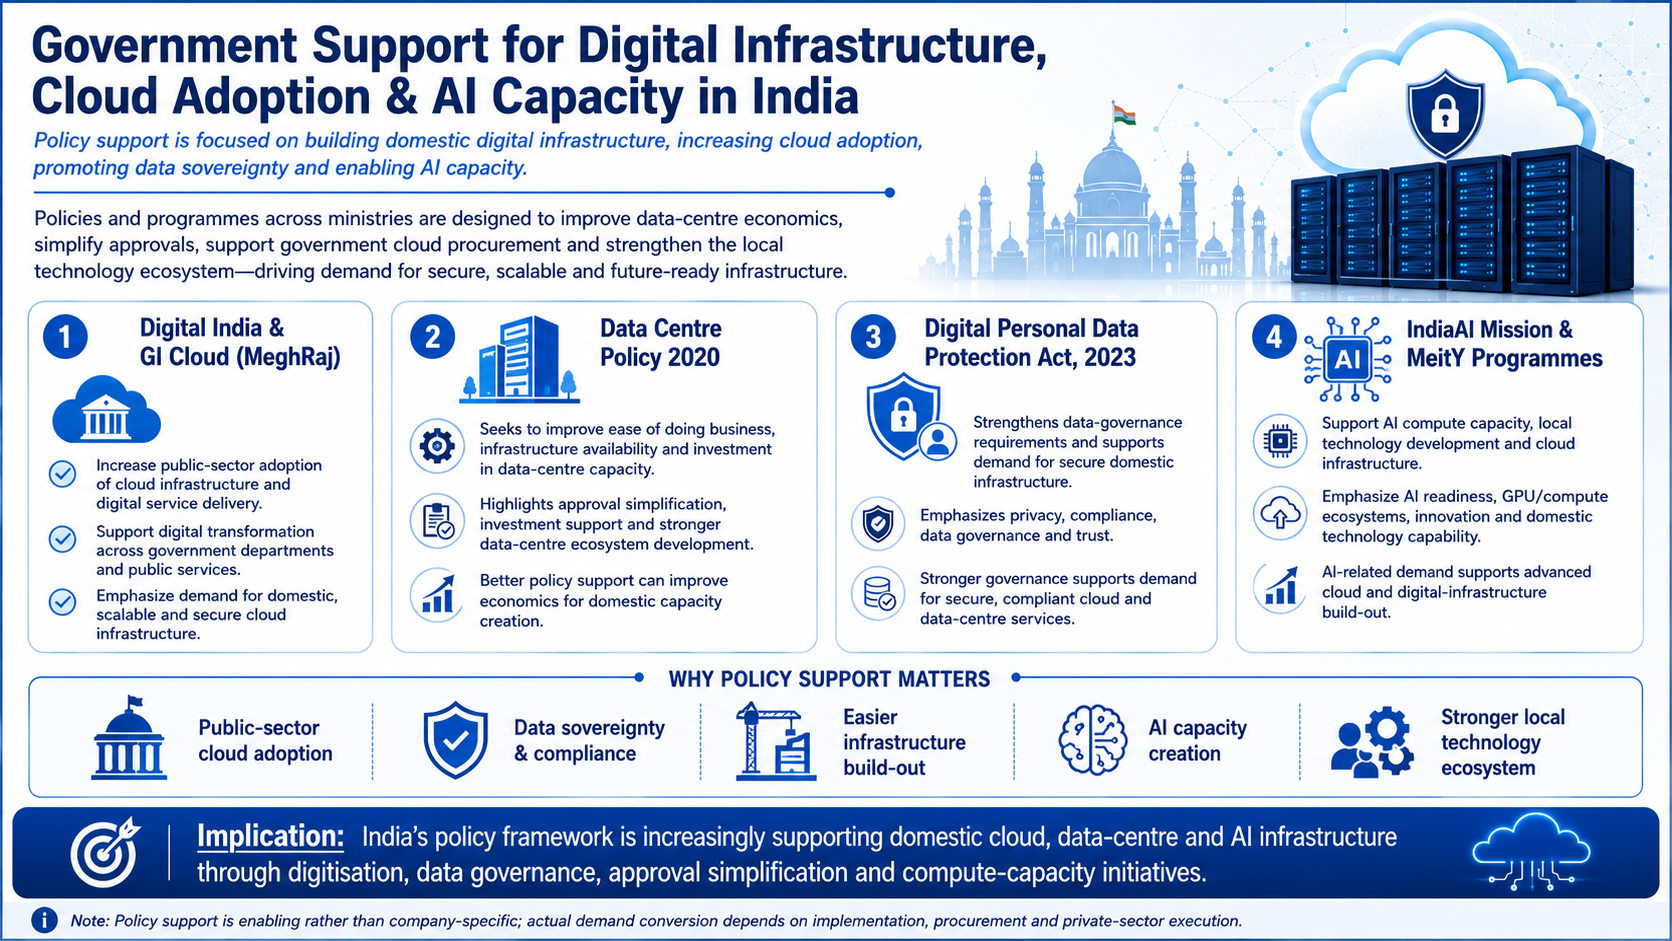
Government support is focused on building domestic digital infrastructure, increasing cloud adoption, promoting data sovereignty and enabling AI capacity. Policies and programmes seek to improve data-centre economics, simplify approvals, support government cloud procurement and strengthen the local technology ecosystem.
The key policies are:
Digital India and GI Cloud (MeghRaj) increase public-sector adoption of cloud infrastructure and digital service delivery
The Data Centre Policy 2020 seeks to improve ease of doing business, infrastructure availability and investment in data-centre capacity
The Digital Personal Data Protection Act, 2023 strengthens data-governance requirements and supports demand for secure domestic infrastructure
The IndiaAI Mission and related MeitY programmes support AI compute capacity, local technology development and cloud infrastructure
Fundraise/Future Plans
Shareholding
Pre-issue shareholding
Promoter Holding 0.0%
Post-Issue Shareholding
Promoter Holding 0.0%
Category
Pre-Issue%Post-Issue%
Promoters
Piyush Prakashchandra Somani
24.5%21.0%
P.O. Somani Family Trust
11.2%9.6%
Komal Piyush Somani
10.1%8.7%
Total Promoter Holding
45.8%39.3%
Additional Shareholders
0.0%0.0%
Total Additional Holding
0.0%0.0%
Total Shareholding
45.8%39.3%
- Overview
- Business
- Financial Highlights
- Industry Overview
- Fundraise/Future Plans
- Documentation
Get the Preqt App and keep in touch around the clock!
 Monitor your investments in real-time.
- Receive tailored deal suggestions.
- Get real-time updates and alerts.
