


Gaja Alternative Asset Management
Capital for AmbitionPartnering Beyond Capital
IPO Summary (PrEqT)
Gaja Alternative Asset Management Limited is an India-focused alternative asset manager with a two-decade investment track record across private equity and a newly established secondaries strategy. Its economics combine recurring management fees, performance-linked carried interest and returns on sponsor commitments; FY26 total income was INR 157.8 Cr, EBITDA was INR 72.1 Cr and PAT was INR 82.0 Cr. The IPO comprises a fresh issue of 2,81,25,000 shares and an OFS of 62,50,000 shares; at INR 160, the post-issue market capitalisation is approximately INR 2,256.2 Cr and FY26 P/E is 22.3x. The investment case combines structural AIF growth, a global LP franchise and historical fund performance with material earnings lumpiness from carried interest, LP concentration, key-person dependence, high sponsor-capital exposure and weak recent operating cash conversion.
IPO Review Rating
Buy
MainboardInvesting in High-Growth Businesses Shaping India’s Economic Future
Gaja has a strong operating financial profile. FY26 revenue from operations was INR 135.5 Cr, EBITDA INR 72.1 Cr and PAT INR 82.0 Cr, while D/E was only 0.07x and ROE stood at 16.5%. The earnings mix is another important monitorable. FY26 carried interest of INR 75.4 Cr exceeded management-fee income of INR 60.1 Cr. Therefore, Gaja's reported PAT is more performance-sensitive and potentially lumpier than that of a conventional mutual-fund AMC. The industry backdrop is strong, with Indian AIF commitments compounding around 29–30% and significant further penetration expected. The IPO structure is also favourable: INR 450.0 Cr of the INR 550.0 Cr offer is fresh capital. The Company proposes to deploy approximately INR 372.0 Cr primarily towards Sponsor Commitments to Fund IV, the proposed Fund V and its Secondaries Fund, along with repayment of the bridge loan.
PARAMETER
WEIGHT
SCORE
KEY FACTORS
Financial Performance
40.0%
4.0/5
Financial quality is strong overall: very high margins, low leverage and healthy ROE.
Show more
Detailed Analysis
Revenue from operations increased from INR 95.6 Cr in FY24 to INR 122.0 Cr in FY25 and INR 135.5 Cr in FY26, translating into a FY24–FY26 CAGR of approximately 19.0%
FY26 EBITDA stood at INR 72.1 Cr against revenue from operations of INR 135.5 Cr, implying an EBITDA margin of approximately 53.2%
FY26 PAT stood at INR 82.0 Cr, while the Company's disclosed PAT margin was 51.9%, improving from 43.0% in FY24
FY26 borrowings were only INR 41.6 Cr against net worth of INR 606.5 Cr, resulting in a D/E ratio of 0.1x
FY26 ROE was 16.5%, compared with 17.2% in FY25 and 14.5% in FY24
Carried interest from Gaja Capital Fund I Limited was INR 68.3 Cr, representing 50.4% of FY26 revenue from operations
Industry
15.0%
4.0/5
The industry is a major strength of the IPO. Structural penetration remains low, while AIF commitments are compounding around 30%. The principal offset is the highly regulated and highly competitive nature of the business.
Show more
Detailed Analysis
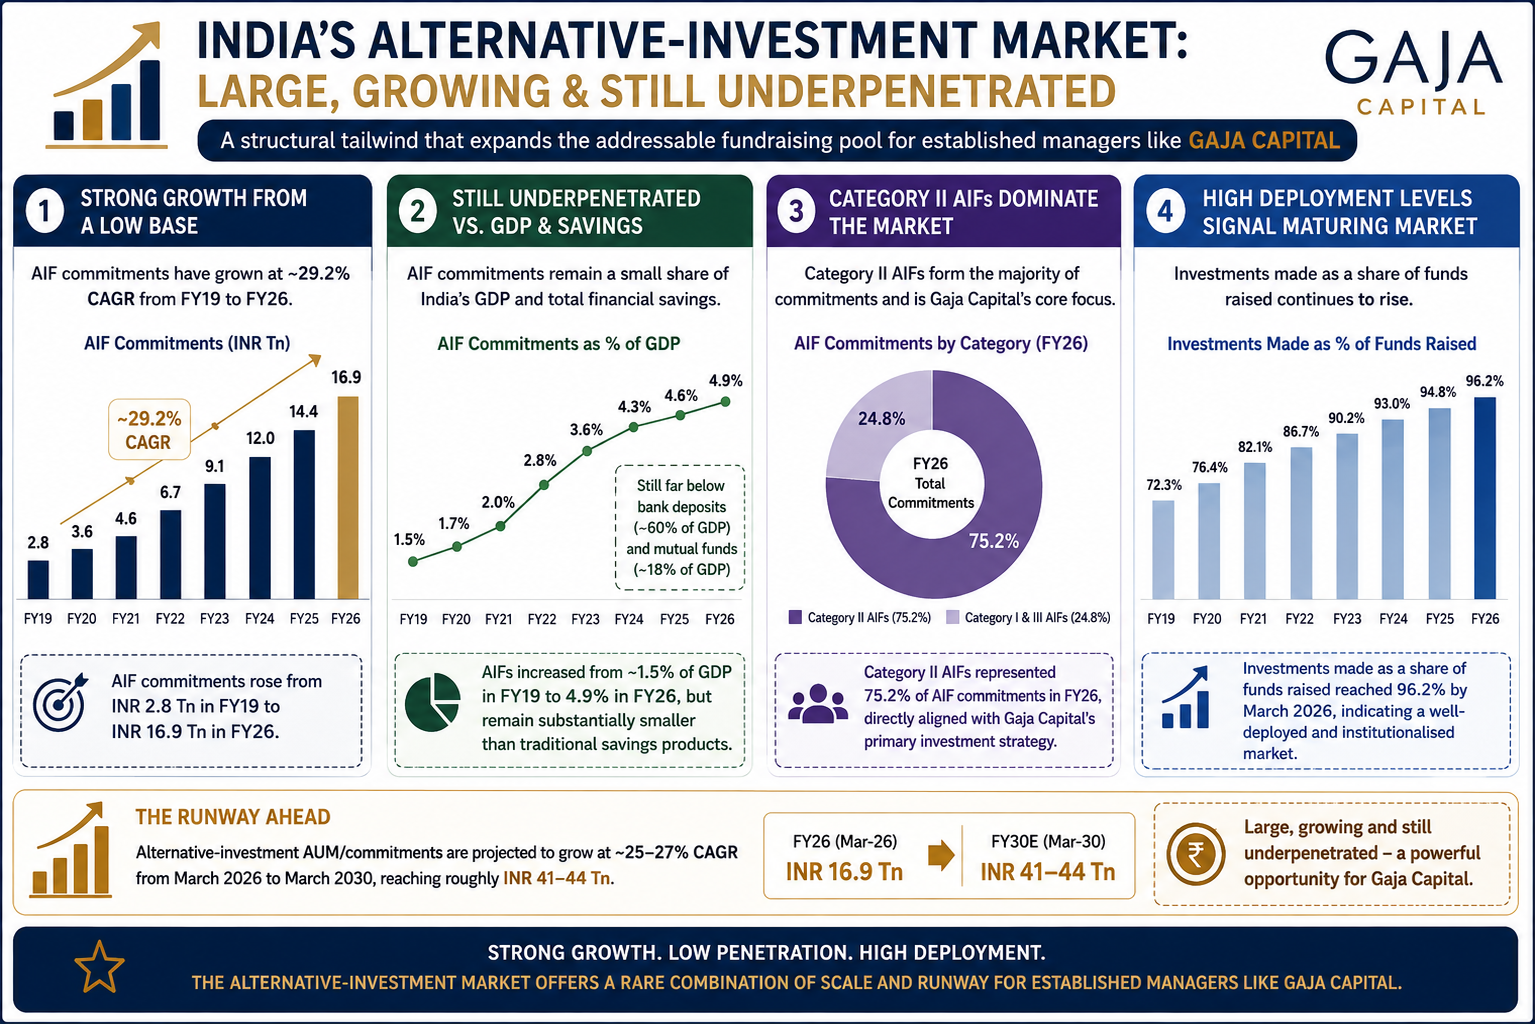
AIF commitments grew at approximately 29.2% CAGR between FY19 and FY26, reaching approximately INR 16.9 Tn by March 2026
Indian alternatives remain underpenetrated despite rapid AIF adoption, with institutional, UHNI and HNI participation continuing to expand
The market includes PE funds, venture funds, traditional AMCs, wealth managers and global alternative managers
AIFs and their managers are subject to SEBI registration, sponsor-commitment, fund-structure, private-placement and ongoing compliance requirements
Offshore funds increasingly allocate capital to India through domestic AMCs, while Gaja itself advises offshore India-focused investment vehicles
Management
15.0%
4.0/5
Management experience and investment track record are strong. Governance deductions arise primarily from very high mechanically reported RPT intensity, only 33.3% Board independence, partial promoter selling and disclosed promoter litigation.
Show more
Detailed Analysis
Gopal Jain has 27+ years, Ranjit Shah 19+ years, and Imran Jafar 27+ years, including approximately 20 years in private equity for Imran. Promoters also have listed-company board exposure
The Board has 9 Directors, of which 3 are Independent Directors, representing 33.3%
he RHP confirms promoter shares are not pledged; however, criminal complaints involving Gopal Jain and Imran Jafar and certain promoter-related civil/regulatory matters remain disclosed
Promoters are partially monetising but the IPO remains primarily primary capital: OFS is INR 100.0 Cr, or 18.2% of the INR 550.0 Cr issue, while Fresh Issue represents 81.8%
Valution
20.0%
4.0/5
The Company is being offered at a large P/E discount to listed peers, while EV/EBITDA is also below the selected proxy average. The principal counterpoint is that Gaja's earnings mix contains substantially more carried interest than a traditional AMC, meaning its current PAT should not necessarily receive the same valuation multiple as a highly recurring management-fee franchise.
Show more
Detailed Analysis
At INR 160.0, Gaja's FY26 P/E is approximately 22.3x versus the RHP-disclosed peer average of 43.5x, representing a discount of approximately 48.7%
Gaja is approximately 24.7x, versus an average of approximately 28.1x across five usable RHP-disclosed listed proxies; peer/Gaja multiple is approximately 1.1x
INR 160.0 divided by FY26 NAV of INR 53.7 gives approximately 3.0x P/B
FY26 RoNW stood at 13.1%
81.8% of the INR 550.0 Cr issue is Fresh Issue, while only 18.2% is OFS
Merchant Banker Track Record
10.0%
5.0/5
The BRLM syndicate is a clear positive, with strong recent demand-generation capability and positive representative listing performance.
Show more
Detailed Analysis
Representative recent execution has produced healthy listing outcomes: The two selected IPOs generated an average listing gain of approximately 11.8%
Representative average subscription was approximately 40.3x
Both representative offerings listed above issue price: 2/2, implying a 100.0% positive listing-opening rate
Both JM Financial and IIFL Capital are established mainboard BRLMs with extensive recent IPO execution records
TOTAL
100%
4.1/5
Weighted Composite Score
Issue Price
₹152.0 to ₹160.0
As of 29 Aug 2026
GMP
₹18.5
As of 29 Aug 2026
Estimated Gain / Loss
+11.6%
Lot Size
93.0 Shares
Grey Market Premium (GMPs) are shared for knowledge purpose only. PrEqt doesn’t promote or execute the trades.
| Issue size | |
|---|---|
| Overall | ₹550.0 Cr |
| Fresh Issue | ₹450.0 Cr |
| Offer for Sale | ₹100.0 Cr |
Minimum Investment
₹14,880.0 / 8,649 shares

Merchant Banker
JM Financial Ltd.; IIFL Capital
Offer Start Date
19th Aug 2026
Offer End Date
21st Aug 2026
Valuation
₹2,256.2 Cr
Revenue (FY'26)
₹157.8 Cr
PAT (FY'26)
₹82.0 Cr
Issue Size
₹550.0 Cr
Face Value
₹ 5.0Offer Price
₹ 160.0Lot Size
93.0 sharesSale Type
Fresh capital cum OFSPAT (FY'26)
₹ 82.0 CrPAT Margin (FY'26)
51.9 %P/E Multiple
22.3xEBITDA (FY'26)
₹ 72.1 CrCAGR Growth 3Y
23.2 %ROE (FY'26)
16.5 %ROCE (FY'26)
16.8 %Price to Book Value
3.0xDebt/Equity
0.1xCompany Website
www.gajacapital.comExplore new deals
Overview
Fund Allocation
Total: ₹0 CrSource:Company DRHP
Timeline
IPO Open Date
To Be Announced
IPO Close Date
To Be Announced
Tentative Allotment
To Be Announced
Initiation of Refunds
To Be Announced
Credit of Shares to Demat
To Be Announced
Tentative Listing Date
To Be Announced
Business
Business Model
Geographical Presence
Sales Channel
Key Risk Factor
Financial Highlights
Income Statement
Revenue growth with EBITDA and PAT margins
| Financial Metric | FY 2024 | FY 2025 | FY 2026 |
|---|---|---|---|
| Revenue (₹ Cr) | 104.0 | 123.3 | 157.8 |
| Growth (%) | - | 27.6% | 11.1% |
| EBITDA (₹ Cr) | 49.3 | 60.8 | 72.1 |
| EBITDA Margin (%) | 47.4% | 49.3% | 45.7% |
| PAT (₹ Cr) | 44.7 | 62.0 | 82.0 |
| PAT Margin (%) | 43.0% | 50.2% | 51.9% |
OBSERVATIONS & INSIGHTS
Revenue rose 27.6% in FY25 and 11.1% in FY26. FY26 growth was slower because management/advisory fees were broadly stable while carry rose more moderately than in FY25
PAT increased from INR 44.7 Cr in FY24 to INR 82.0 Cr in FY26, a ~35.3% CAGR, supported by higher carried interest and sponsor-investment income
FY26 PAT margin on total income increased to 51.9%, but EBITDA margin on total income moderated to 45.7% as employee, finance and operating costs rose while part of income sat below the operating-fee line
Balance Sheet
| Financial Metric | FY 2024 | FY 2025 | FY 2026 |
|---|---|---|---|
| Net Worth | ₹ 334.0 Cr | ₹ 393.5 Cr | ₹ 613.3 Cr |
| Total Assets | ₹ 388.6 Cr | ₹ 451.9 Cr | ₹ 706.5 Cr |
| Total Borrowing | ₹ 0.3 Cr | ₹ 0.4 Cr | ₹ 34.2 Cr |
| Reserves & Surplus | ₹ 333.9 Cr | ₹ 393.5 Cr | ₹ 556.9 Cr |
OBSERVATIONS & INSIGHTS
Total assets increased 56.3% in FY26 to INR 706.5 Cr, driven primarily by higher investments, cash/bank balances, other financial assets and IPO-related/current assets
Total equity increased to INR 613.3 Cr from INR 393.5 Cr following share issuance, retained earnings and NCI; this enlarged base moderates ROE despite strong PAT growth
Cash Flow
| Financial Metric |
|---|
Working Capital
| Efficiency Metric | FY 2023 | FY 2024 | FY 2025 |
|---|---|---|---|
Debtor Days Average number of days taken to collect customer payments. | - | - | - |
Creditor Days Average time taken to pay suppliers and vendors. | - | - | - |
Inventory Days Average number of days inventory remains unsold. | - | - | - |
CCC (Cash Conversion Cycle) (Debtor Days + Inventory Days - Creditor Days) | - | - | - |
Financial Ratios
Measures the company’s leverage relative to shareholder equity.
OBSERVATIONS & INSIGHTS
Gross borrowings increased materially to INR 41.6 Cr in FY26 from INR 4.0 Cr in FY25, lifting debt/equity to ~0.1x; however the Group remained in a substantial net-cash position after cash and bank balances
Current ratio remained strong at 6.5x in FY26 despite declining from 9.18x, reflecting a very liquid balance sheet relative to near-term obligations
Interest coverage reduced to ~22.8x in FY26 as finance cost increased to INR 4.0 Cr, but absolute coverage remains high and leverage is modest versus equity
ROCE recovered to 16.8% in FY26 from 14.9% in FY25, while ROE moderated to 16.5% as the equity base expanded substantially following share issuance and retained earnings
Industry Overview
Industry Drivers
Industry Tailwind: Alternative Assets Remain Underpenetrated Despite Rapid AIF Growth
India's alternative-investment market is scaling from a low base relative to household and institutional financial savings. The RHP-incorporated CRISIL update shows AIF commitments rising from INR 2.8 Tn in FY19 to INR 16.9 Tn in FY26, a ~29.2% CAGR, while AIF commitments were still only about 4.9% of GDP. This combination of strong growth and underpenetration directly expands the addressable fundraising pool for established managers such as Gaja.
The key tailwinds are:
Alternative-investment AUM/commitments are projected to grow at approximately 25-27% CAGR from March 2026 to March 2030, reaching roughly INR 41-44 Tn
AIFs increased from approximately 1.5% of GDP in FY19 to 4.9% in FY26, but remain substantially smaller than deposits and traditional managed products
Category II AIFs represented 75.2% of AIF commitments in FY26, directly relevant because Gaja primarily manages Category II funds
Investments made as a share of funds raised reached 96.2% by March 2026, indicating a progressively deployed and institutionalised market
Mid-Market Private Equity Formalisation Aligns with Gaja's Core Strategy
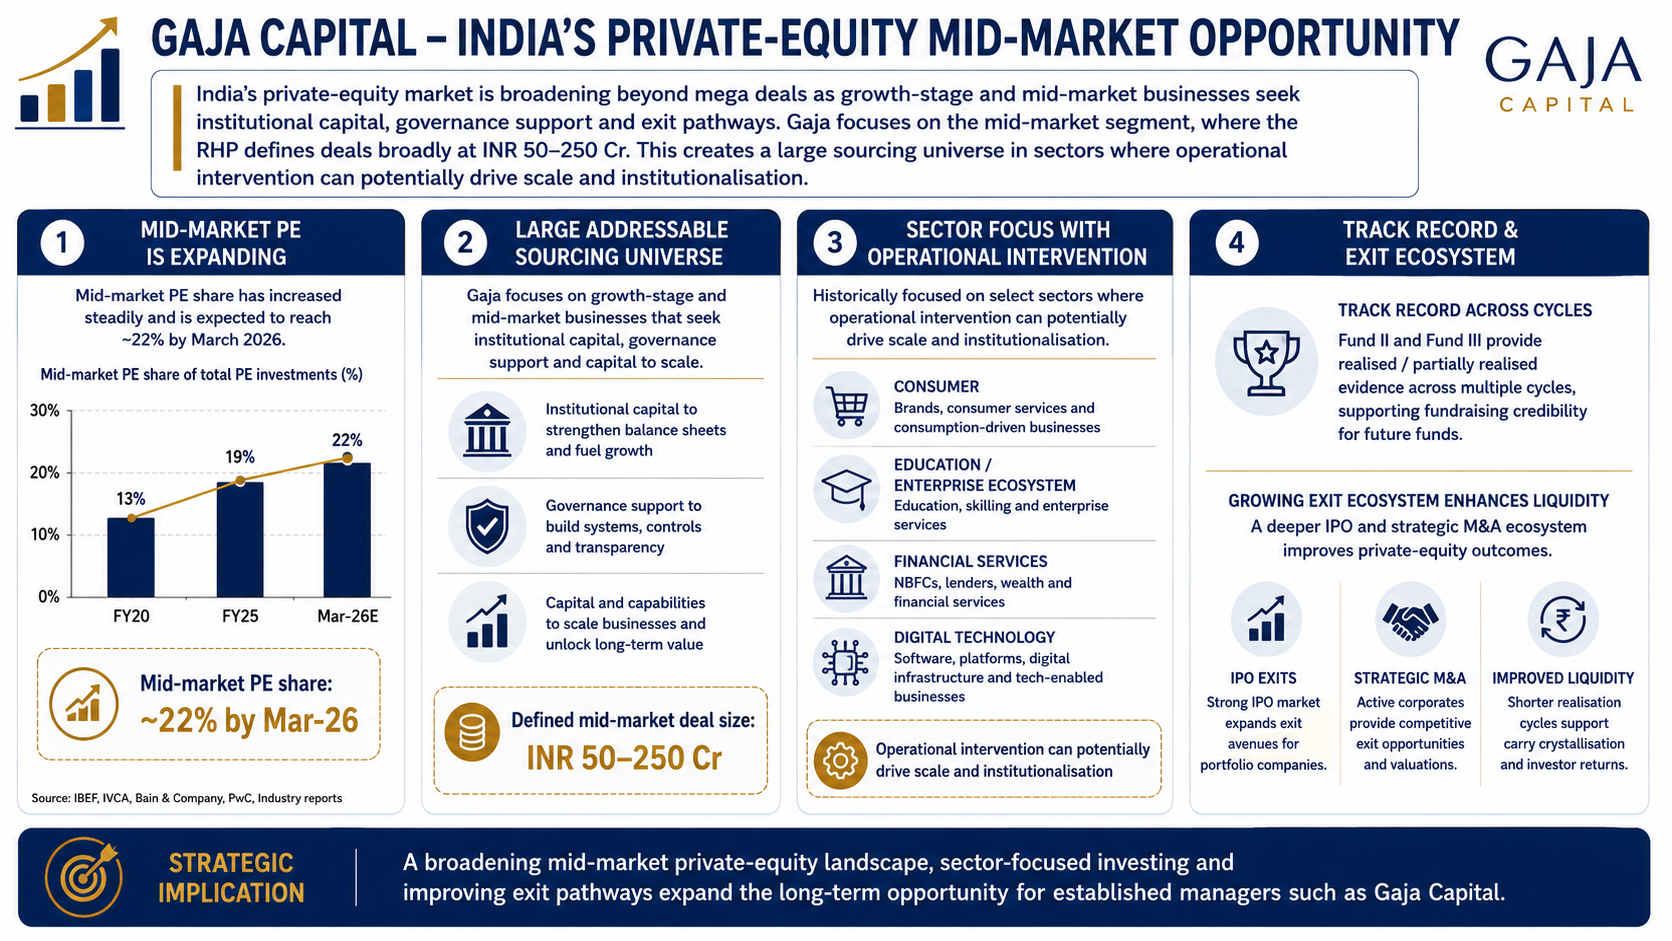
India's private-equity market is broadening beyond mega deals as growth-stage and mid-market businesses seek institutional capital, governance support and exit pathways. Gaja focuses on the mid-market segment, where the RHP defines deals broadly at INR 50-250 Cr. This creates a large sourcing universe in sectors where operational intervention can potentially drive scale and institutionalisation.
The key details are:
Mid-market PE share increased to approximately 22% by March 2026, from 19% in FY25 and a lower base in FY20
The Company has historically focused on consumer, education/enterprise ecosystem, financial services and, more recently, digital technology opportunities
A growing IPO and strategic M&A; exit ecosystem can improve private-equity liquidity, shorten realisation cycles and support carry crystallisation
Fund II and Fund III provide realised/partially realised evidence across multiple cycles, supporting fundraising credibility for future funds
Deepening Domestic and Global LP Ecosystem Expands the Fundraising Pool
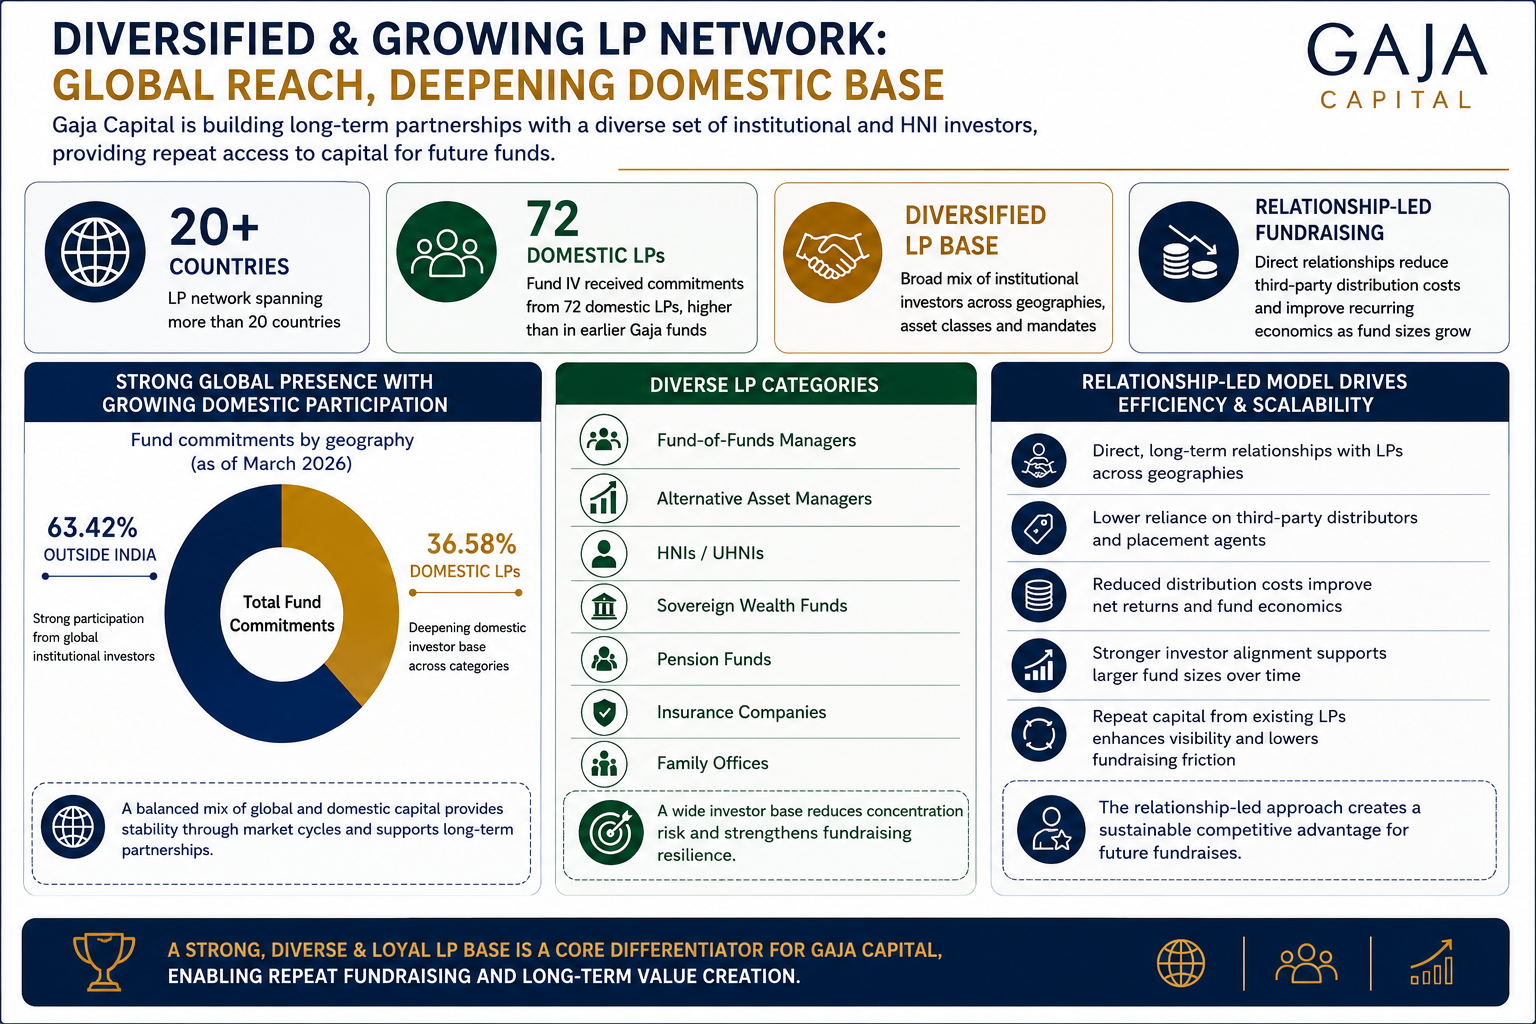
Alternative AMCs need repeat access to institutional and HNI capital more than physical distribution infrastructure. The Indian LP ecosystem is gradually deepening while global institutions continue to allocate to India-focused private markets. Gaja enters this cycle with a diversified network spanning more than 20 countries and a growing domestic LP base, which can lower fundraising friction for successor funds.
The key details are:
Gaja had 63.42% of fund commitments from outside India and 36.58% from domestic LPs as of March 2026
LP categories include fund-of-funds managers, alternative asset managers, HNIs/UHNIs, sovereign wealth funds, pensions, insurers and family offices
Fund IV received commitments from 72 domestic LPs, higher than domestic participation in earlier Gaja funds
A direct relationship-led fundraising model can reduce third-party distribution costs and improve recurring economics as fund sizes grow
Risks in the Industry
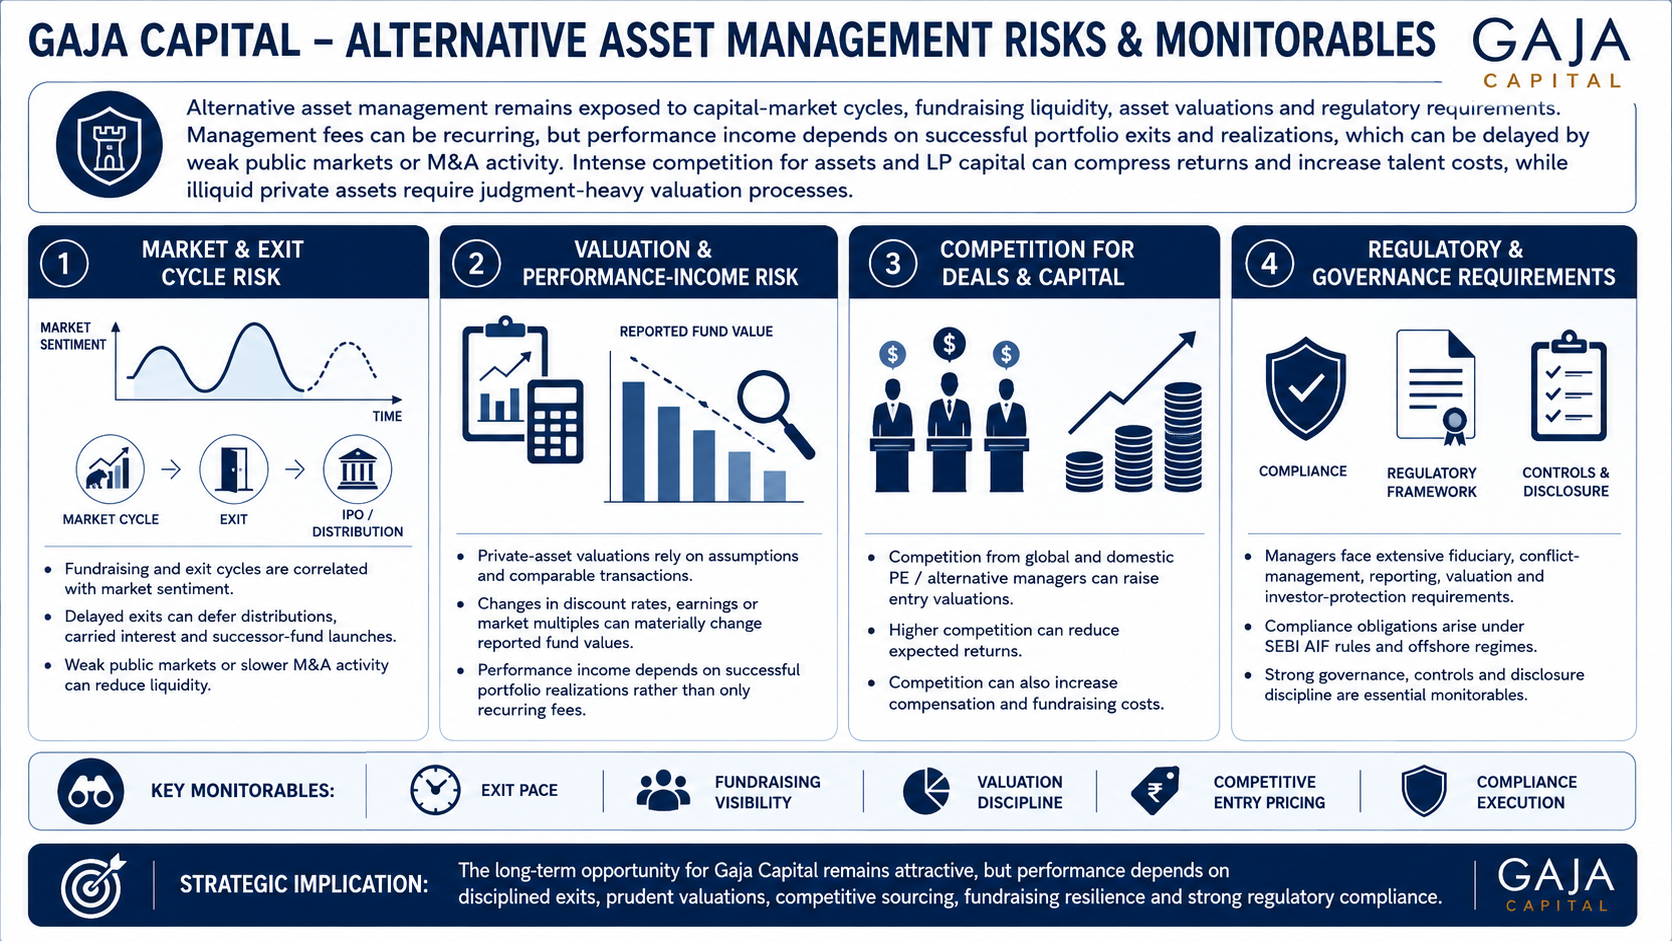
Alternative asset management remains exposed to capital-market cycles, fundraising liquidity, asset valuations and regulatory requirements. Management fees can be recurring, but performance income depends on successful portfolio exits and realisations, which can be delayed by weak public markets or M&A; activity. Intense competition for assets and LP capital can also compress returns and increase talent costs, while illiquid private assets require judgement-heavy valuation processes.
The key risks are:
Fundraising and exit cycles are correlated with market sentiment; delayed exits can defer distributions, carried interest and the launch of successor funds
Private-asset valuations rely on assumptions and comparable transactions; changes in discount rates, earnings or market multiples can materially change reported fund values
Competition from global and domestic PE/alternative managers can raise entry valuations, reduce expected returns and increase compensation/fundraising costs
Managers face extensive fiduciary, conflict-management, reporting, valuation and investor-protection requirements under SEBI AIF rules and offshore regimes
Government Policy Support
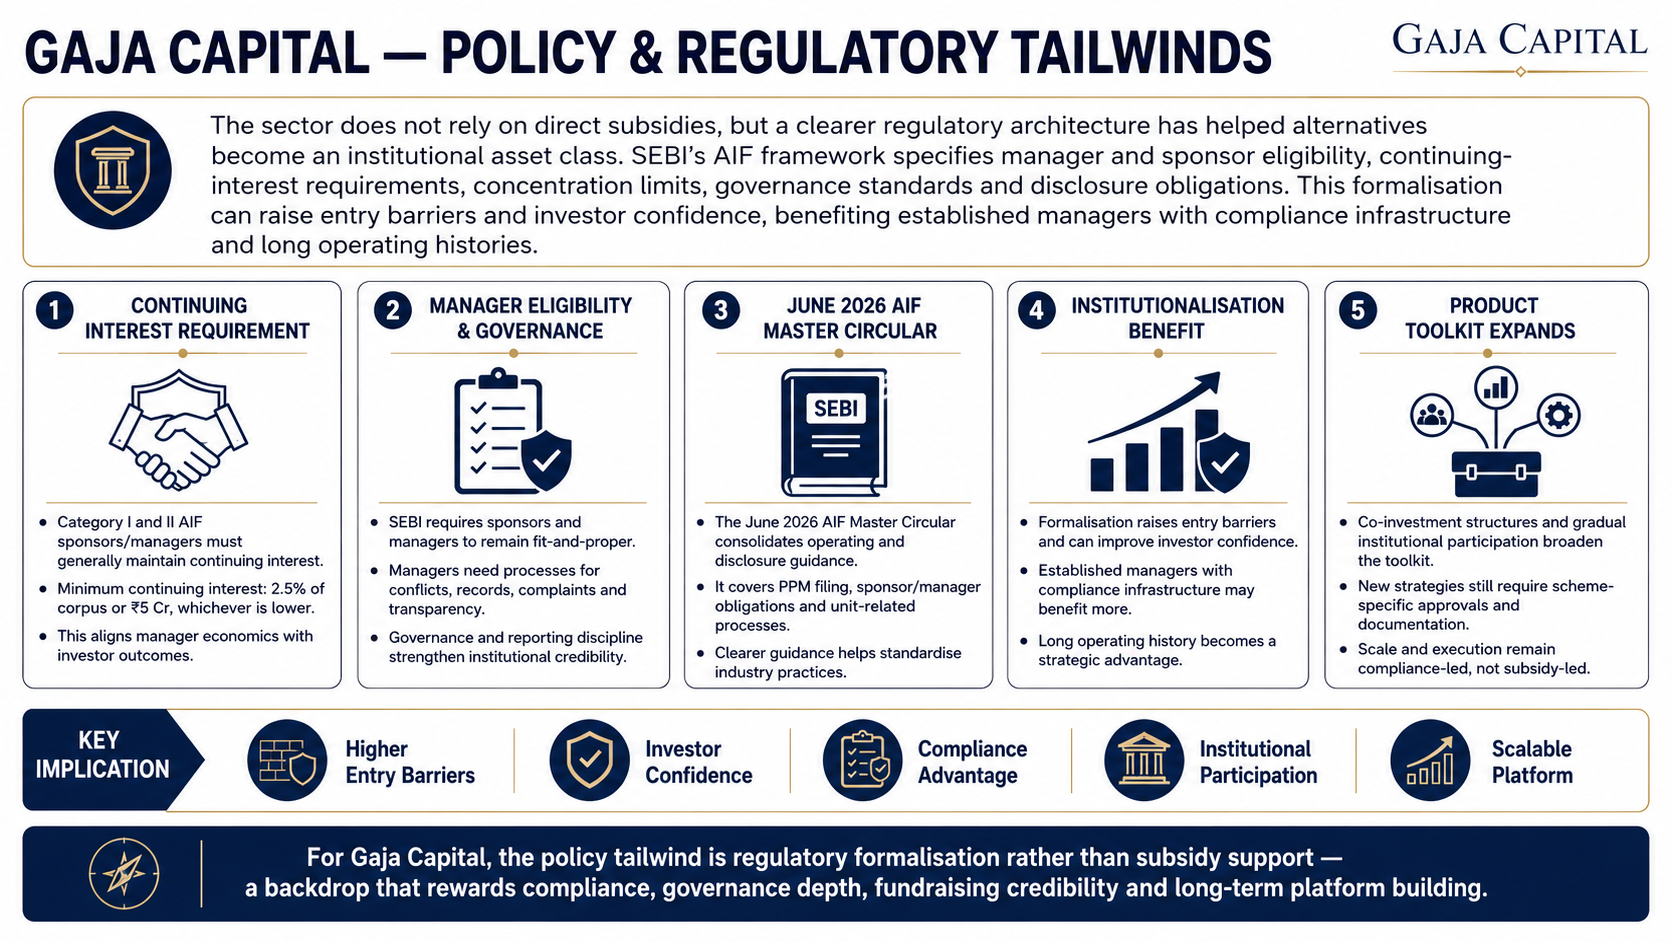
The sector does not rely on direct subsidies, but a clearer regulatory architecture has helped alternatives become an institutional asset class. SEBI's AIF framework specifies manager/sponsor eligibility, continuing-interest requirements, concentration limits, governance standards and disclosure obligations. This formalisation can raise entry barriers and investor confidence, benefiting established managers with compliance infrastructure and long operating histories.
The key policies are:
Category I and II AIF sponsors/managers must generally maintain continuing interest of at least 2.5% of corpus or INR 5 Cr, whichever is lower
SEBI requires AIF managers and sponsors to remain fit-and-proper and maintain processes for conflicts, records, complaints, transparency and regulatory reporting
The June 2026 AIF Master Circular consolidates operating and disclosure guidance, including PPM filing, sponsor/manager obligations and unit-related processes
Co-investment structures and gradual institutional participation broaden the product toolkit, but every new strategy remains subject to scheme-specific approvals and documentation
Fundraise/Future Plans
Shareholding
Pre-issue shareholding
Promoter Holding 0.0%
Post-Issue Shareholding
Promoter Holding 0.0%
Category
Pre-Issue%Post-Issue%
Promoters
Promoters
61.4%47.0%
Sudesh Jain
9.6%7.3%
Total Promoter Holding
71.0%54.3%
Additional Shareholders
0.0%0.0%
Total Additional Holding
0.0%0.0%
Total Shareholding
71.0%54.3%
- Overview
- Business
- Financial Highlights
- Industry Overview
- Fundraise/Future Plans
- Documentation
Get the Preqt App and keep in touch around the clock!
 Monitor your investments in real-time.
- Receive tailored deal suggestions.
- Get real-time updates and alerts.
