


Glass Wall Systems (India)
Engineering Modern FacadesBuilding with Glass
IPO Summary (PrEqT)
Glass Wall Systems (India) Limited is an integrated premium façade and fenestration solutions provider combining domestic EPC execution, export-led manufactured façade product supply and luxury fenestration through Yes Systems. Business quality is supported by more than two decades of operating history, 158 completed projects, an integrated design/manufacturing platform and a diversified domestic-overseas revenue mix. As of July 31, 2026, the combined order book across domestic façade, international façade supply and fenestration was approximately INR 981.5 Cr, equal to about 2.1x FY26 revenue. FY26 marked a sharp operating rebound: revenue rose 64.2% to INR 457.0 Cr after declining 8.6% in FY25, while EBITDA increased to INR 105.2 Cr and PAT to INR 83.8 Cr. However, EBITDA margin moderated to 23.0% from 26.2% in FY25, so the sustainability of the FY26 earnings step-up depends on project mix, export realisations and execution discipline rather than revenue growth alone. Financial quality is strong but cash conversion needs monitoring. FY26 ROE was 38.6%, ROCE 43.0% and net debt/equity was -0.30x, while CFO of INR 73.3 Cr represented about 87.5% of PAT. Net working-capital days improved to 45 from 69 in FY25 as inventory days fell, but receivable days worsened to 88 and trade receivables more than doubled to INR 109.0 Cr. Concentration is the principal structural watch-point: the top 10 clients contributed 86.4% of FY26 revenue, the top 10 suppliers represented 69.5% of raw material/component cost, and RWW together with Winpro accounted for all USA revenue in FY26. Transaction quality is mixed because roughly 86.0% of shares offered are OFS; only INR 60.0 Cr is fresh capital, of which INR 50.0 Cr is intended for the glass-processing-unit backward-integration project expected to become operational around August 2027. At the IPO band, FY26 P/E is 19.1x versus the RHP-disclosed Innovator Façade Systems peer P/E of 16.5x, implying a modest peer premium rather than a clearly discounted entry valuation.
IPO Review Rating
Buy
MainboardTransforming Buildings Through Advanced Glass and Facade Solutions
Glass Wall Systems has delivered strong financial performance, with Revenue increasing from INR 304.3 Cr in FY24 to INR 457.0 Cr in FY26 and FY26 EBITDA Margin reaching 23.0%. PAT increased from INR 20.3 Cr to INR 83.8 Cr, while ROE remained above 38.0%, indicating strong profitability and capital efficiency. The balance sheet is a major strength, with FY26 D/E of only 0.0x, a net-cash position and positive OCF of INR 73.3 Cr. The principal operating risk is customer concentration, as the largest customer contributes 32.1% of Revenue and two major US counterparties collectively contribute approximately 40.0%. Industry positioning is favourable, with the Indian façade market expected to grow at 12.3% CAGR and international business already contributing 45.2% of FY26 Revenue. Governance is broadly adequate, supported by 50.0% Board independence and zero promoter pledge, although approximately INR 43.7 Cr of Company tax proceedings and 6.2% RPT exposure warrant monitoring. Valuation is the main scoring constraint: at INR 182.0, the IPO is priced at 19.1x P/E, 14.5x EV/EBITDA and 5.9x P/B, representing a premium to its sole listed peer on key metrics. The offer structure is also relatively weak, with only INR 60.0 Cr / 14.0% Fresh Issue and INR 367.9 Cr / 86.0% OFS, although nearly three-fourths of the OFS is an institutional-investor exit rather than promoter monetisation.
PARAMETER
WEIGHT
SCORE
KEY FACTORS
Financial Performance
40.0%
5.0/5
Glass Wall Systems has a strong financial profile, with Revenue increasing from INR 304.3 Cr in FY24 to INR 457.0 Cr in FY26, EBITDA Margin at 23.0%, PAT Margin at 18.3%, ROE above 38.0% and very low leverage.
Show more
Detailed Analysis
Revenue increased from INR 304.3 Cr in FY24 to INR 278.3 Cr in FY25 and INR 457.0 Cr in FY26, representing a FY24–FY26 CAGR of 22.5%
EBITDA increased from INR 54.7 Cr in FY24 to INR 73.0 Cr in FY25 and INR 105.2 Cr in FY26, while FY26 EBITDA Margin stood at 23.0%
PAT increased from INR 20.3 Cr in FY24 to INR 57.5 Cr in FY25 and INR 83.8 Cr in FY26, with PAT Margin improving from 6.7% to 20.7% and 18.3%
D/E improved from 0.2x in FY24 to 0.1x in FY25 and 0.0x in FY26, reflecting a very low-leverage balance sheet
ROE increased from 18.3% in FY24 to 39.0% in FY25 and remained strong at 38.6% in FY26
OCF remained positive at INR 42.7 Cr in FY24, INR 73.0 Cr in FY25 and INR 73.3 Cr in FY26, demonstrating healthy cash generation
Largest customer Winpro International generated approximately INR 146.8 Cr / 32.1% of FY26 Revenue; Winpro plus Reflection Window + Wall together represented approximately 40.0%
Industry
15.0%
3.0/5
Glass Wall Systems operates in a healthy structural-growth industry, with India's façade market projected to grow at 12.3% CAGR and curtain-wall demand at approximately 13.5% through FY30.
Show more
Detailed Analysis
India's façade market is projected to increase from INR 90.6 Bn in FY26P to INR 144.1 Bn in FY30F, representing 12.3% CAGR
Façade demand is in a growth phase, supported by premium commercial construction, energy-efficient buildings, curtain walls and increasing specification complexity
Indian façade/fenestration remains highly fragmented with approximately 18,000 participants
ECBC, fire-safety, structural and green-building standards increase compliance requirements but also favour organised, technically capable players
Management
15.0%
4.0/5
Management quality is supported by 33+ years of promoter experience, 50.0% Board independence, zero promoter pledge and a clean promoter-litigation profile.
Show more
Detailed Analysis
Chairman Jawahar Hemrajani has 33+ years of construction and engineering experience, while the promoters have operated in façade solutions for 20+ years
Board comprises 6 Directors, including 3 Independent Directors, resulting in exactly 50.0% Board independence
0 promoter shares are pledged, with no criminal, regulatory, tax or other material proceedings disclosed against the Promoters
Recurring operating/KMP RPTs are model-calculated at approximately 6.2% of FY26 Revenue, excluding equity issuance; M.J. Coaters alone accounted for 4.5%
Valuation
20.0%
3.0/5
At INR 182.0, Glass Wall Systems is valued at approximately 19.1x P/E, 14.5x EV/EBITDA and 5.9x P/B.
Show more
Detailed Analysis
Glass Wall Systems trades at 19.1x FY26 P/E, approximately 15.8% above the RHP peer P/E of 16.5x
Issuer EV/EBITDA is approximately 14.5x versus Innovators Façade at approximately 7.8x, giving a issuer/peer ratio of 1.9x
Price of INR 182.0 against FY26 NAV of INR 30.9 implies approximately 5.9x P/B
FY26 RoNW remained strong at 32.0%, versus 32.7% in FY25
Merchant Banker Track Record
10.0%
4.0/5
The BRLM combination is a clear strength, with IIFL and Motilal Oswal possessing substantial Mainboard execution depth and a large recent transaction sample.
Show more
Detailed Analysis
Across the latest 10 disclosed IPOs for each BRLM, model-calculated average opening return is approximately 11.6%; IIFL averaged 8.3% and Motilal Oswal 15.0%
A recent cross-check sample includes Milky Mist 56.1x, Molbio 70.3x, CMR Green 127.0x, Laser Power 38.9x and Augmont 105.8x, indicating strong recent book-building outcomes despite some weak deals
14 of the 20 latest disclosed BRLM IPO observations opened above issue price, implying an approximate 70.0% positive-opening rate
Both BRLMs have substantial Mainboard execution history and large recent IPO transaction volumes
TOTAL
100%
4.0/5
Weighted Composite Score
Issue Price
₹172.0 to ₹182.0
As of 4 Sep 2026
GMP
₹20.0
As of 4 Sep 2026
Estimated Gain / Loss
+11.0%
Lot Size
82.0 Shares
Grey Market Premium (GMPs) are shared for knowledge purpose only. PrEqt doesn’t promote or execute the trades.
| Issue size | |
|---|---|
| Overall | ₹428.0 Cr |
| Fresh Issue | ₹60.0 Cr |
| Offer for Sale | ₹368.0 Cr |
Minimum Investment
₹14,924.0 / 6,724 shares

Merchant Banker
IIFL Capital Services Ltd.; Motilal Oswal Investment Advisors
IPO Document
RHP / Anchor Document
Offer Start Date
8th Sept 2026
Offer End Date
10th Sept 2026
Valuation
₹1,600.4 Cr
Revenue (FY'26)
₹471.4 Cr
PAT (FY'26)
₹83.8 Cr
Issue Size
₹428.0 Cr
Face Value
₹ 2.0Offer Price
₹ 182.0Lot Size
82.0 sharesSale Type
Fresh capital cum OFSPAT (FY'26)
₹ 83.8 CrPAT Margin (FY'26)
18.3 %P/E Multiple
19.1xEBITDA (FY'26)
₹ 105.2 CrCAGR Growth 2Y
22.5 %ROE (FY'26)
38.6 %ROCE (FY'26)
43.0 %Price to Book Value
5.9xDebt/Equity
0.0xCompany Website
www.glasswallsystems.inExplore new deals
Overview
Fund Allocation
Total: ₹0 CrSource:Company DRHP
Timeline
IPO Open Date
To Be Announced
IPO Close Date
To Be Announced
Tentative Allotment
To Be Announced
Initiation of Refunds
To Be Announced
Credit of Shares to Demat
To Be Announced
Tentative Listing Date
To Be Announced
Business
Business Model
Geographical Presence
Sales Channel
Clients
Key Risk Factor
Financial Highlights
Income Statement
Revenue growth with EBITDA and PAT margins
| Financial Metric | FY 2024 | FY 2025 | FY 2026 |
|---|---|---|---|
| Revenue (₹ Cr) | 310.3 | 288.1 | 471.4 |
| Growth (%) | - | -8.6% | 64.2% |
| EBITDA (₹ Cr) | 54.7 | 73.0 | 105.2 |
| EBITDA Margin (%) | 18.0% | 26.2% | 23.0% |
| PAT (₹ Cr) | 20.3 | 57.5 | 83.8 |
| PAT Margin (%) | 6.7% | 20.7% | 18.3% |
OBSERVATIONS & INSIGHTS
Revenue from Operations FY26 revenue rebounded sharply to INR 457.0 Cr after the FY25 decline, driven by stronger domestic façade and international supply execution plus consolidation of Yes Systems
EBITDA increased to INR 105.2 Cr, materially faster than the FY24 base, reflecting improved scale and a richer project/export mix
PAT increased 45.7% in FY26 to INR 83.8 Cr after FY25’s strong step-up, supported by operating scale and low leverage
Balance Sheet
| Financial Metric | FY 2024 | FY 2025 | FY 2026 |
|---|---|---|---|
| Net Worth | ₹ 120.9 Cr | ₹ 174.1 Cr | ₹ 259.9 Cr |
| Total Assets | ₹ 281.8 Cr | ₹ 316.6 Cr | ₹ 468.4 Cr |
| Total Borrowing | ₹ 24.9 Cr | ₹ 8.5 Cr | ₹ 6.7 Cr |
| Reserves & Surplus | ₹ 101.5 Cr | ₹ 158.9 Cr | ₹ 243.0 Cr |
OBSERVATIONS & INSIGHTS
Total Equity rose to INR 259.9 Cr, providing a larger capital base while still supporting FY26 ROE of 38.6%
Total assets increased 47.9% to INR 468.4 Cr, reflecting both operating growth and the consolidation/acquisition-related expansion of the group
Reserves & Surplus increased strongly through retained profitability and the FY26 business-combination / capital movements, strengthening net worth
Cash Flow
| Financial Metric | FY 2024 | FY 2025 | FY 2026 |
|---|---|---|---|
CFO (₹ Cr) Cash generated from core business operations. | +42.7 Cr | +73.0 Cr | +73.3 Cr |
CFI (₹ Cr) Cash used for investments and long-term assets. | +8.8 Cr | -53.1 Cr | -38.8 Cr |
CFF (₹ Cr) Cash flow related to funding and borrowings. | -44.3 Cr | -25.5 Cr | -5.3 Cr |
Working Capital
| Efficiency Metric | FY 2023 | FY 2024 | FY 2025 |
|---|---|---|---|
Debtor Days Average number of days taken to collect customer payments. | - | - | - |
Creditor Days Average time taken to pay suppliers and vendors. | - | - | - |
Inventory Days Average number of days inventory remains unsold. | - | - | - |
CCC (Cash Conversion Cycle) (Debtor Days + Inventory Days - Creditor Days) | - | - | - |
Financial Ratios
Measures the company’s leverage relative to shareholder equity.
OBSERVATIONS & INSIGHTS
ROE remained high at 38.6% in FY26 despite a larger equity base, reflecting strong PAT generation
ROA was 17.9% in FY26 versus 18.2% in FY25; asset growth broadly matched earnings growth
ROCE remained above 43% in FY25-FY26, indicating strong pre-financing returns on capital employed
Debt / Equityfell from 0.21x in FY24 to 0.03x in FY26 following repayment of working-capital and term borrowings
The current ratio moderated to 1.6x from 1.7x but remained above 1.0x; current liabilities rose alongside higher project activity
Interest Coverage Ratio improved to 32.6x as operating profit expanded and finance costs fell materially from FY24 levels
Industry Overview
Industry Drivers
Urban Construction, Commercial Real Estate and Façade Intensity
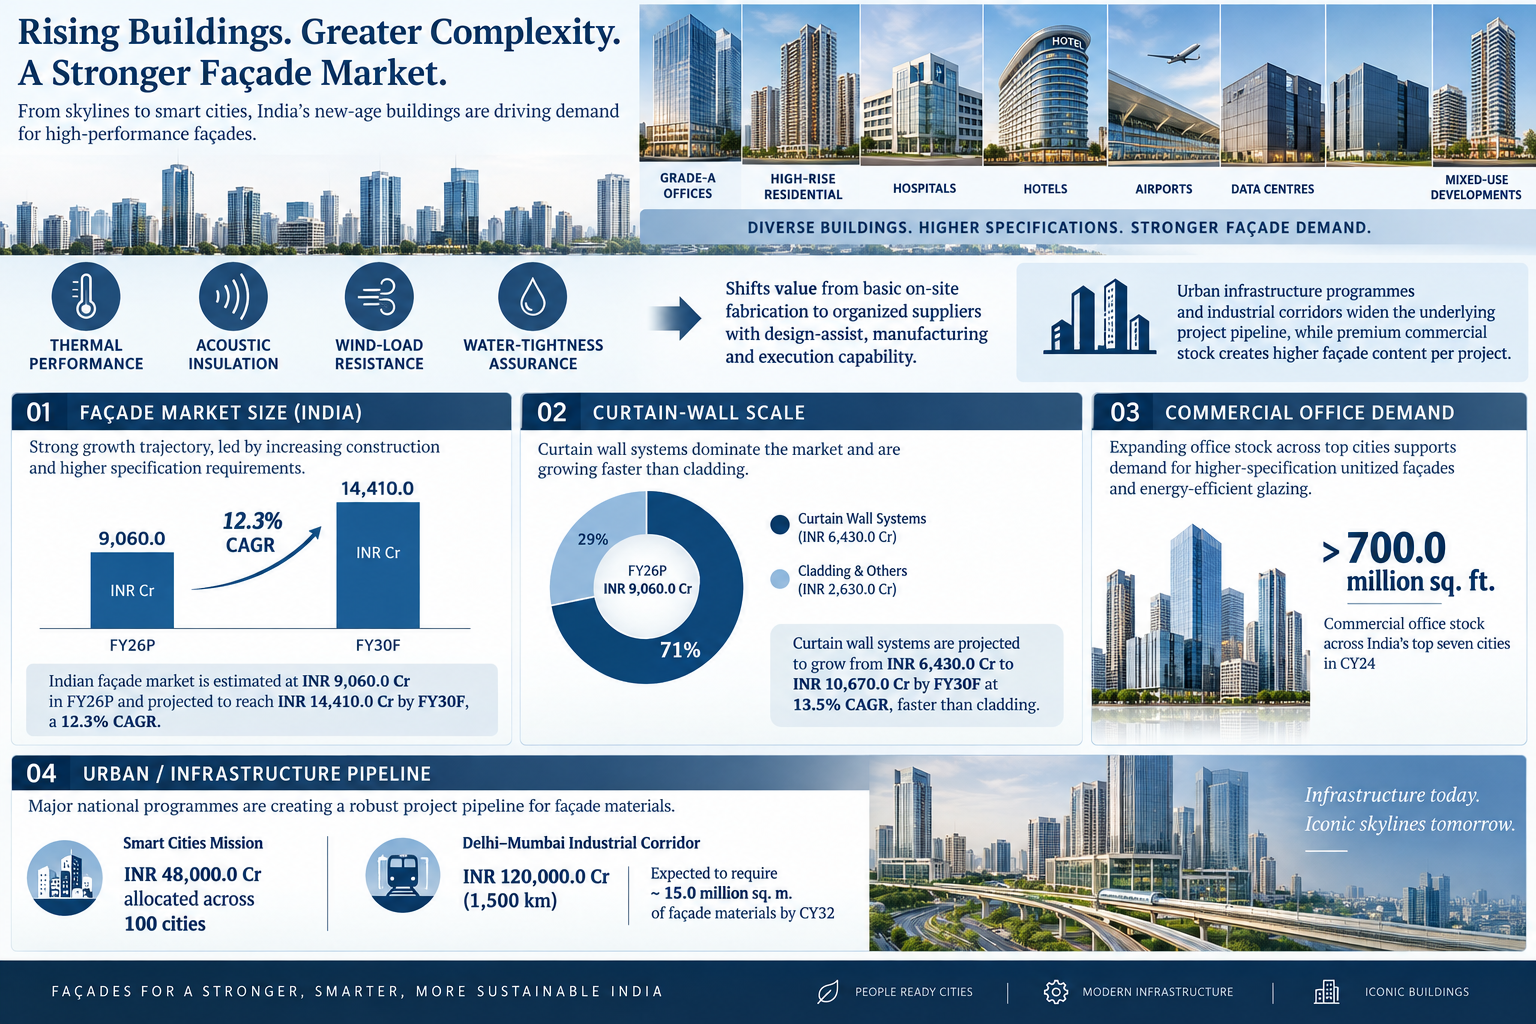
Façade demand rises not only with construction volume but also with the complexity and specification intensity of new buildings. Grade-A offices, high-rise residential towers, hospitals, hotels, airports, data centres and mixed-use developments increasingly use unitized curtain walls, structural glazing and engineered cladding that must meet thermal, acoustic, wind-load and water-tightness requirements. This shifts value from basic on-site fabrication toward organized suppliers with design-assist, manufacturing and execution capability. Urban infrastructure programmes and industrial corridors widen the underlying project pipeline, while premium commercial stock creates higher façade content per project.
The key drivers are:
Façade market size: The Indian façade market is estimated at INR 9,060.0 Cr in FY26P and projected to reach INR 14,410.0 Cr by FY30F, a 12.3% CAGR
Curtain-wall scale: Curtain wall systems represent roughly 71% of the FY26P façade market and are projected to increase from INR 6,430.0 Cr to INR 10,670.0 Cr by FY30F at 13.5% CAGR, faster than cladding
Commercial office demand: Commercial office stock across India’s top seven cities exceeded 700.0 million sq. ft. in CY24, supporting demand for higher-specification unitized façades and energy-efficient glazing
Urban / infrastructure pipeline: The Smart Cities Mission is cited with INR 48,000.0 Cr allocated across 100 cities, while the 1,500 km Delhi-Mumbai Industrial Corridor is cited at INR 120,000.0 Cr and expected to require about 15.0 million sq. m. of façade materials by CY32.
Premiumisation and Luxury Fenestration
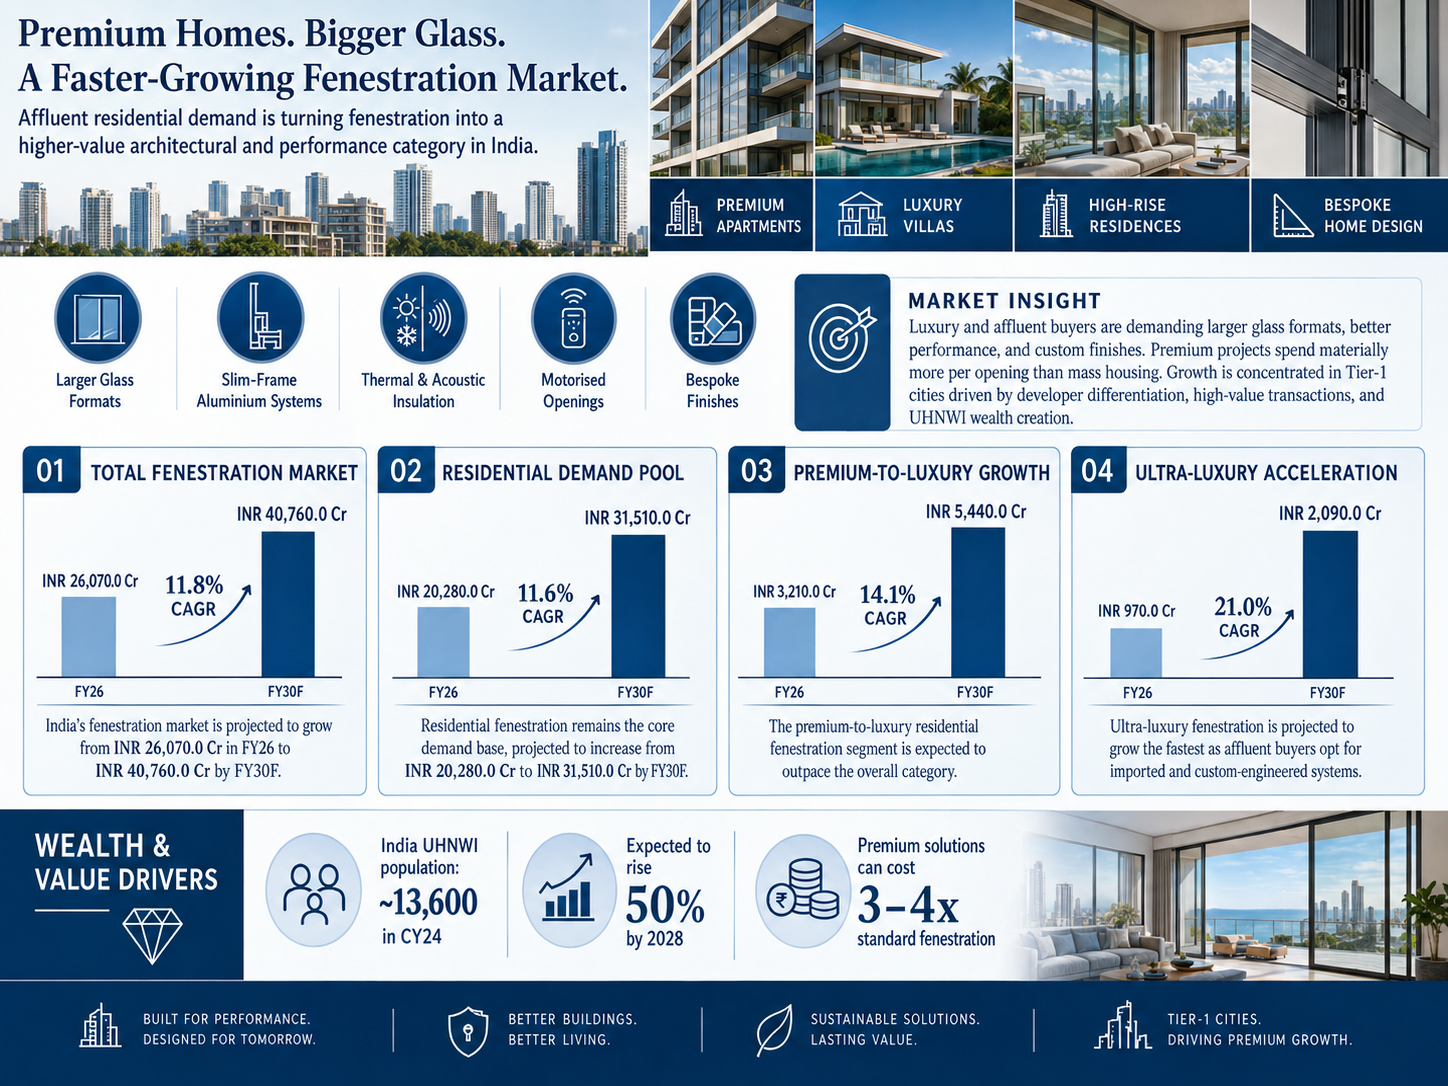
Residential fenestration is becoming a higher-value architectural and performance category as affluent buyers demand larger glass formats, slim-frame aluminium systems, improved thermal/acoustic insulation, motorised openings and bespoke finishes. Premium projects can therefore spend materially more per opening than mass housing, making luxury demand a value-growth driver rather than merely a unit-growth driver. Growth is concentrated in Tier-1 cities where high-value transactions, developer differentiation and UHNWI wealth creation support imported and custom-engineered systems.
The key drivers are:
Total fenestration market: India’s fenestration market is projected to grow from INR 26,070.0 Cr in FY26 to INR 40,760.0 Cr by FY30F, an 11.8% CAGR
Residential demand pool: Residential fenestration is projected to rise from INR 20,280.0 Cr to INR 31,510.0 Cr by FY30F at 11.6% CAGR, keeping housing the core demand base
Premium-to-luxury growth: The premium-to-luxury residential fenestration segment is expected to expand from INR 3,210.0 Cr in FY26 to INR 5,440.0 Cr by FY30F at 14.1% CAGR, outpacing the overall category
Ultra-luxury acceleration: Ultra-luxury fenestration is projected from INR 970.0 Cr in FY26 to INR 2,090.0 Cr by FY30F at 21.0% CAGR. India’s UHNWI population reached about 13,600 in CY24 and is expected to rise 50% by 2028; premium solutions can cost 3-4x standard fenestration
Energy Efficiency, Green Buildings and Formalisation
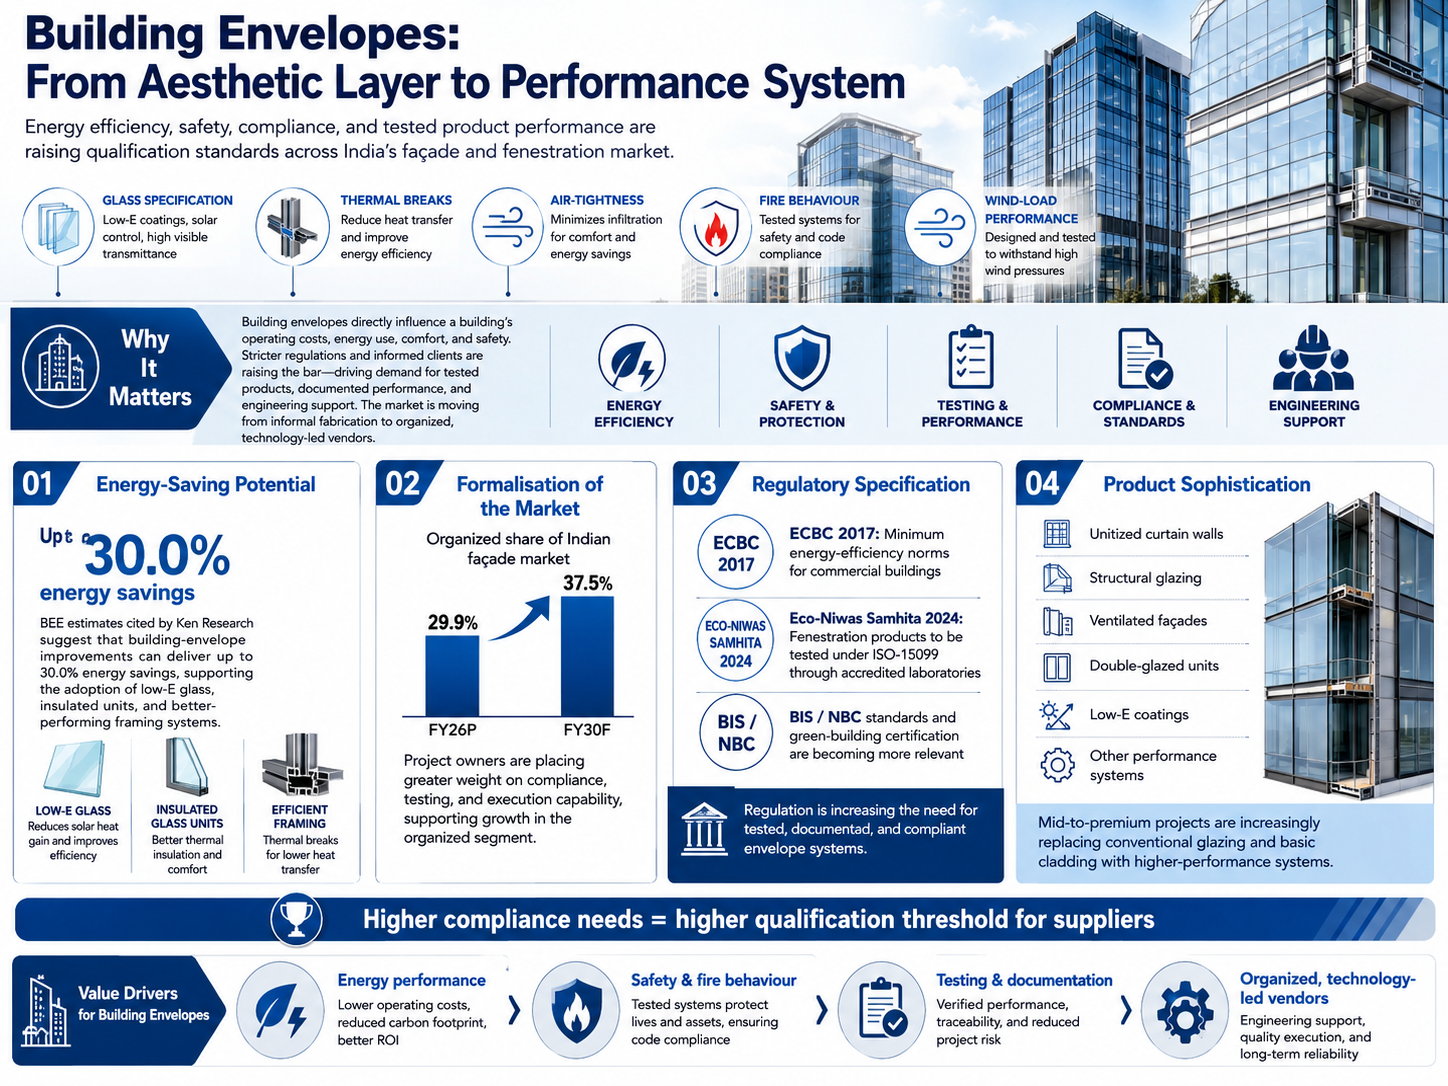
Building envelopes have become an energy-performance and safety system rather than a purely aesthetic layer. Glass specification, thermal breaks, air-tightness, daylight control, fire behaviour and wind-load performance influence building operating costs and regulatory compliance. As ECBC, Eco-Niwas Samhita, BIS/NBC standards and green-building certification become more relevant, developers increasingly need tested products, documented performance and engineering support. That raises the qualification threshold and supports gradual migration from informal fabrication toward organized, technology-led vendors.
The key drivers are:
Energy-saving potential: Ken Research cites BEE estimates that building-envelope improvements can deliver up to 30.0% energy savings, supporting adoption of low-E glass, insulated units and better-performing framing systems
Formalisation: The organized share of the Indian façade market is projected to increase from 29.9% in FY26P to 37.5% by FY30F as project owners place greater weight on compliance, testing and execution capability
Regulatory specification: ECBC 2017 sets minimum energy-efficiency norms for commercial buildings, while Eco-Niwas Samhita 2024 requires fenestration products to be tested under ISO-15099 through accredited laboratories
Product sophistication: Unitized curtain walls, structural glazing, ventilated façades, double-glazed units, low-E coatings and other performance systems are increasingly replacing conventional glazing/basic cladding in mid-to-premium projects
Risks in the Industry
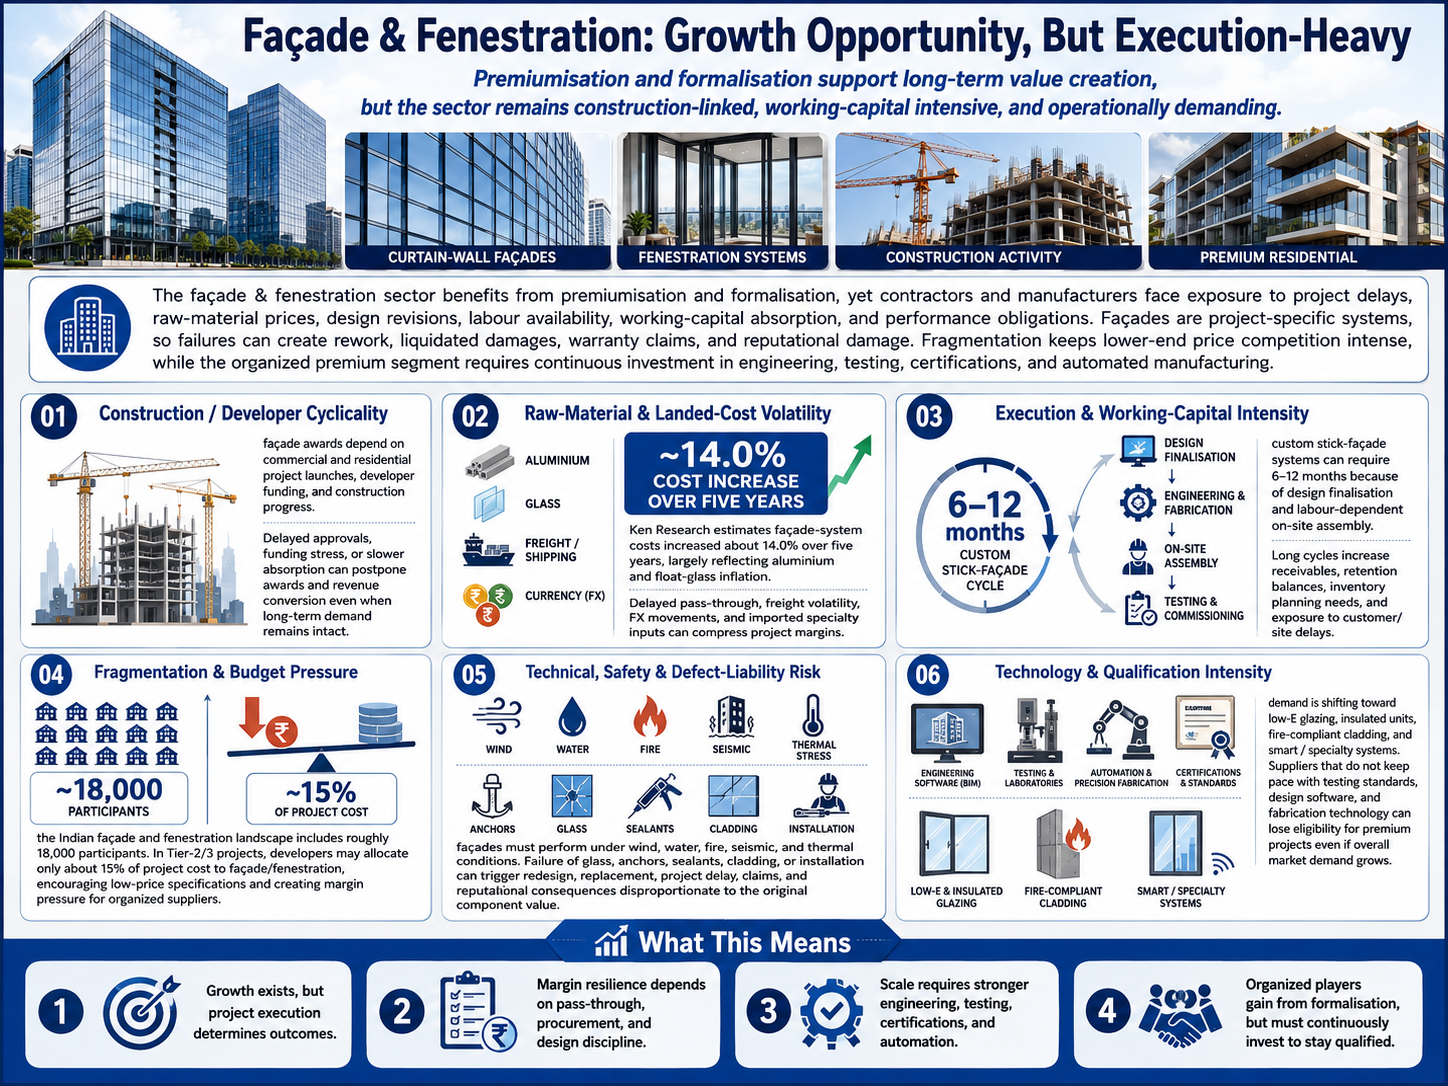
The façade and fenestration sector can benefit from premiumisation and formalisation, but it remains an execution-heavy construction-linked industry. Contractors and manufacturers carry simultaneous exposure to project delays, raw-material prices, design revisions, labour availability, working-capital absorption and performance obligations. Unlike standardized building materials, façades are project-specific systems; a design, fabrication or installation failure can create rework, liquidated damages, warranty claims and reputational damage. Fragmentation also keeps price competition intense in lower-specification projects, while the organized premium segment requires continuous investment in engineering, testing, certifications and automated manufacturing.
The key risks are:
Construction / developer cyclicality: Façade awards depend on commercial and residential project launches, developer funding and construction progress. Delayed approvals, funding stress or slower absorption can postpone awards and revenue conversion even when long-term market demand remains intact
Raw-material and landed-cost volatility: Ken Research estimates façade-system costs increased about 14.0% over five years, largely reflecting aluminium and float-glass inflation. Delayed pass-through, freight volatility, foreign-exchange movements and imported specialty inputs can compress project margins
Execution and working-capital intensity: Custom stick-façade systems can require 6-12 months because of design finalisation and labour-dependent on-site assembly. Long cycles increase receivables, retention balances, inventory planning needs and exposure to customer/site delays
Fragmentation and budget pressure: The Indian façade and fenestration landscape includes roughly 18,000 participants. In Tier-2/3 projects, developers may allocate only about 15% of project cost to façade/fenestration, encouraging low-price specifications and creating margin pressure for organized suppliers
Technical, safety and defect-liability risk: Façades must perform under wind, water, fire, seismic and thermal conditions. Failure of glass, anchors, sealants, cladding or installation can trigger redesign, replacement, project delay, claims and reputational consequences that are disproportionate to the original component value
Technology and qualification intensity: Demand is shifting toward low-E glazing, insulated units, fire-compliant cladding and smart / specialty systems. Suppliers that do not keep pace with testing standards, design software and fabrication technology can lose eligibility for premium projects even if overall market demand grows
Government Policy Support
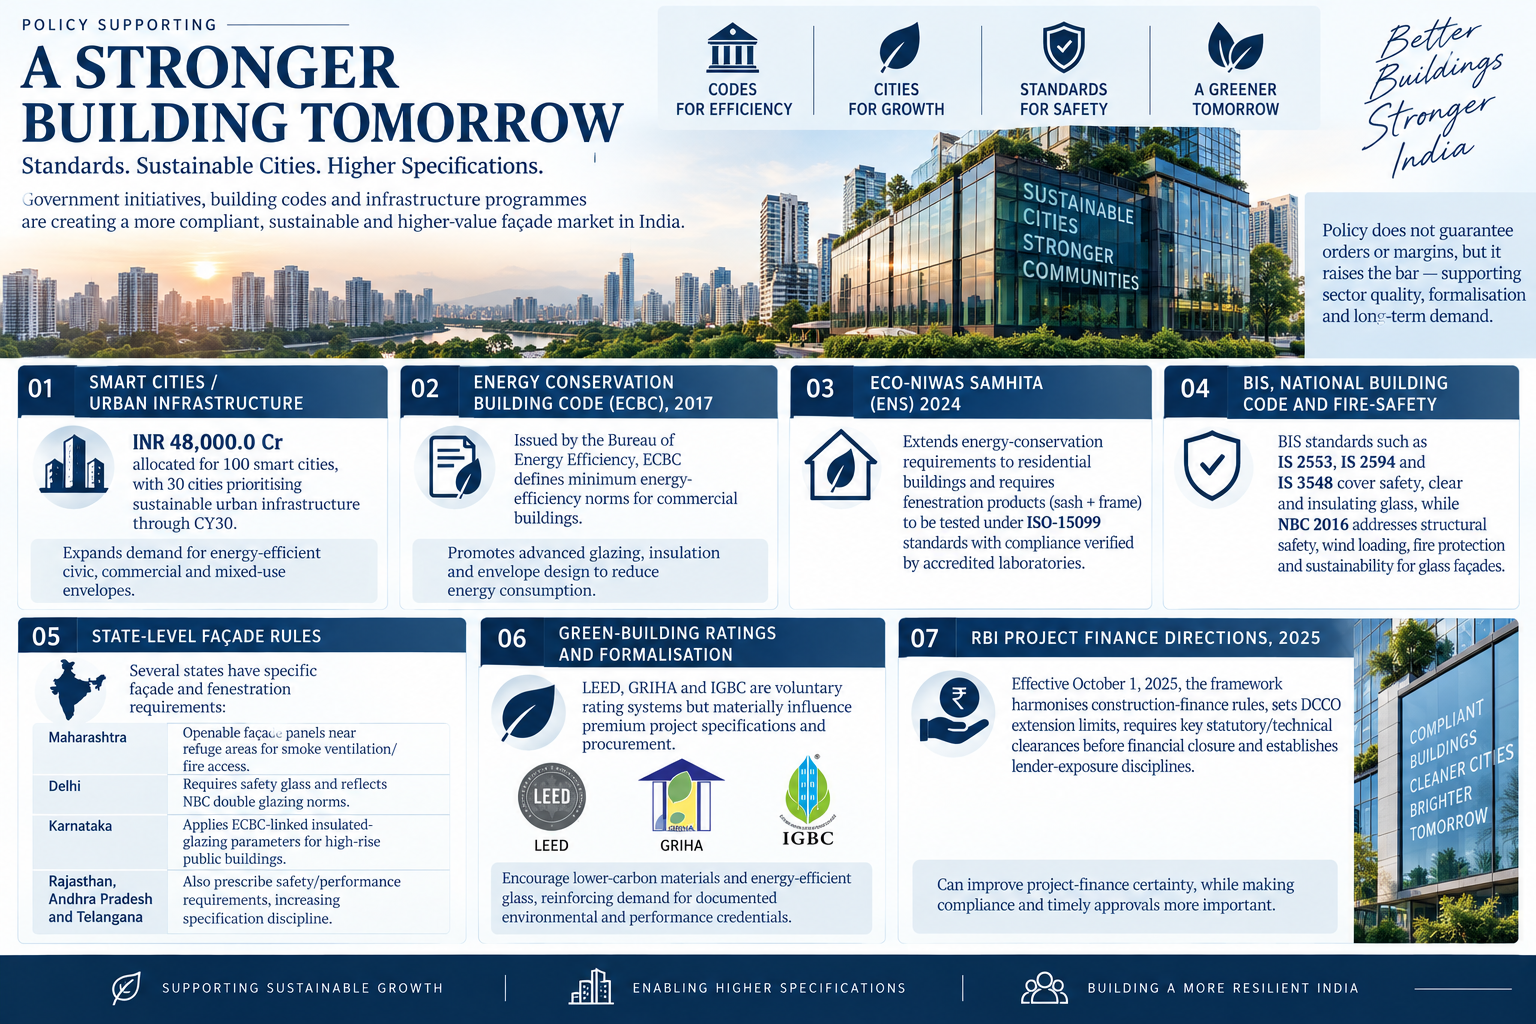
Government support for façade and fenestration is primarily demand- and standards-led rather than a direct subsidy to individual manufacturers. Urban infrastructure programmes expand the construction base, while energy codes, glass-safety standards, fire rules and state building regulations increase the minimum performance required from building envelopes. This has a two-sided effect: compliant organized vendors can benefit from formalisation and higher specifications, but they must also bear the cost of testing, certification, documentation and engineering. Policy therefore supports sector quality and addressable demand, but does not guarantee orders, margins or fiscal incentives to any specific façade company.
The key policies are:
Smart Cities / urban infrastructure: The industry report cites INR 48,000.0 Cr allocated for 100 smart cities, with 30 cities prioritising sustainable urban infrastructure through CY30. Such projects expand demand for energy-efficient civic, commercial and mixed-use envelopes
Energy Conservation Building Code (ECBC), 2017: Issued by the Bureau of Energy Efficiency, ECBC defines minimum energy-efficiency norms for commercial buildings and promotes advanced glazing, insulation and envelope design to reduce energy consumption
Eco-Niwas Samhita (ENS) 2024: ENS extends energy-conservation requirements to residential buildings and requires fenestration products (sash + frame) to be tested under ISO-15099 standards with compliance verified by accredited laboratories
BIS, National Building Code and fire-safety framework: BIS standards such as IS 2553, IS 2594 and IS 3548 cover safety, clear and insulating glass, while NBC 2016 addresses structural safety, wind loading, fire protection and sustainability for glass façades
State-level façade rules: Maharashtra requires openable façade panels near refuge areas for smoke ventilation/fire access; Delhi requires safety glass and reflects NBC double glazing norms; Karnataka applies ECBC-linked insulated-glazing parameters for high-rise public buildings. Rajasthan, Andhra Pradesh and Telangana also prescribe safety/performance requirements, increasing specification discipline
Green-building ratings and formalisation: LEED, GRIHA and IGBC are voluntary rating systems but materially influence premium project specifications and procurement. They encourage lower-carbon materials and energy-efficient glass, reinforcing demand for documented environmental and performance credentials
RBI Project Finance Directions, 2025: Effective October 1, 2025, the framework harmonises construction-finance rules, sets DCCO extension limits, requires key statutory/technical clearances before financial closure and establishes lender-exposure disciplines. It can improve project-finance certainty, while making compliance and timely approvals more important
Fundraise/Future Plans
Shareholding
Pre-issue shareholding
Promoter Holding 0.0%
Post-Issue Shareholding
Promoter Holding 0.0%
Category
Pre-Issue%Post-Issue%
Promoters
Jawahar Hariram Hemrajani
37.4%33.1%
Eshan Jawahar Hemrajani
9.4%5.9%
Eshan J. Hemrajani jointly with Dikshita
5.7%5.5%
Amit Jawahar Hemrajani
9.3%9.0%
Vinne Jawahar Hemrajani
2.5%2.4%
Total Promoter Holding
64.3%55.9%
Additional Shareholders
India Business Excellence Fund IIA
25.8%7.9%
Vistra ITCL - Business Excellence Fund II
9.8%9.4%
Total Additional Holding
35.6%17.3%
Total Shareholding
99.9%73.2%
- Overview
- Business
- Financial Highlights
- Industry Overview
- Fundraise/Future Plans
- Documentation
Get the Preqt App and keep in touch around the clock!
 Monitor your investments in real-time.
- Receive tailored deal suggestions.
- Get real-time updates and alerts.
