

Greenzo Energy India Ltd.
Powering Green HydrogenBuilding Hydrogen Infrastructure
Unlisted Review and Rating
Speculative
DRHP Not FiledOverall Recommendation
Greenzo Energy is positioned in one of India's strongest structural growth themes and has several genuinely attractive features: experienced renewable-energy leadership, minimal debt, domestic electrolyser-manufacturing ambitions, marquee project announcements and a stated INR 1,800 crore order book. If this pipeline converts into revenue at healthy margins, the Company's financial profile could look radically different within a few years
However, the FY25 audited numbers do not yet justify the current ~INR 600 unlisted price. Operating revenue was only INR 15.97 crore and grew 8.0%; core EBITDA margin fell to approximately 6.0%; ROE remained near 2.4%; and operating cash outflow ballooned to INR 44.52 crore as inventory, receivables and advances consumed capital. The current approximately ₹722 crore market capitalisation therefore represents 500x+ FY25 earnings and 40x+ FY25 sales
Governance also warrants diligence, particularly the INR 82.6 lakh aggregate FY25 excess managerial remuneration requiring shareholder waivers, the incomplete audit-trail operation and absence of a formal risk-management policy. These do not negate the investment case, but they matter significantly at a premium valuation
PARAMETER
WEIGHT
SCORE
KEY FACTORS
Financial Performance
25.0%
2.0/5
Balance-sheet leverage is excellent, but modest operating growth, weak ROE, falling core margins and severe working-capital cash absorption materially weaken financial quality
Show more
Detailed Analysis
Operating revenue increased only 8.0%, from INR 14.79 crore in FY24 to INR 15.97 crore in FY25. This is modest given the Company's manufacturing expansion and claimed order pipeline
Core EBITDA was approximately INR 0.96 crore, implying a 6.0% margin, down from approximately 8.5% in FY24. Core operating profitability therefore weakened despite revenue growth
FY25 consolidated PAT was ₹1.37 crore, producing an 8.6% PAT margin, up from 6.8%; however, INR 1.29 crore of other income materially supported reported earnings
Greenzo had effectively nil conventional borrowings at FY25-end against INR 77.48 crore of shareholders' funds, producing an exceptionally conservative reported leverage position
PAT on average FY24-FY25 equity produces only approximately 2.4% ROE. Significant equity infusion has not yet translated into proportionate earnings
Industry
25.0%
4.0/5
Green hydrogen offers exceptional structural growth and policy support, but an early lifecycle, strong competition and project-economics uncertainty temper the opportunity.
Show more
Detailed Analysis
India's green-hydrogen ecosystem has substantial structural growth potential, supported by the National Green Hydrogen Mission and a targeted 5 MMT annual green-hydrogen capacity by 2030
Domestic electrolyser manufacturing and industrial green-hydrogen adoption remain at an early commercialisation / scale-up stage
Government incentives have already been awarded to 15 companies for 3,000 MW p.a. of electrolyser manufacturing capacity
Policy support is strong, but project economics remain dependent on renewable-power cost, certification, incentives, offtake development and execution of government/industrial programmes
Management
25.0%
3.0/5
Experienced sector leadership and improving board independence are positives, but excess remuneration, promoter concentration and control-system gaps require stronger governance diligence
Show more
Detailed Analysis
Founder and MD Sandeep Agarwal holds B.Tech and M.Tech degrees from IIT Roorkee and the Company states that he has 25+ years of renewable-energy experience. Greenzo itself, however, has only operated since 2022
The FY25 board had seven directors, including two additional independent directors, with Audit and Nomination & Remuneration Committees constituted. Independence was strengthened only late in FY25
RPTs are disclosed and stated to be arm's length, but excess remuneration paid to four executive/director-level personnel required shareholder waivers, creating a material governance concern
Valuation Metrics
25.0%
1.0/5
Current pricing discounts very large future order conversion and earnings growth, while FY25 audited profitability and cash generation provide little valuation support.
Show more
Detailed Analysis
At roughly 530–540x FY25 earnings, Greenzo trades at an extreme premium to listed clean-energy/energy-transition companies such as Advait Energy Transitions at roughly 42x earnings
EV/core EBITDA is approximately 748x because FY25 core EBITDA was below INR 1 crore. Waaree Energies currently trades near 11x EV/EBITDA and Advait around 27x
Approximately 9.3–9.5x book is difficult to support while Greenzo generates only ~2.4% ROE, even allowing for its early manufacturing ramp-up
TOTAL
100%
2.5/5
Weighted Composite Score
Per Share Price
₹625.0
As of 24 Oct 2026
Lot Size
100.0 Shares
Minimum Investment
₹62,500.0 / 100 shares
Market Cap. (₹ Cr)
Revenue FY’25
PAT FY’25
P/E Multiple
Face Value
₹ 10.0Offer Price
₹ 625.0Lot Size
100.0 sharesSale Type
Secondary SalePAT FY’25
₹ 1.4 CrPAT Margin (%)
8.6 %P/E Multiple
529.7xCAGR Growth 2Y
8.0 %ROE (FY’25)
2.4 %ROCE (FY’25)
2.5 %Price to Book Value ratio
9.6xDebt/Equity (FY’25)
0.0xMerchant banker appointed
❌ NoCompany Website
www.greenzoenergyindia.comDisclaimer: Unlisted shares are unregulated & illiquid. This is NOT investment advice. Please do your own due diligence before investing.
Minimum Investment
₹62,500.0 / 100 sharesShares Lot 100 X 1
Investment amount
₹62,500.0
Overview
Business
Business Model
Geographical Presence
Sales Channel
Key Risk Factor
Financial Highlights
Income Statement
Revenue growth with EBITDA and PAT margins
| Financial Metric | FY 2024 | FY 2025 |
|---|---|---|
| Revenue (₹ Cr) | 14.8 | 16.0 |
| Growth (%) | 0.0% | 8.0% |
| EBITDA (₹ Cr) | 1.4 | 2.2 |
| EBITDA Margin (%) | 9.2% | 14.1% |
| PAT (₹ Cr) | 1.0 | 1.4 |
| PAT Margin (%) | 6.8% | 8.6% |
OBSERVATIONS & INSIGHTS
Revenue increased from ₹14.8 Cr in FY24 to ₹16.0 Cr in FY25, representing annual growth of 8.0%
EBITDA increased from ₹1.4 Cr to ₹2.2 Cr, while EBITDA margin expanded by 4.9 percentage points from 9.2% to 14.1%
PAT increased from ₹1.0 Cr to ₹1.4 Cr, while PAT margin improved from 6.8% to 8.6%. However, FY25 operating cash flow remained negative at ₹44.5 Cr
Balance Sheet
| Financial Metric | FY 2024 | FY 2025 |
|---|---|---|
| EQUITY & LIABILITIES | ₹ 63.8 Cr | ₹ 81.9 Cr |
| Net Worth | ₹ 55.4 Cr | ₹ 77.5 Cr |
| Share Capital | ₹ 10.9 Cr | ₹ 11.9 Cr |
| Reserves & Surplus | ₹ 44.5 Cr | ₹ 65.6 Cr |
| Total Liabilities | ₹ 8.4 Cr | ₹ 4.4 Cr |
| Current Liabilities | ₹ 7.9 Cr | ₹ 4.4 Cr |
| Borrowings | ₹ 0.0 Cr | ₹ 0.0 Cr |
| Trade Payables | ₹ 6.3 Cr | ₹ 3.4 Cr |
| Other Current Liabilities | ₹ 1.6 Cr | ₹ 1.0 Cr |
| Non-Current Liabilities | ₹ 0.5 Cr | ₹ 0.0 Cr |
| Borrowings | ₹ 0.5 Cr | ₹ 0.0 Cr |
| Other Non-Current Liabilities | ₹ 0.0 Cr | ₹ 0.0 Cr |
| ASSETS | ₹ 63.9 Cr | ₹ 81.9 Cr |
| Current Assets | ₹ 58.6 Cr | ₹ 61.3 Cr |
| Trade Receivables | ₹ 12.6 Cr | ₹ 18.1 Cr |
| Inventory | ₹ 0.1 Cr | ₹ 18.0 Cr |
| Cash & Cash Equivalents | ₹ 43.8 Cr | ₹ 5.1 Cr |
| Other Current Assets | ₹ 2.1 Cr | ₹ 20.1 Cr |
| Non-Current Assets | ₹ 5.3 Cr | ₹ 20.6 Cr |
| Fixed Assets | ₹ 5.3 Cr | ₹ 20.6 Cr |
| Other Non-Current Assets | ₹ 0.0 Cr | ₹ 0.0 Cr |
OBSERVATIONS & INSIGHTS
Shareholders’ wealth increased from ₹37.7 Cr in FY24 to ₹77.5 Cr in FY25, supported by higher share capital and reserves and surplus
Share-application money declined from ₹17.7 Cr to ₹0.0 Cr following the allotment of equity shares during FY25
Cash and cash equivalents declined sharply from ₹43.8 Cr to ₹5.1 Cr as funds were deployed toward inventory, receivables, advances and capital expenditure
Inventory increased from ₹0.1 Cr to ₹18.0 Cr, trade receivables rose from ₹12.6 Cr to ₹18.1 Cr and other current assets expanded from ₹2.1 Cr to ₹20.1 Cr
Fixed assets increased from ₹5.3 Cr in FY24 to ₹20.6 Cr in FY25, reflecting investment in plant, machinery and capital work-in-progress
Non-current borrowings declined from ₹0.5 Cr to ₹0.0 Cr, while current borrowings remained nil. However, the substantial reduction in cash indicates that expansion was primarily funded through equity capital
Cash Flow
| Financial Metric | FY 2024 | FY 2025 |
|---|---|---|
CFO (₹ Cr) Cash generated from core business operations. | -5.9 Cr | -44.5 Cr |
CFI (₹ Cr) Cash used for investments and long-term assets. | -5.2 Cr | -14.4 Cr |
CFF (₹ Cr) Cash flow related to funding and borrowings. | +54.9 Cr | +20.2 Cr |
Working Capital
| Efficiency Metric | FY 2023 | FY 2024 | FY 2025 |
|---|---|---|---|
Debtor Days Average number of days taken to collect customer payments. | - | - | - |
Creditor Days Average time taken to pay suppliers and vendors. | - | - | - |
Inventory Days Average number of days inventory remains unsold. | - | - | - |
CCC (Cash Conversion Cycle) (Debtor Days + Inventory Days - Creditor Days) | - | - | - |
Financial Ratios
Measures the company’s leverage relative to shareholder equity.
OBSERVATIONS & INSIGHTS
ROE declined from 5.3% in FY24 to 2.4% in FY25, while ROCE decreased from 3.4% to 2.5% because the capital base expanded faster than earnings. ROA improved marginally from 1.6% to 1.7%
Debt-to-equity remained at 0.0x in both years. FY25 interest coverage was 99.8x due to minimal finance costs, while FY24 coverage is not applicable because finance cost was nil
The current ratio increased from 7.4x to 13.9x. However, the improvement was driven by higher inventory, receivables and other current assets rather than operating cash generation
Industry Overview
Industry Drivers
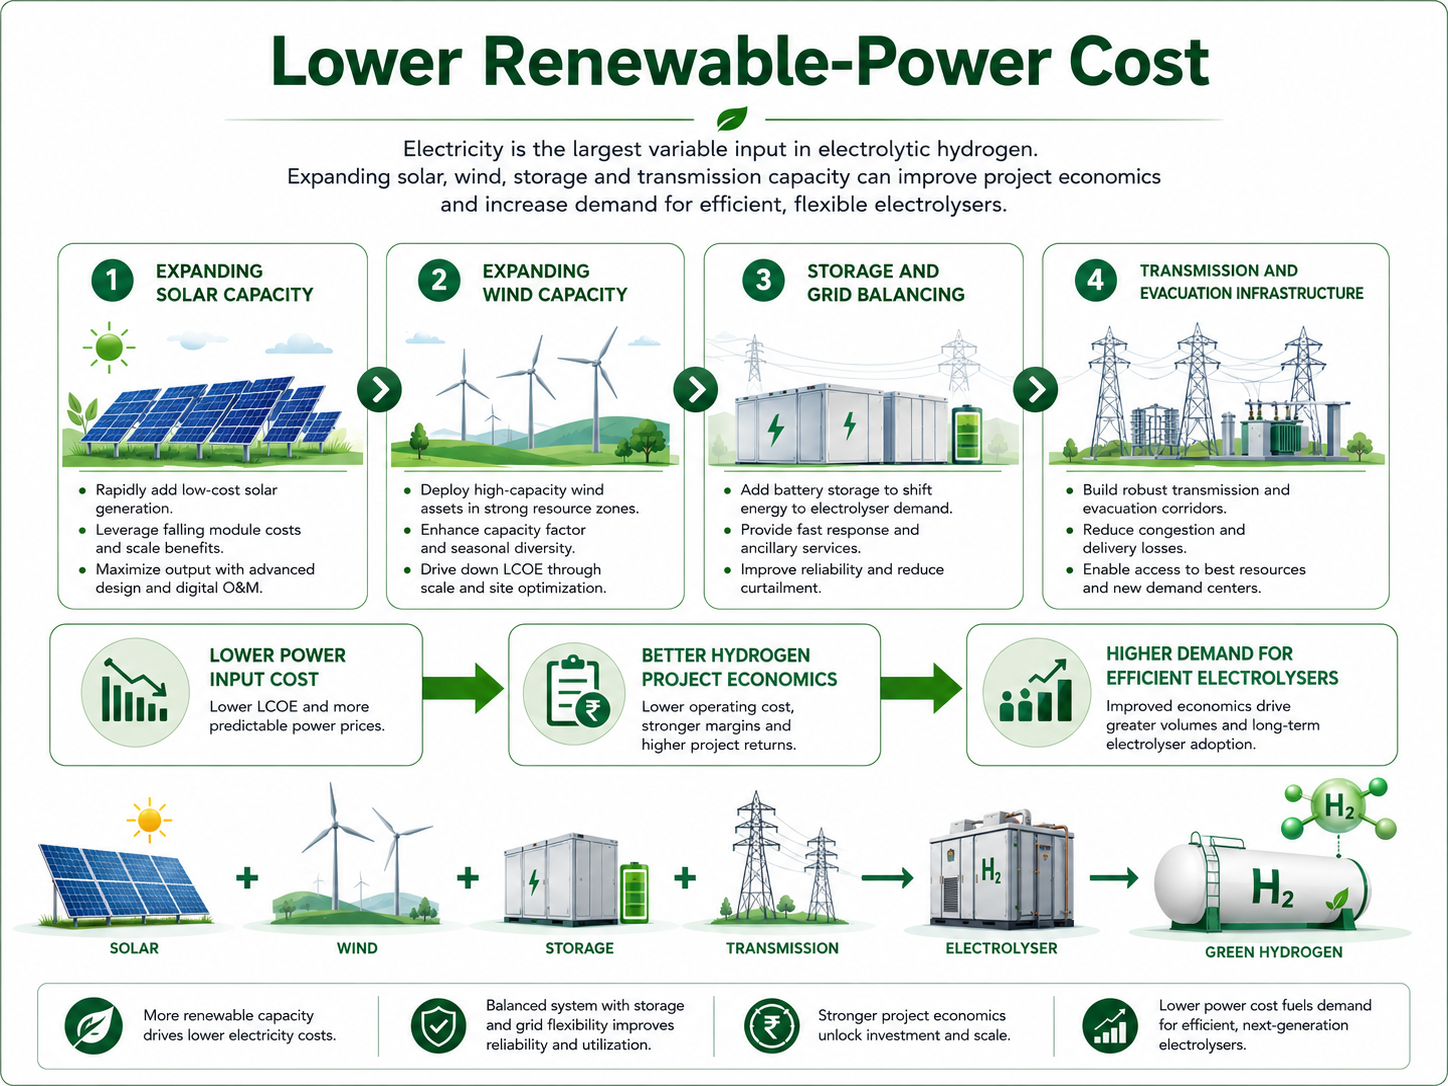
Lower Renewable-Power Cost
Electricity is the largest variable input in electrolytic hydrogen
Expanding solar, wind, storage and transmission capacity can improve project economics and increase demand for efficient, flexible electrolysers
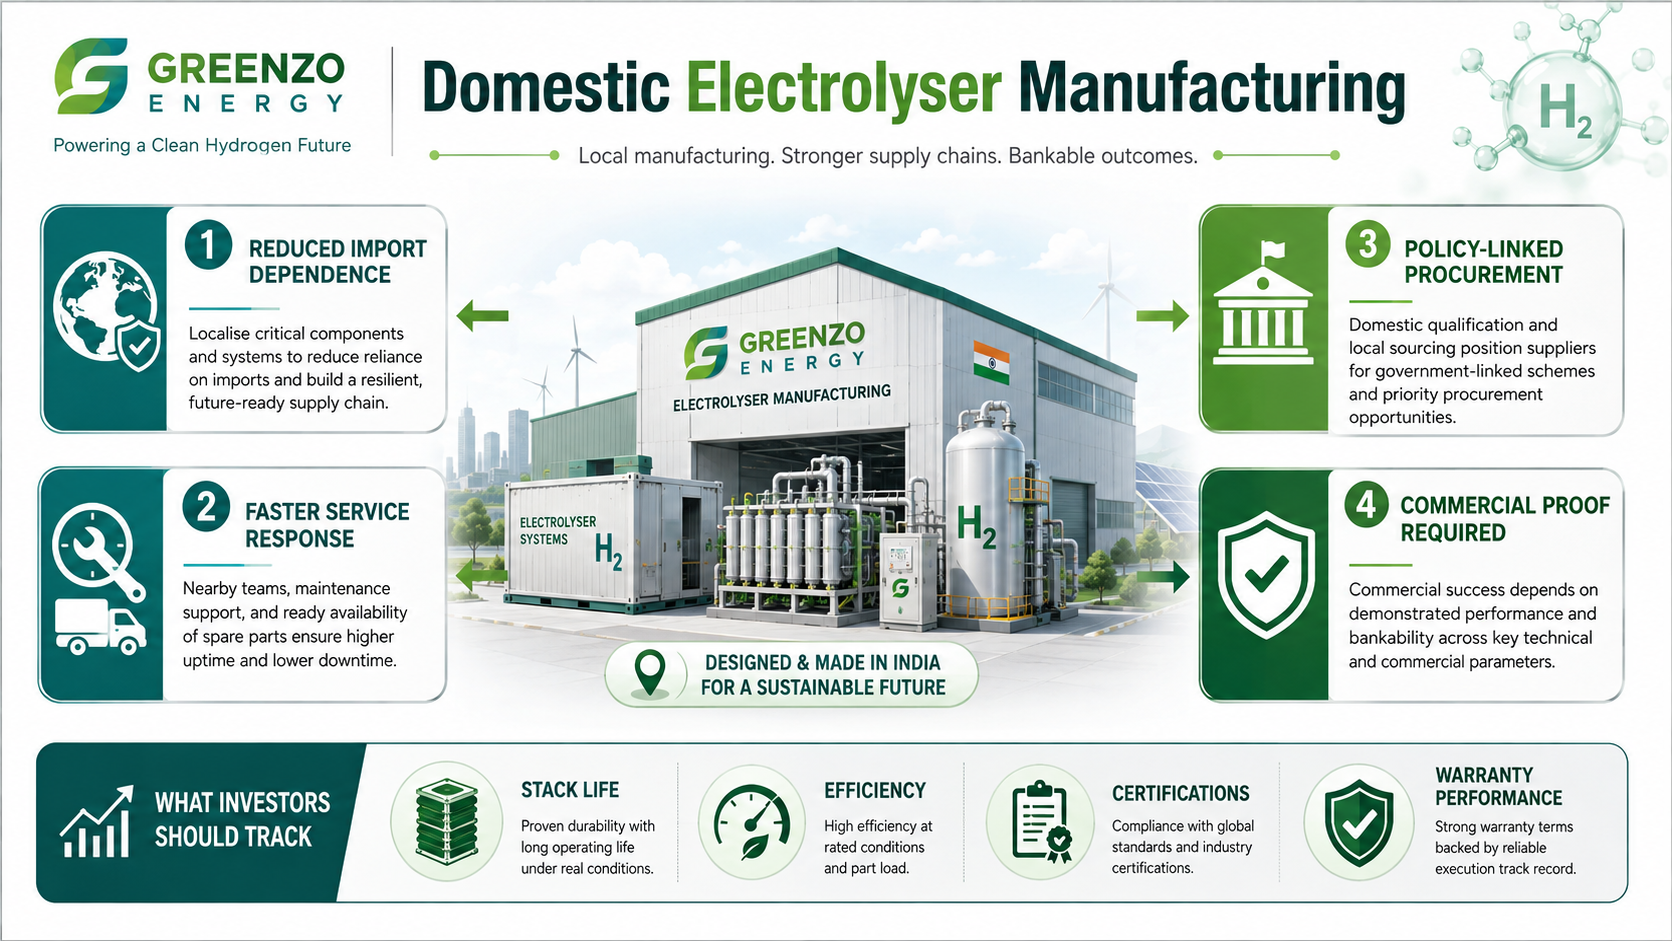
Domestic Electrolyser Manufacturing
Local manufacturing can reduce import dependence, shorten service response and qualify suppliers for policy-linked procurement
Commercial success still requires proven stack life, efficiency, certification and warranty support
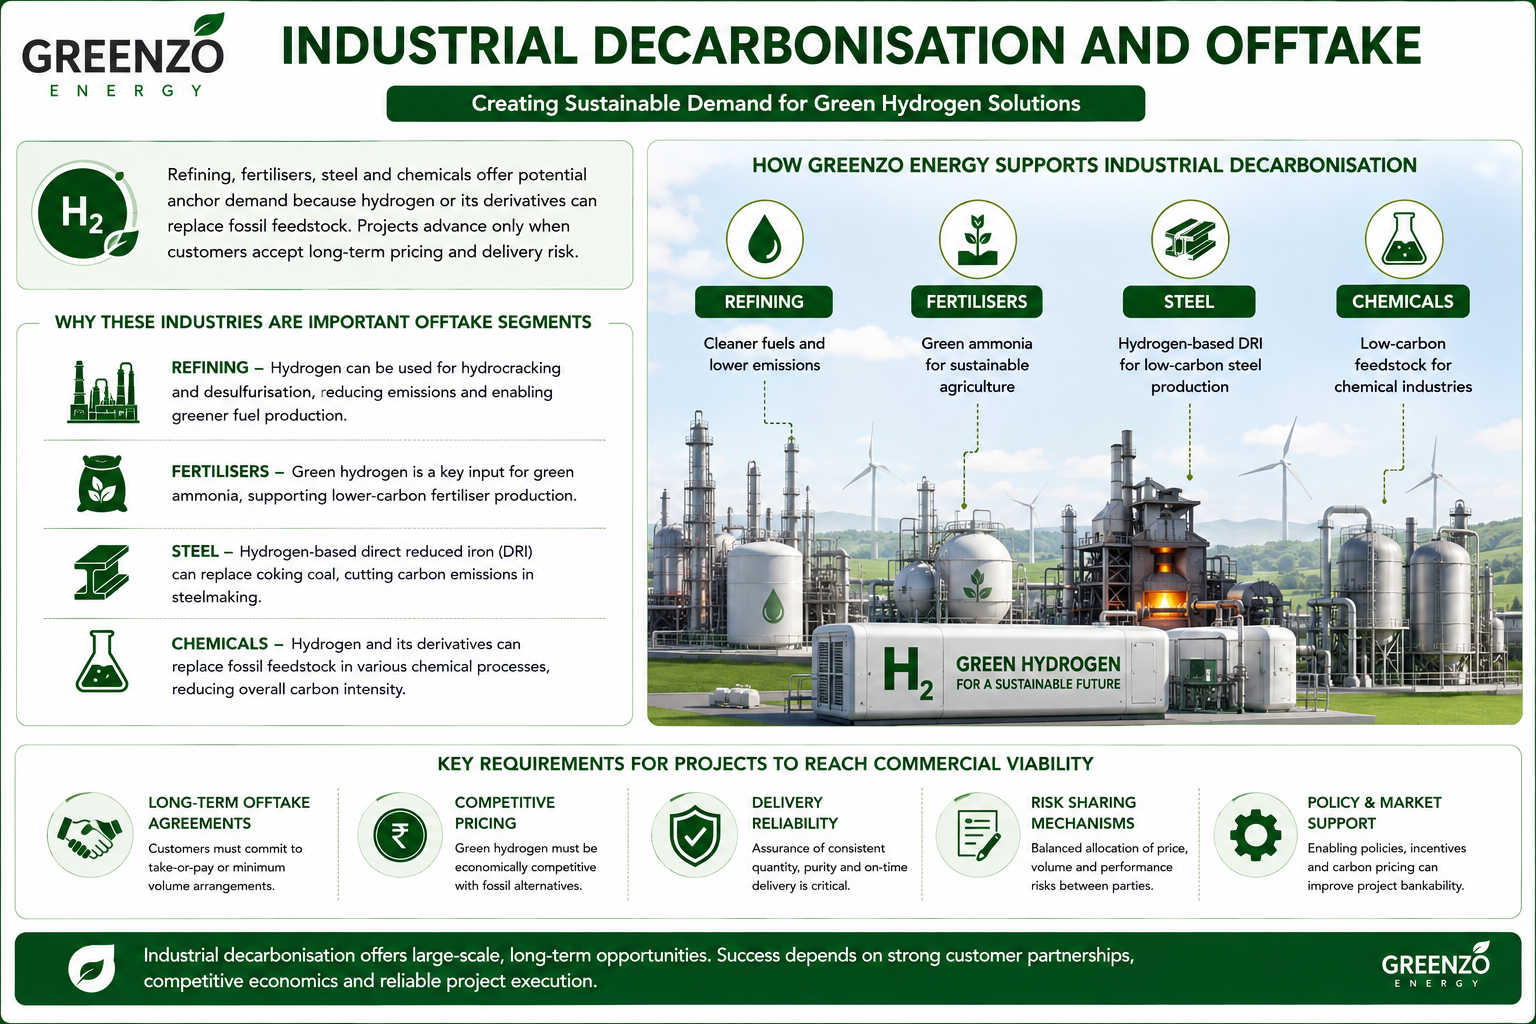
Industrial Decarbonisation and Offtake
Refining, fertilisers, steel and chemicals offer potential anchor demand because hydrogen or its derivatives can replace fossil feedstock
Projects advance only when customers accept long-term pricing and delivery risk
Green Ammonia and Export Corridors
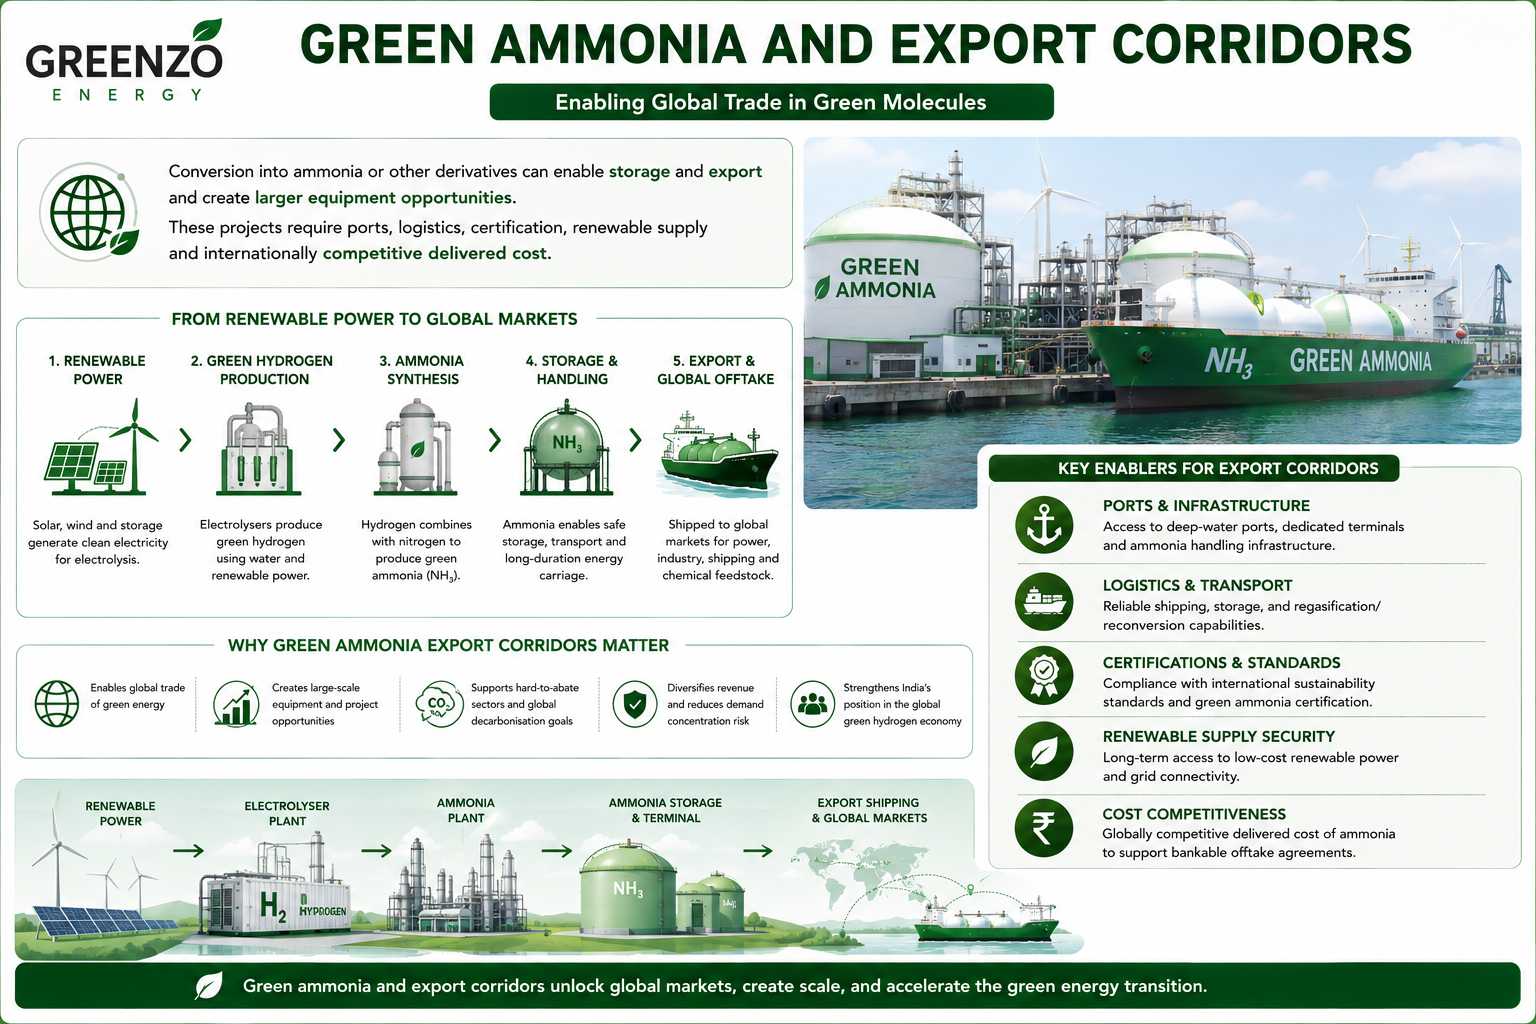
Conversion into ammonia or other derivatives can enable storage and export and create larger equipment opportunities
These projects require ports, logistics, certification, renewable supply and internationally competitive delivered cost
Government Policy Support
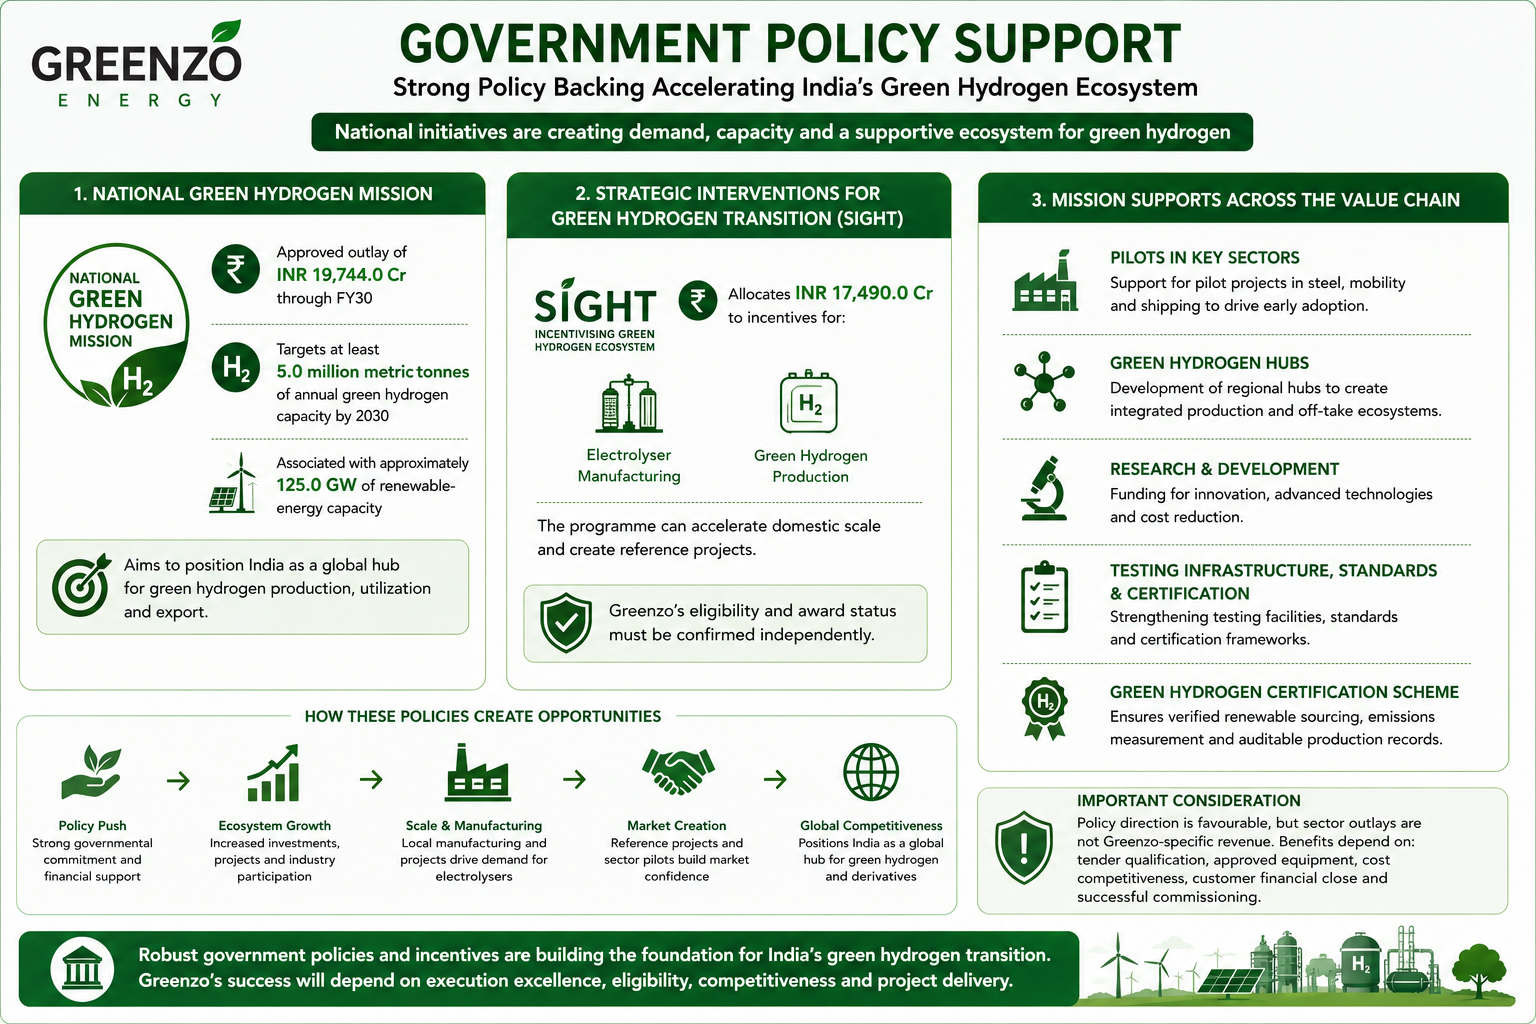
The National Green Hydrogen Mission has an approved outlay of INR 19,744.0 Cr through FY30 and targets at least 5.0 million metric tonnes of annual green-hydrogen capacity by 2030, associated with approximately 125.0 GW of renewable-energy capacity
The Strategic Interventions for Green Hydrogen Transition programme allocates INR 17,490.0 Cr to incentives for electrolyser manufacturing and green-hydrogen production. It can accelerate domestic scale and create reference projects, but Greenzo’s eligibility and award status must be confirmed independently
The Mission also supports pilots in steel, mobility and shipping, green-hydrogen hubs, research and development, testing infrastructure, standards and certification. India’s Green Hydrogen Certification Scheme increases the importance of verified renewable sourcing, emissions measurement and auditable production records
Policy direction is favourable, but sector outlays are not Greenzo-specific revenue. Benefits depend on tender qualification, approved equipment, cost competitiveness, customer financial close and successful commissioning
- Overview
- Business
- Financial Highlights
- Industry Overview
- Documentation
Get the Preqt App and keep in touch around the clock!
 Monitor your investments in real-time.
- Receive tailored deal suggestions.
- Get real-time updates and alerts.
