


Hindusthan Engineering and Industries Ltd. (HEIL)
Strength Behind MobilityMoving Industry Forward
IPO Review and Rating
Selective
Overall Recommendation
FY23-FY25 revenue CAGR is 29.6%, PAT CAGR is 76.6%, core EBITDA margin has expanded from 6.9% to 11.3%, gross D/E is only 0.3x, and FY25 operating cash flow recovered to INR 184.5 Cr. The business mix is also increasingly attractive. Engineering now contributes 82.7% of revenue, placing HEIL directly in the Indian railway-investment cycle, while FY25 exports increased to INR 215.8 Cr. The balance sheet contains INR 443.4 Cr of cash and other bank balances, leaving net financial debt of only approximately INR 42.6 Cr
PARAMETER
WEIGHT
SCORE
KEY FACTORS
Financial Performance
25.0%
3.6/5
Strong three-year growth, improving margins, low leverage and sharply recovered cash flow are major positives
Show more
Detailed Analysis
FY25 growth moderated to 7.1%, but FY23-FY25 revenue CAGR remains strong at 29.6%, reflecting major scaling of the Engineering business
Core EBITDA increased to INR 332.8 Cr, with margin improving consistently from 6.9% in FY23 to 11.3% in FY25
PAT margin remained healthy at 7.4%, broadly stable against 7.5% in FY24 and materially above 4.0% in FY23
Gross borrowings were INR 486.0 Cr, but substantial equity of INR 1,609.6 Cr keeps D/E very comfortable at 0.3x
FY25 ROE on average equity was approximately 14.5%, indicating reasonable but not exceptional capital efficiency
Industry
25.0%
3.5/5
Record railway investment and rising exports create strong structural growth
Show more
Detailed Analysis
Railway engineering benefits from record Indian Railways capex, freight expansion and rolling-stock modernisation, although jute and chemicals are slower-growth segments
Rail rolling stock and infrastructure are in a strong investment cycle, while the Company's legacy jute and chemical businesses are more mature
Railway equipment has meaningful qualification barriers, but HEIL competes with established listed manufacturers and order awards remain tender-driven
Government railway spending is highly supportive, but dependence on public-sector procurement and technical approvals creates policy and execution exposure
FY25 overseas sales increased to INR 215.8 Cr, demonstrating meaningful export capability beyond the domestic railway cycle
Management
25.0%
3.5/5
Deep operating experience and strong independent-board representation are positives, but persistent qualified audits and sizeable related-party financial exposures materially reduce governance comfort
Show more
Detailed Analysis
Executive Chairman Vikram Aditya Mody has more than 40.0 years of experience across engineering, jute, chemicals, sales and administration
Independent representation is strong, supported by Rajendra Kumar Duggar, Mool Chand Gauba and subsequently Itei Bubna
No promoter-share pledge is disclosed, but the FY25 consolidated audit opinion is qualified on multiple long-standing accounting and recoverability matters
Valuation Metrics
25.0%
4.1/5
HEIL is exceptionally inexpensive on earnings, sales, book value and EV/EBITDA
Show more
Detailed Analysis
At 7.6x, HEIL trades approximately 85.7% below the supplied industry P/E of 53.4x and substantially below listed rail peers
Estimated FY25 EV/EBITDA is only 4.8x, dramatically below comparable rail-engineering companies
At approximately 1.0x book, valuation is highly reasonable given 14.5% ROE, strong liquidity and positive earnings
TOTAL
100%
3.7/5
Weighted Composite Score
Per Share Price
₹1065.0
As of 24 Oct 2026
Lot Size
50.0 Shares
Minimum Investment
₹53,250.0 / 50 shares
Market Cap. (₹ Cr)
Revenue FY’25
PAT FY’25
P/E Multiple
Face Value
₹ 10.0Lot Size
50.0 sharesPAT FY’25
₹ 218.3 CrPAT Margin (%)
7.4 %P/E Multiple
7.6xCAGR Growth 2Y
29.6 %ROE (FY’25)
14.5 %ROCE (FY’25)
15.1 %Price to Book Value ratio
1.0xDebt/Equity (FY’25)
0.3xMerchant banker appointed
❌ NoCompany Website
heilindia.comDisclaimer: Unlisted shares are unregulated & illiquid. This is NOT investment advice. Please do your own due diligence before investing.
Minimum Investment
₹53,250.0 / 50 sharesShares Lot 50 X 1
Investment amount
₹53,250.0
Overview
Business
Products
Business Model
Geographical Presence
Sales Channel
Financial Highlights
Income Statement
Revenue growth with EBITDA and PAT margins
| Financial Metric | FY 2023 | FY 2024 | FY 2025 |
|---|---|---|---|
| Revenue (₹ Cr) | 1,756.2 | 2,754.4 | 2,949.9 |
| Growth (%) | 0.0% | 56.8% | 7.1% |
| EBITDA (₹ Cr) | 120.6 | 300.2 | 332.8 |
| EBITDA Margin (%) | 6.9% | 10.9% | 11.3% |
| PAT (₹ Cr) | 70.0 | 207.3 | 218.3 |
| PAT Margin (%) | 4.0% | 7.5% | 7.4% |
OBSERVATIONS & INSIGHTS
Revenue increased from ₹1,756.2 Cr in FY23 to ₹2,754.4 Cr in FY24 and ₹2,949.9 Cr in FY25. The resulting FY23-FY25 CAGR was 29.6%, although annual growth moderated sharply from 56.8% in FY24 to 7.1% in FY25
EBITDA increased from ₹120.6 Cr in FY23 to ₹300.2 Cr in FY24 and ₹332.8 Cr in FY25. EBITDA margin expanded from 6.9% to 10.9% and 11.3%
PAT rose from ₹70.0 Cr in FY23 to ₹207.3 Cr in FY24 and ₹218.3 Cr in FY25. PAT margin improved from 4.0% to 7.5% in FY24, then remained broadly stable at 7.4% in FY25 despite slower top-line growth
FY25 engineering segment revenue was about ₹2,440.6 Cr, or 82.7% of total revenue, and segment result was about ₹282.6 Cr
Balance Sheet
| Financial Metric | FY 2023 | FY 2024 | FY 2025 |
|---|---|---|---|
| EQUITY & LIABILITIES | ₹ 1,803.8 Cr | ₹ 2,219.5 Cr | ₹ 2,433.3 Cr |
| Net Worth | ₹ 1,206.9 Cr | ₹ 1,398.8 Cr | ₹ 1,609.5 Cr |
| Share Capital | ₹ 14.7 Cr | ₹ 14.7 Cr | ₹ 14.7 Cr |
| Reserves & Surplus | ₹ 1,192.2 Cr | ₹ 1,384.1 Cr | ₹ 1,594.8 Cr |
| Total Liabilities | ₹ 596.9 Cr | ₹ 820.7 Cr | ₹ 823.8 Cr |
| Current Liabilities | ₹ 523.2 Cr | ₹ 751.7 Cr | ₹ 746.7 Cr |
| Borrowings | ₹ 283.8 Cr | ₹ 410.3 Cr | ₹ 474.0 Cr |
| Trade Payables | ₹ 160.9 Cr | ₹ 280.4 Cr | ₹ 229.8 Cr |
| Other Current Liabilities | ₹ 78.5 Cr | ₹ 61.0 Cr | ₹ 42.9 Cr |
| Non-Current Liabilities | ₹ 73.7 Cr | ₹ 69.0 Cr | ₹ 77.1 Cr |
| Borrowings | ₹ 0.0 Cr | ₹ 0.0 Cr | ₹ 11.9 Cr |
| Other Non-Current Liabilities | ₹ 73.7 Cr | ₹ 69.0 Cr | ₹ 65.2 Cr |
| ASSETS | ₹ 1,803.7 Cr | ₹ 2,219.5 Cr | ₹ 2,433.4 Cr |
| Current Assets | ₹ 1,273.3 Cr | ₹ 1,647.5 Cr | ₹ 1,895.1 Cr |
| Trade Receivables | ₹ 220.9 Cr | ₹ 250.6 Cr | ₹ 287.6 Cr |
| Inventory | ₹ 369.8 Cr | ₹ 696.8 Cr | ₹ 694.1 Cr |
| Cash & Cash Equivalents | ₹ 63.1 Cr | ₹ 20.1 Cr | ₹ 242.8 Cr |
| Other Current Assets | ₹ 619.5 Cr | ₹ 680.0 Cr | ₹ 670.6 Cr |
| Non-Current Assets | ₹ 530.4 Cr | ₹ 572.0 Cr | ₹ 538.3 Cr |
| Fixed Assets | ₹ 345.4 Cr | ₹ 335.5 Cr | ₹ 360.2 Cr |
| Other Non-Current Assets | ₹ 185.0 Cr | ₹ 236.5 Cr | ₹ 178.1 Cr |
OBSERVATIONS & INSIGHTS
Shareholders' wealth increased from ₹1,206.9 Cr in FY23 to ₹1,398.8 Cr in FY24 and ₹1,609.6 Cr in FY25, supported by retained earnings and other equity
Current borrowings rose from ₹283.8 Cr in FY23 to ₹474.0 Cr in FY25, and FY25 also included ₹11.9 Cr of non-current borrowing
Cash and cash equivalents increased from about ₹20.1 Cr in FY24 to ₹242.8 Cr in FY25. The increase provides a stronger cash buffer
Inventory rose from ₹369.8 Cr in FY23 to ₹696.8 Cr in FY24 and remained high at ₹694.1 Cr in FY25
Cash Flow
| Financial Metric | FY 2023 | FY 2024 | FY 2025 |
|---|---|---|---|
CFO (₹ Cr) Cash generated from core business operations. | -15.4 Cr | -46.3 Cr | +184.5 Cr |
CFI (₹ Cr) Cash used for investments and long-term assets. | -76.2 Cr | -93.8 Cr | +5.9 Cr |
CFF (₹ Cr) Cash flow related to funding and borrowings. | +119.3 Cr | +97.1 Cr | +32.3 Cr |
Working Capital
| Efficiency Metric | FY 2023 | FY 2024 | FY 2025 |
|---|---|---|---|
Debtor Days Average number of days taken to collect customer payments. | - | - | - |
Creditor Days Average time taken to pay suppliers and vendors. | - | - | - |
Inventory Days Average number of days inventory remains unsold. | - | - | - |
CCC (Cash Conversion Cycle) (Debtor Days + Inventory Days - Creditor Days) | - | - | - |
Financial Ratios
Measures the company’s leverage relative to shareholder equity.
OBSERVATIONS & INSIGHTS
ROE increased from 6.0% in FY23 to 15.9% in FY24 before moderating to 14.5% in FY25. The FY25 decline reflects slower PAT growth against a larger average equity base
ROCE improved from 6.2% in FY23 to 16.0% in FY24 and remained healthy at 15.1% in FY25. Returns therefore stayed broadly aligned with the stronger post-FY23 operating-margin profile
Debt / equity increased modestly from 0.2x in FY23 to 0.3x in FY24-FY25 as current borrowings rose. Leverage remains moderate relative to net worth
Industry Overview
Industry Drivers
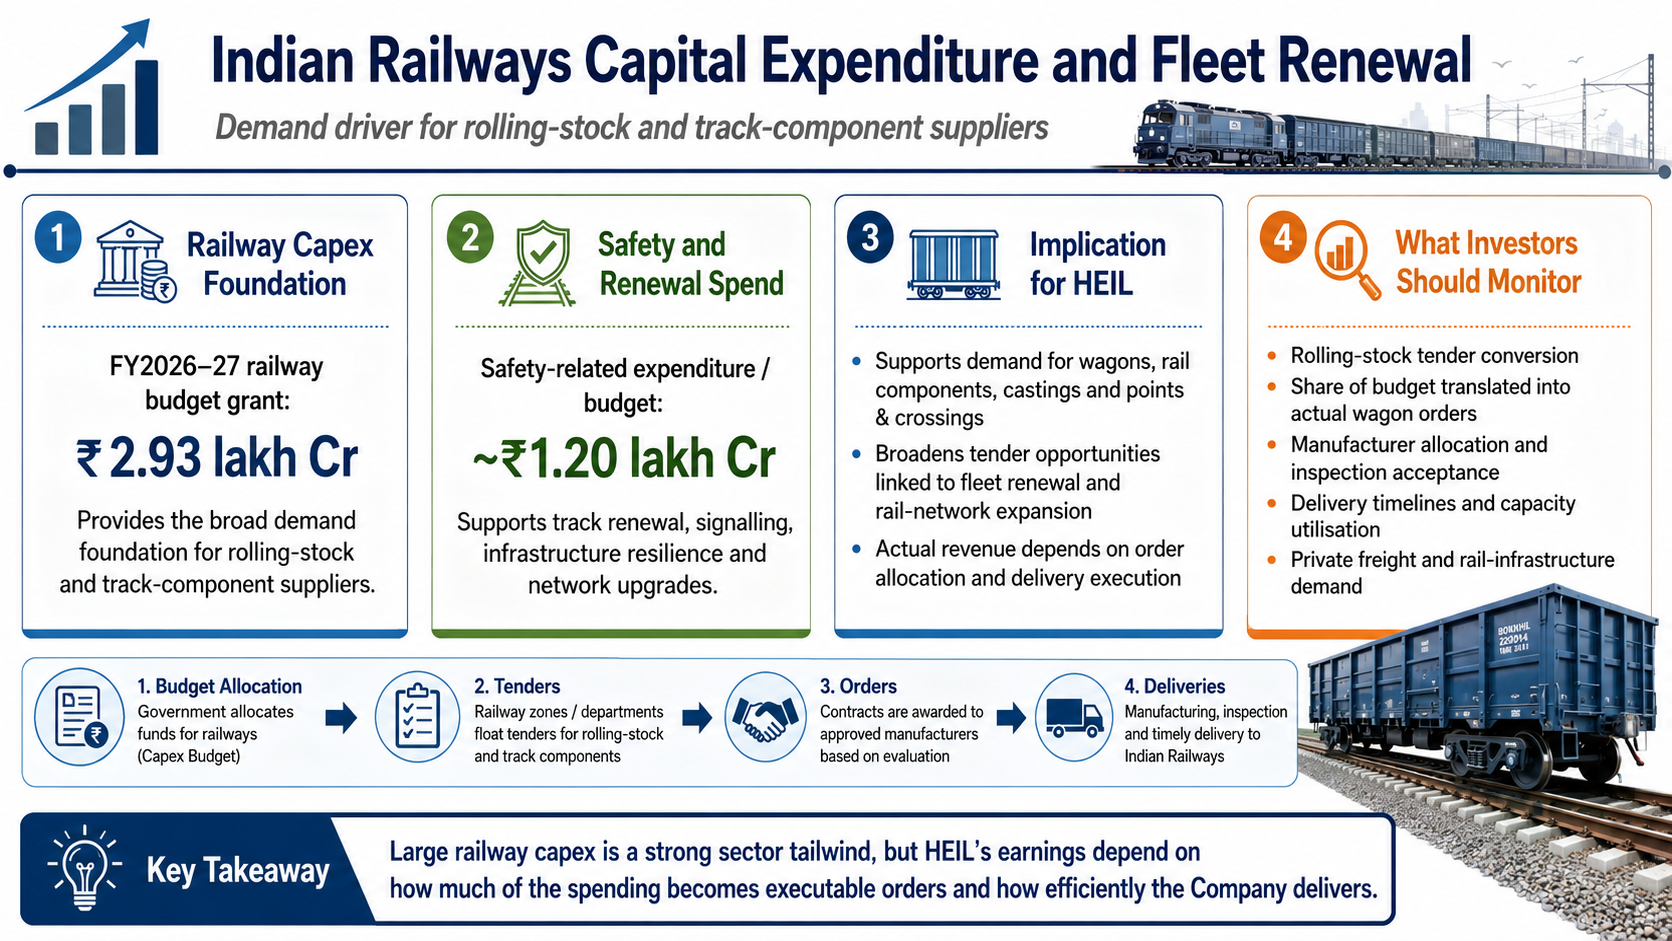
Indian Railways Capital Expenditure and Fleet Renewal
Railway capex provides the broad demand foundation for rolling-stock and track-component suppliers
The FY2026-27 railway budget grant is ₹2.93 lakh Cr, while safety-related expenditure / budget is about ₹1.20 lakh Cr
This spending supports network capacity, track renewal, signalling and fleet requirements, but wagon-company revenue depends on the portion converted into actual rolling-stock tenders and the manufacturer's allocation / delivery performance
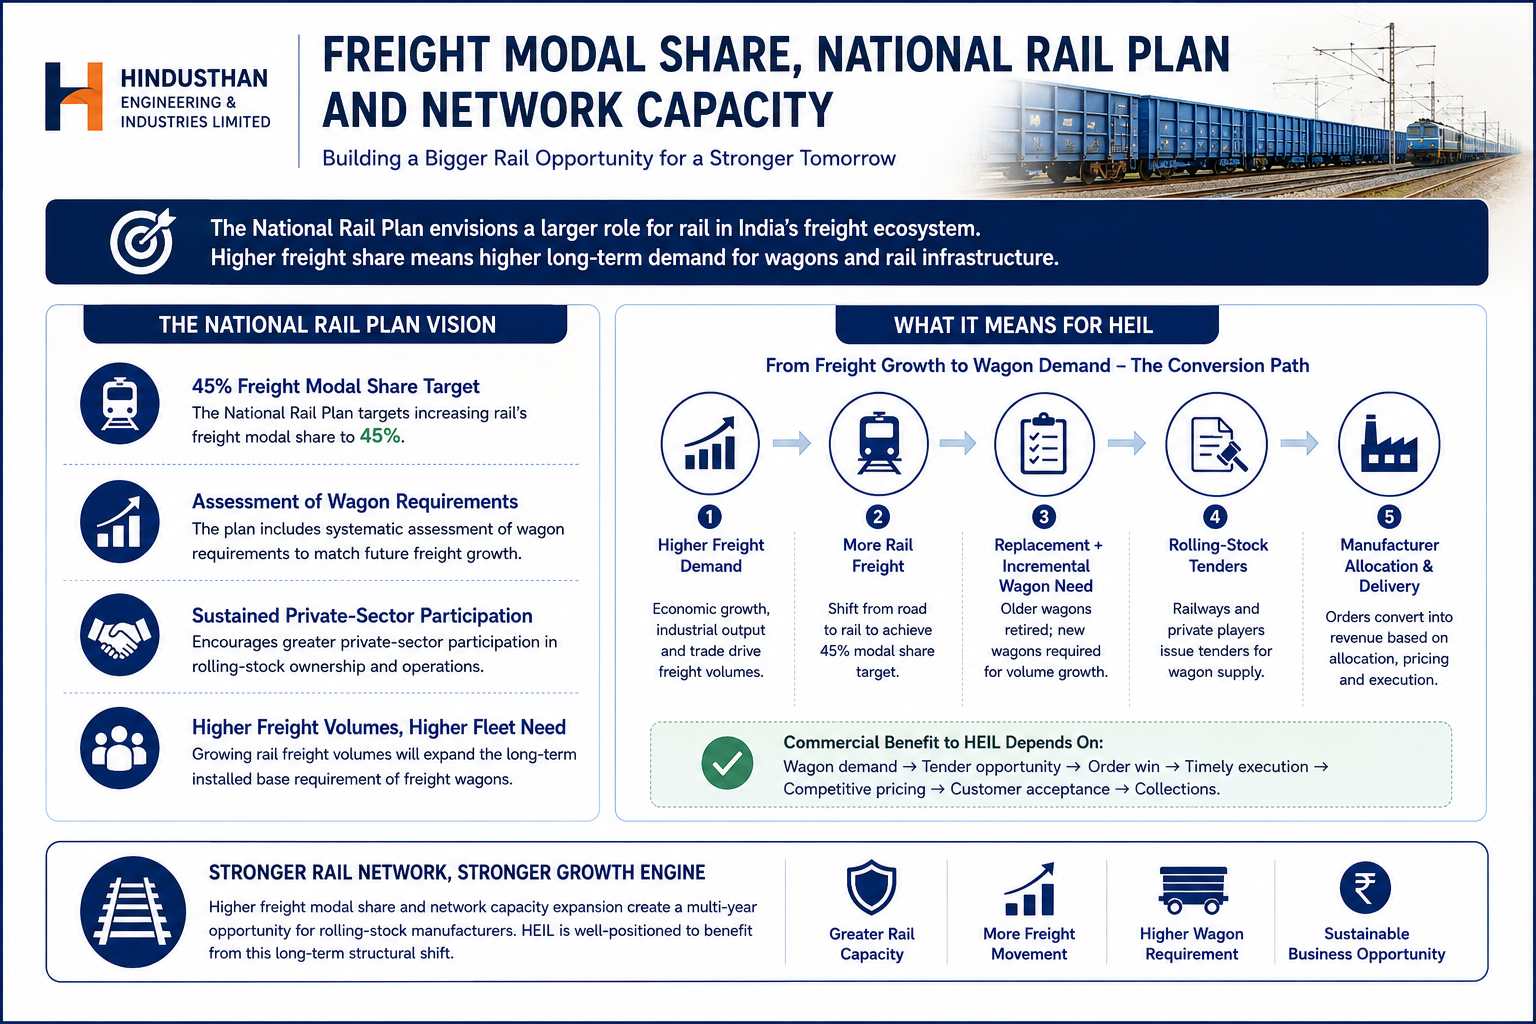
Freight Modal Share, National Rail Plan and Network Capacity
The National Rail Plan targets increasing rail's freight modal share to 45% and explicitly includes assessment of wagon requirements and sustained private-sector participation in rolling-stock ownership
Higher rail freight volumes expand the long-term installed fleet requirement
The commercial benefit to HEIL depends on whether freight growth translates into replacement and incremental wagon orders at remunerative pricing
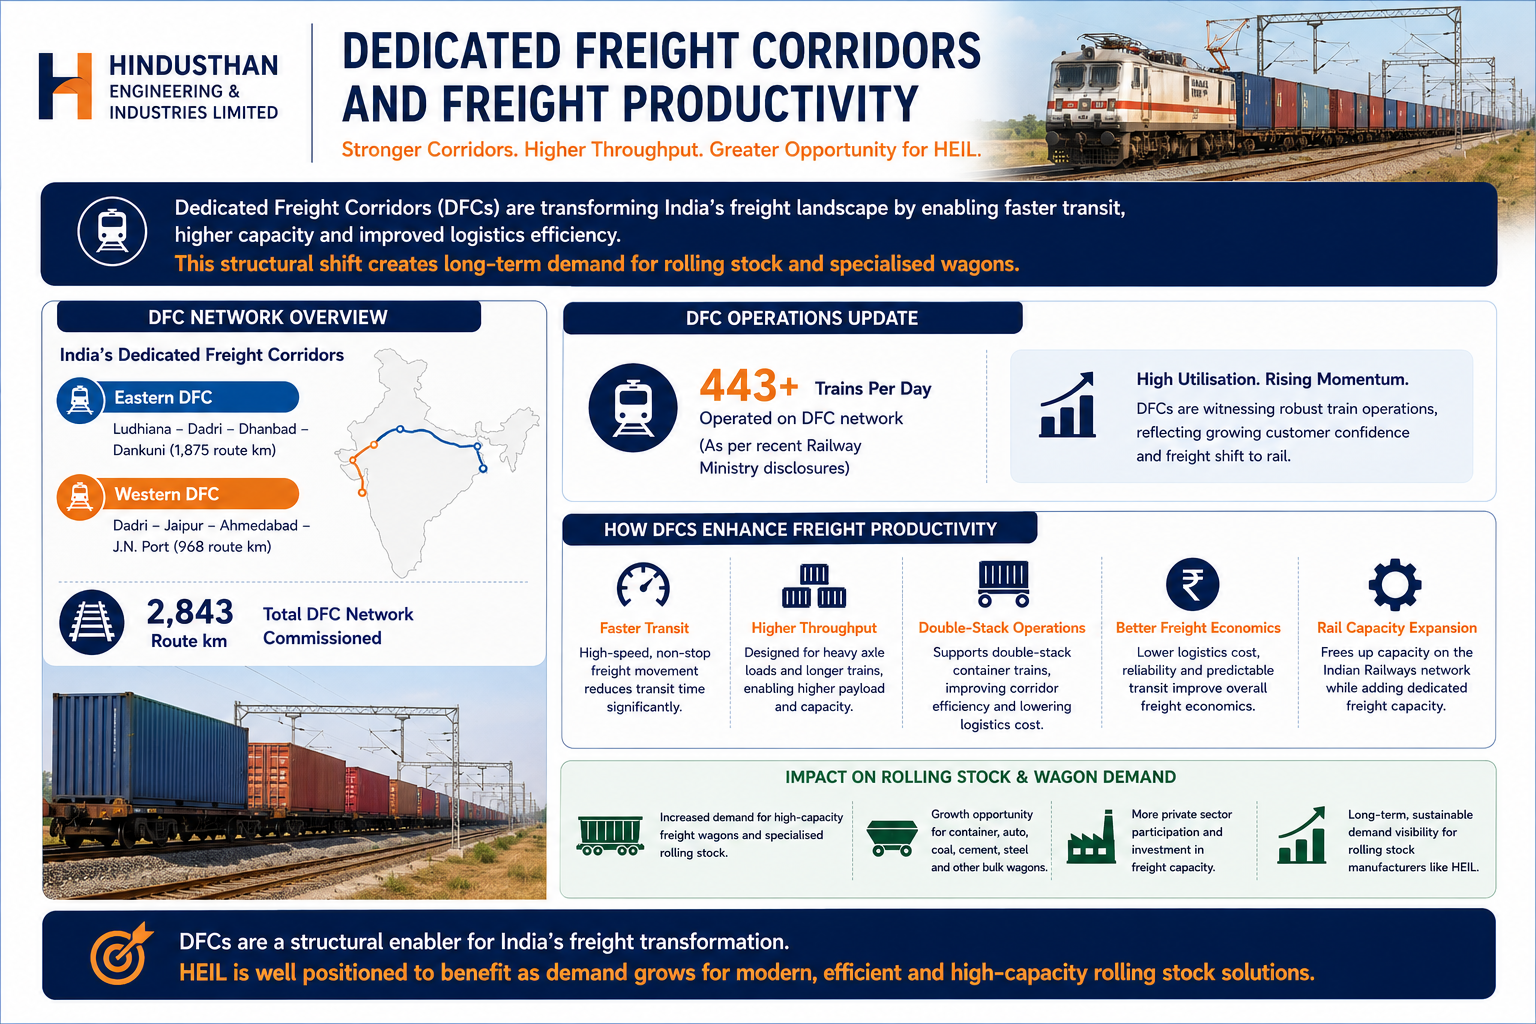
Dedicated Freight Corridors and Freight Productivity
The Eastern and Western Dedicated Freight Corridors, totalling 2,843 route km, have now been commissioned
Recent Railway Ministry disclosures indicate more than 443 trains per day are operated on the DFC network
Faster transit, higher throughput and double-stack container operations improve freight economics and can increase demand for suitable rolling stock, specialised wagons and private freight capacity over time
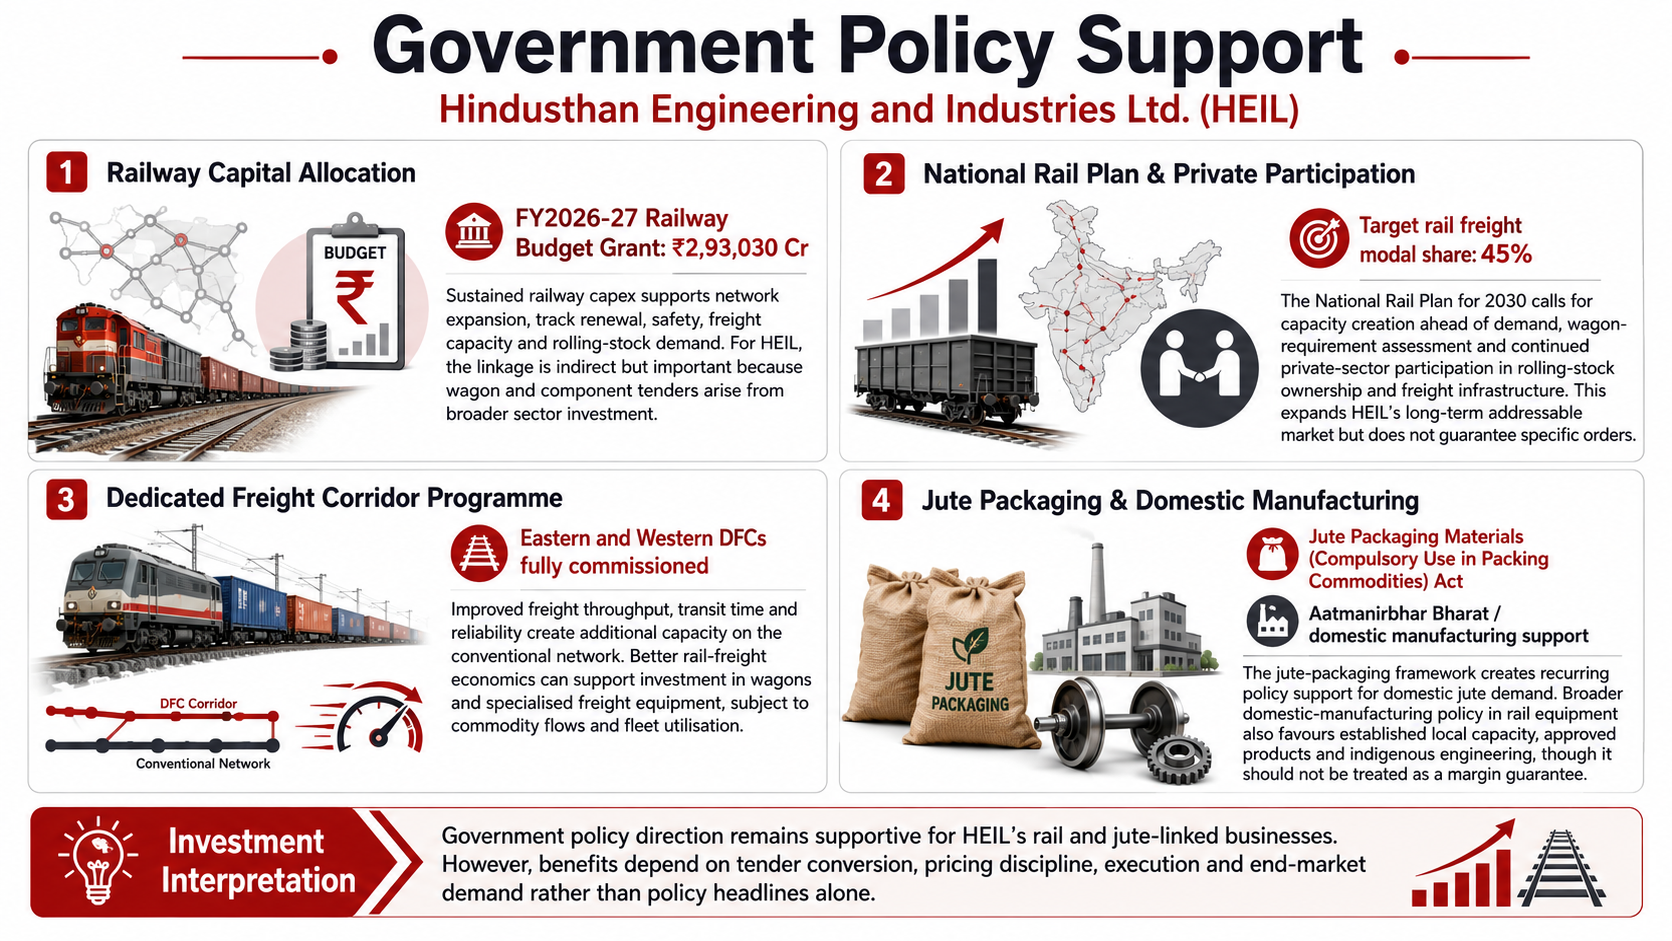
Government Policy Support
Railway capital allocation: Indian Railways has a FY2026-27 budget grant of ₹2,93,030 Cr, with substantial spending on safety and infrastructure
National Rail Plan and private participation: The National Rail Plan for 2030 targets a 45% freight modal share for rail and calls for capacity creation ahead of demand, assessment of wagon requirements and continued private-sector involvement in rolling-stock ownership and freight infrastructure
Dedicated Freight Corridor programme: The Eastern and Western DFCs have been fully commissioned, improving freight throughput, transit time and reliability and creating additional capacity on the conventional network
Jute packaging framework and domestic manufacturing: The Jute Packaging Materials (Compulsory Use in Packing Commodities) Act creates recurring policy support for domestic jute demand, with reservation levels periodically notified by the Ministry of Textiles
- Overview
- Business
- Financial Highlights
- Industry Overview
- Documentation
Get the Preqt App and keep in touch around the clock!
 Monitor your investments in real-time.
- Receive tailored deal suggestions.
- Get real-time updates and alerts.
