

Horizon Industrial Parks
Building Industrial EcosystemsEnabling Enterprise at Scale
IPO Summary (PrEqT)
Horizon Industrial Parks Limited is an institutional-scale developer, owner and operator of Grade A+ industrial and logistics infrastructure with a 58.58 msf network across 45 assets in 10 Indian markets as of May 2026. FY26 restated revenue from operations was INR 691.4 Cr, EBITDA was INR 607.8 Cr at a 79.2% margin, while the Company remained loss-making with a loss after tax of INR 203.6 Cr because finance costs and depreciation remain high. The IPO is a 100% fresh issue of up to INR 2,600 Cr at INR 57-60 per share, with INR 2,250.0 Cr proposed for debt repayment; this is expected to reduce the restated debt-equity ratio from 1.2x to approximately 0.5x. The investment case combines leadership in Grade A and in-city logistics, Blackstone sponsorship, high committed occupancy and a 30.0 msf development pipeline, against continued loss-making operations, leverage, execution, land/title, tenant, geographic-concentration and occupancy risks.
IPO Review Rating
Average
MainboardPowering Manufacturing and Logistics Through Future-Ready Industrial Spaces
Horizon Industrial Parks is fundamentally a large-scale institutional industrial and logistics real-estate platform with strong operating economics but weak reported bottom-line profitability. The key positive is that the IPO is structured as a 100.0% fresh issue of INR 2,600.0 Cr, with approximately INR 2,250.0 Cr going directly towards deleveraging rather than promoter monetisation. Post-IPO leverage should therefore improve materially. The industry backdrop, Blackstone sponsorship, large network, strong EBITDA margins and healthy operating cash flows support the investment case.
PARAMETER
WEIGHT
SCORE
KEY FACTORS
Financial Performance
40.0%
4.0/5
The financial profile is unusual: very high EBITDA margins and strong operating cash generation coexist with substantial accounting losses.
Show more
Detailed Analysis
Revenue increased from INR 228.9 Cr in FY24 to INR 691.4 Cr in FY26, implying a 73.8% CAGR
FY26 EBITDA stood at INR 607.8 Cr with an EBITDA margin of 79.2%, improving materially from 61.7% in FY24
FY26 PAT was INR -203.6 Cr, translating into a PAT margin of approximately -29.5%
FY26 D/E stood at 1.2x. Proposed debt repayment from IPO proceeds is expected to reduce it to approximately 0.6x
FY26 RoNW was -4.2%, reflecting the Company's continuing negative bottom-line profitability
Operating cash flow was positive at INR 235.1 Cr in FY25 and increased to INR 464.1 Cr in FY26
The largest customer contributed only 11.1% of FY26 revenue, although the Top 10 customers together accounted for 42.6%
Industry
15.0%
4.0/5
Industrial and logistics infrastructure remains one of the stronger structural real-estate segments in India.
Show more
Detailed Analysis
India's Grade A warehousing stock is projected to grow at approximately 25.3% CAGR from CY25 to CY30, reaching around 943.6 msf by CY30
Combined Grade A+B stock grew at 15.6% CAGR during CY20–CY25, while Grade A's share of total stock is expected to rise from 57.4% in CY25 to 76.2% by CY30
Policy environment is supportive but execution remains approval-intensive: 100.0% FDI is permitted under the automatic route for logistics/infrastructure, although land approvals, environmental clearances and local construction permissions remain material execution risks
Manufacturing and export growth provide strong downstream demand: India's total exports reached approximately USD 860.1 Bn in FY26, supporting incremental demand for organised logistics and industrial infrastructure
Management
15.0%
3.0/5
Blackstone sponsorship, a professional management team and no OFS are strong positives.
Show more
Detailed Analysis
Horizon is backed by Blackstone, whose promoter group brings 20+ years of operating experience in India and manages more than 1.2 Bn sq. ft. of logistics assets globally
3 of 6 Directors are Independent Directors, representing exactly 50.0% of the Board
Subsidiaries face 17 tax proceedings, 4 regulatory proceedings and 27 material civil proceedings against them
Subsidiaries face 17 tax proceedings, 4 regulatory proceedings and 27 material civil proceedings against them
Valuation
20.0%
2.0/5
Horizon is not readily valued using traditional earnings metrics because PAT and EPS remain negative.
Show more
Detailed Analysis
FY26 EPS is INR -1.2
Horizon appears expensive relative to available logistics-property proxies: Horizon trades at approximately 31.7x FY26 EV/EBITDA versus an indicative proxy-peer median of approximately 23.7x, representing a roughly 34% premium
At INR 60.0 versus FY26 NAV of INR 27.9 per share, the IPO is priced at approximately 2.2x P/B
FY26 RoNW is negative at -4.2%
Merchant Banker Track Record
10.0%
5.0/5
The five-BRLM syndicate is a clear strength. The representative recent IPO sample shows approximately 15.4% average listing gains, strong institutional execution capability and a generally robust primary-market track record.
Show more
Detailed Analysis
Five selected recent IPOs across Horizon's BRLMs generated an average listing gain of approximately 15.4%
Representative issues recorded average subscription of approximately 30.9x
All 5 of 5 selected IPOs opened above their respective issue prices, implying a 100.0% positive listing-opening rate in the sample
The issue is managed by JM Financial, Axis Capital, IIFL Capital, SBI Capital Markets and 360 ONE WAM, all established mainboard IPO intermediaries
TOTAL
100%
3.5/5
Weighted Composite Score
Issue Price
₹57.0 to ₹60.0
As of 29 Aug 2026
GMP
₹0.0
As of 29 Aug 2026
Estimated Gain / Loss
0.0%
Lot Size
250.0 Shares
Grey Market Premium (GMPs) are shared for knowledge purpose only. PrEqt doesn’t promote or execute the trades.
| Issue Size (in Cr) | |
|---|---|
| Overall | ₹2,600.0 Cr |
| Fresh Issue | ₹2,600.0 Cr |
| Offer for Sale | ₹0.0 Cr |
Minimum Investment
₹15,000.0 / 62,500 shares

Merchant Banker
JM Financial Ltd.; Axis Capital; IIFL Capital; SBI Capital Markets; 360 One WAM
IPO Document
RHP / Anchor Document
Offer Start Date
17th Aug 2026
Offer End Date
19th Aug 2026
Valuation
₹17,297.6 Cr
Revenue FY'26
₹767.8 Cr
PAT (FY'26)
₹-203.6 Cr
Issue Size (in Cr)
₹2,600.0 Cr
Face Value
₹ 10.0Offer Price
₹ 60.0Lot Size
250.0 sharesSale Type
Fresh capital onlyPAT (FY'26)
₹ -203.6 CrEBITDA (FY'26)
₹ 607.8 CrCAGR Growth 2Y
76.8 %ROE (FY'26)
-4.2 %ROCE (FY'26)
3.3 %Price to Book Value
3.7xDebt/Equity
1.2xCompany Website
www.hiparks.comExplore new deals
Overview
Fund Allocation
Total: ₹0 CrSource:Company DRHP
Timeline
IPO Open Date
To Be Announced
IPO Close Date
To Be Announced
Tentative Allotment
To Be Announced
Initiation of Refunds
To Be Announced
Credit of Shares to Demat
To Be Announced
Tentative Listing Date
To Be Announced
Business
Business Model
Sales Channel
Key Risk Factor
Financial Highlights
Income Statement
Revenue growth with EBITDA and PAT margins
| Financial Metric | FY 2024 | FY 2025 | FY 2026 |
|---|---|---|---|
| Revenue (₹ Cr) | 245.5 | 439.4 | 767.8 |
| Growth (%) | - | 70.5% | 77.1% |
| EBITDA (₹ Cr) | 151.5 | 339.1 | 607.8 |
| EBITDA Margin (%) | 61.7% | 77.2% | 79.2% |
| PAT (₹ Cr) | -162.2 | -178.8 | -203.6 |
| PAT Margin (%) | -70.9% | -45.8% | -29.5% |
OBSERVATIONS & INSIGHTS
Revenue increased 70.5% in FY25 and 77.2% in FY26, driven by rental income, asset/network expansion, new customers, leasing of vacant/new blocks and contractual rent escalations
EBITDA increased from INR 151.5 Cr in FY24 to INR 607.8 Cr in FY26 and margin expanded from 61.7% to 79.2% as the operating network scaled
PAT losses persisted because finance costs and depreciation remain substantial; FY26 finance cost was INR 539.0 Cr and depreciation/amortisation was INR 266.1 Cr
Balance Sheet
| Financial Metric | FY 2024 | FY 2025 | FY 2026 |
|---|---|---|---|
| Net Worth | ₹ 702.4 Cr | ₹ 1,178.7 Cr | ₹ 5,858.7 Cr |
| Total Assets | ₹ 4,993.2 Cr | ₹ 9,851.5 Cr | ₹ 13,495.1 Cr |
| Total Borrowing | ₹ 3,688.2 Cr | ₹ 7,009.1 Cr | ₹ 6,884.3 Cr |
| Reserves & Surplus | ₹ 166.7 Cr | ₹ 643.1 Cr | ₹ 3,409.2 Cr |
OBSERVATIONS & INSIGHTS
Total assets increased from INR 4,993.2 Cr in FY24 to INR 13,495.1 Cr in FY26, led by acquisitions, investment-property additions and development of the 30.03 msf pipeline
Total equity increased to INR 5,858.7 Cr in FY26 from INR 1,178.7 Cr in FY25 following rights/private placements, OCD conversion and merger-related share issuance
Borrowings remained INR 6,884.3 Cr at FY26, but current assets increased sharply to INR 2,601.9 Cr; the IPO is designed to use INR 2,250 Cr for debt repayment, further reducing balance-sheet leverage
Cash Flow
| Financial Metric | FY 2023 | FY 2024 | FY 2025 |
|---|---|---|---|
CFO (₹ Cr) Cash generated from core business operations. | +119.3 Cr | +235.1 Cr | +464.1 Cr |
CFI (₹ Cr) Cash used for investments and long-term assets. | -876.4 Cr | -1,596.3 Cr | -4,872.8 Cr |
CFF (₹ Cr) Cash flow related to funding and borrowings. | +794.3 Cr | +1,457.9 Cr | +4,638.1 Cr |
Working Capital
| Efficiency Metric | FY 2023 | FY 2024 | FY 2025 |
|---|---|---|---|
Debtor Days Average number of days taken to collect customer payments. | - | - | - |
Creditor Days Average time taken to pay suppliers and vendors. | - | - | - |
Inventory Days Average number of days inventory remains unsold. | - | - | - |
CCC (Cash Conversion Cycle) (Debtor Days + Inventory Days - Creditor Days) | - | - | - |
Financial Ratios
Measures the company’s leverage relative to shareholder equity.
OBSERVATIONS & INSIGHTS
Debt/Equity fell from 5.95x in FY25 to 1.2x in FY26 after a major increase in equity; the IPO further targets INR 2,250 Cr of debt repayment and is expected to reduce the RHP debt/equity ratio to ~0.5x
Current ratio moved from 0.3x in FY25 to 4.3x in FY26 after the balance sheet accumulated cash, bank balances and current investments alongside capital raising
Loss on average assets narrowed to (1.74%) in FY26; the direction improved, although the Company remained loss-making on an accounting basis
ROCE improved from 1.10% to 3.27% as EBIT scaled, but remains low relative to the capital employed in investment properties and development assets
Industry Overview
Industry Drivers
Industry Tailwind: Grade A Formalisation and Flight to Quality
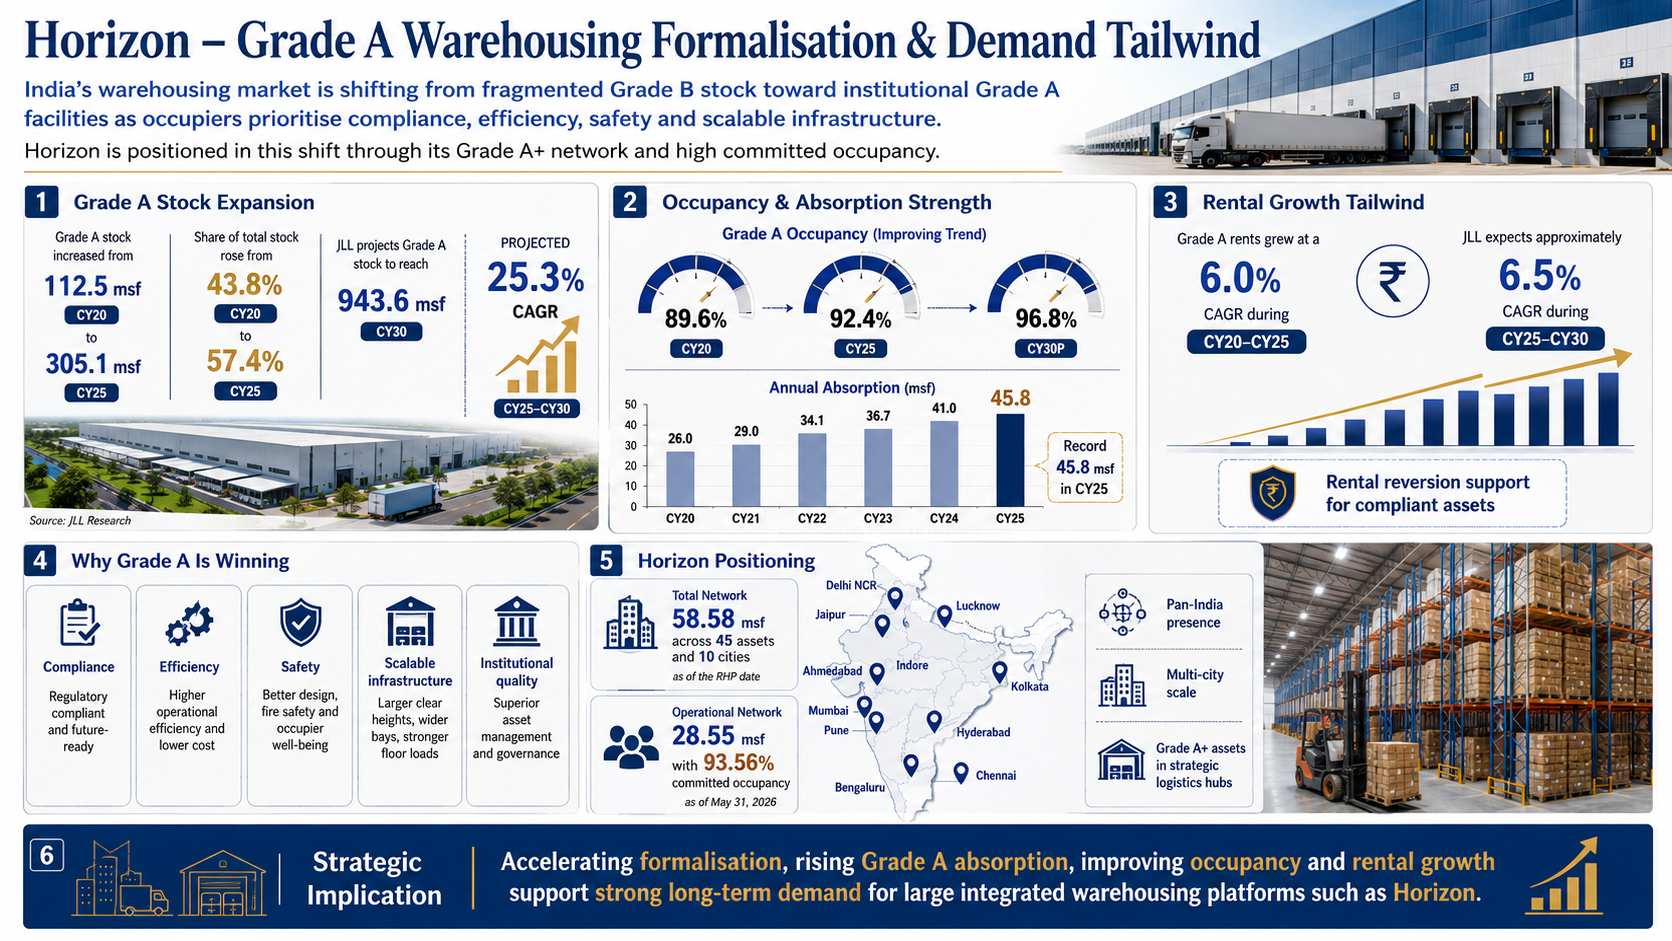
India's warehousing market is moving rapidly from fragmented Grade B stock toward institutional Grade A facilities as occupiers prioritise compliance, efficiency, safety and scalable infrastructure. JLL expects this formalisation to accelerate through CY30, creating a structural demand tailwind for large integrated developers. Horizon is directly positioned in this shift through its Grade A+ network and high committed occupancy.
The key tailwinds are:
Grade A stock increased from 112.5 msf in CY20 to 305.1 msf in CY25, lifting its share of total stock from 43.8% to 57.4%; JLL projects 943.6 msf by CY30, implying a 25.3% CAGR
Grade A occupancy improved from 89.6% in CY20 to 92.4% in CY25 and is projected to reach 96.8% by CY30, while annual absorption rose to a record 45.8 msf in CY25
Grade A rents grew at a 6.0% CAGR during CY20-CY25 and JLL expects ~6.5% CAGR during CY25-CY30, supporting rental reversion for well-located compliant assets
Horizon had a 58.58 msf Total Network across 45 assets and 10 cities as of the RHP date; its 28.55 msf Operational Network had 93.56% committed occupancy as of May 31, 2026.
Manufacturing, China+1 and Industrial Capex Expansion
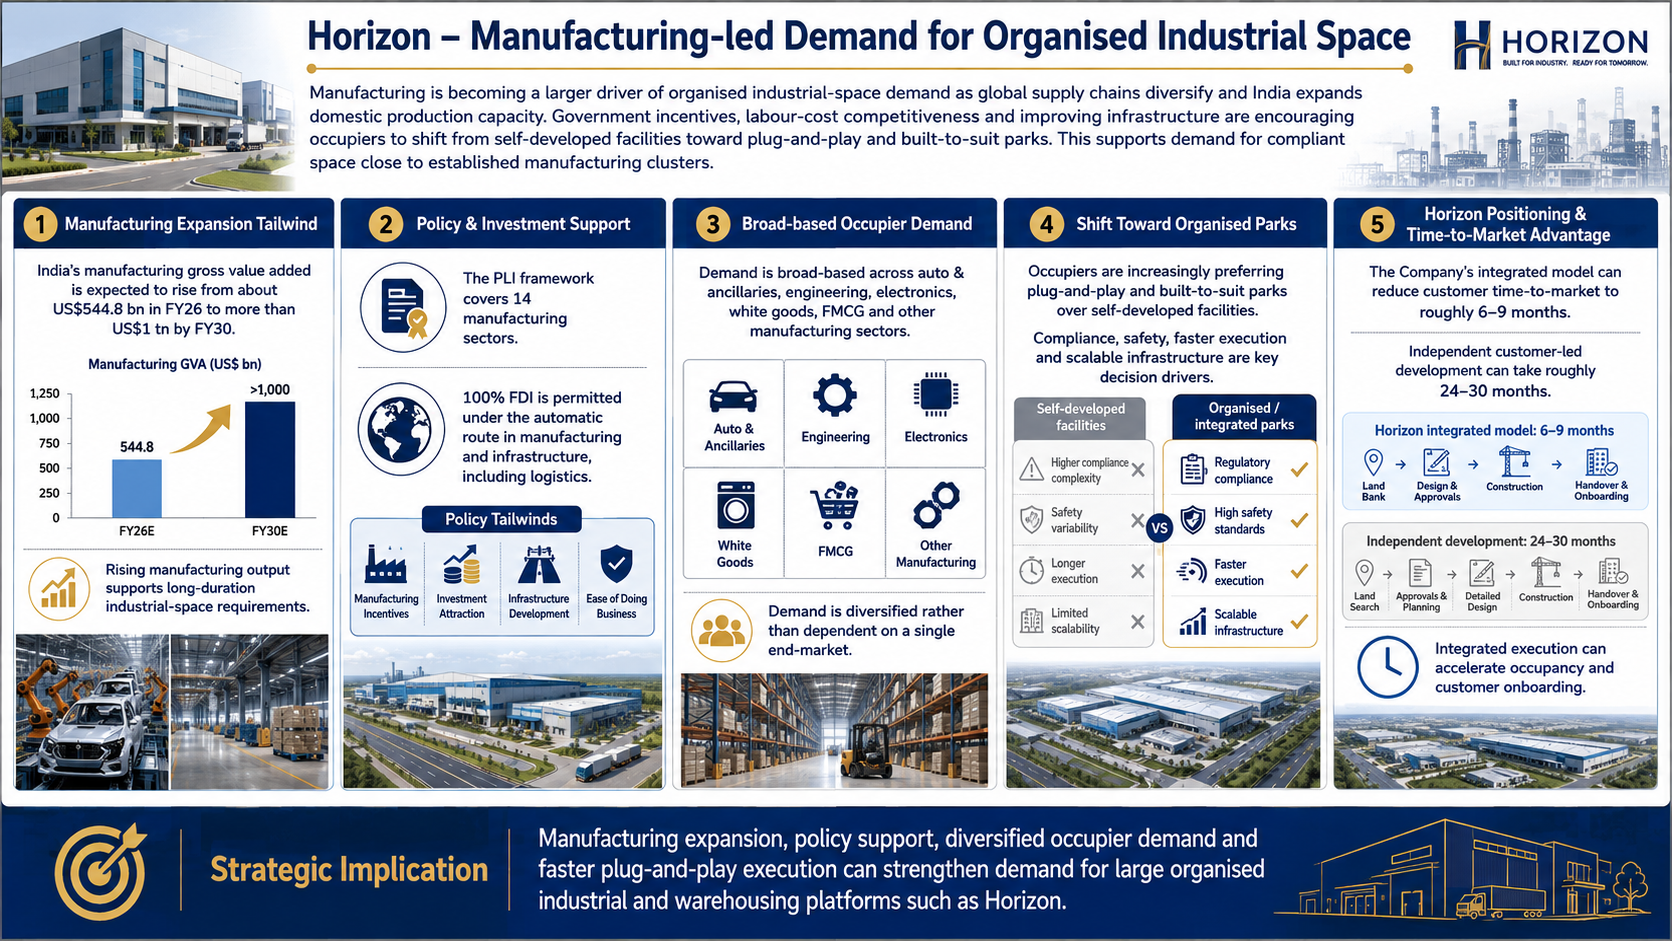
Manufacturing is becoming a larger driver of organised industrial-space demand as global supply chains diversify and India expands domestic production capacity. Government incentives, labour-cost competitiveness and improving infrastructure are encouraging occupiers to shift from self-developed facilities toward plug-and-play and built-to-suit parks. This increases demand for compliant space close to established manufacturing clusters.
The key drivers are:
JLL expects India's manufacturing gross value added to rise from about US$544.8 bn in FY26 to more than US$1 tn by FY30, supporting long-duration industrial-space requirements
The PLI framework covers 14 manufacturing sectors, while 100% FDI is permitted under the automatic route in manufacturing and infrastructure, including logistics
Demand is broad-based across auto and ancillaries, engineering, electronics, white goods, FMCG and other manufacturing sectors rather than being dependent on a single end-market
Horizon's integrated model can reduce a customer's time-to-market to roughly 6-9 months versus 24-30 months when customers independently manage land, approvals, development and vendors.
Infrastructure Build-out, Institutional Capital and Embedded Network Growth
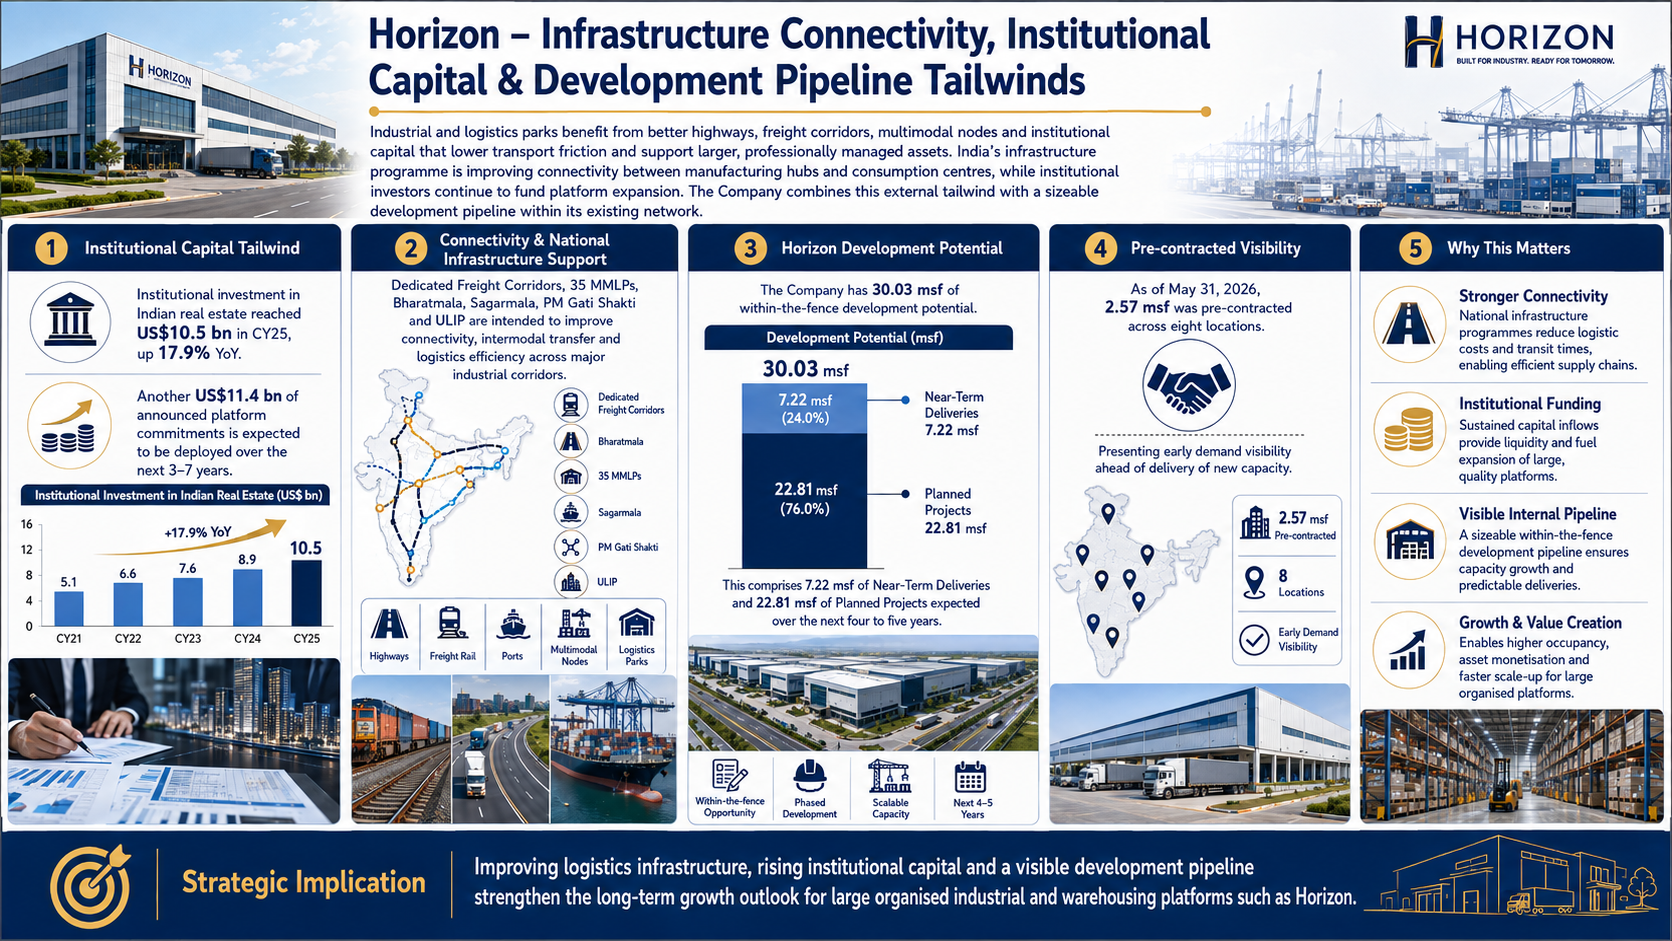
Industrial and logistics parks benefit from better highways, freight corridors, multimodal nodes and institutional capital that lower transport friction and support larger, professionally managed assets. India's infrastructure programme is improving connectivity between manufacturing hubs and consumption centres, while institutional investors continue to fund platform expansion. Horizon combines this external tailwind with a sizeable development pipeline within its existing network.
The key details are:
Institutional investment in Indian real estate reached US$10.5 bn in CY25, up 17.9% YoY, with another US$11.4 bn of announced platform commitments expected to be deployed over the next 3-7 years
Dedicated Freight Corridors, 35 MMLPs, Bharatmala, Sagarmala, PM Gati Shakti and ULIP are intended to improve connectivity, intermodal transfer and logistics efficiency across major industrial corridors
Horizon has 30.03 msf of within-the-fence development potential, comprising 7.22 msf of Near-Term Deliveries and 22.81 msf of Planned Projects expected over the next four to five years
As of May 31, 2026, 2.57 msf was pre-contracted across eight locations, providing partial demand visibility before delivery of new capacity.
Risks in the Industry
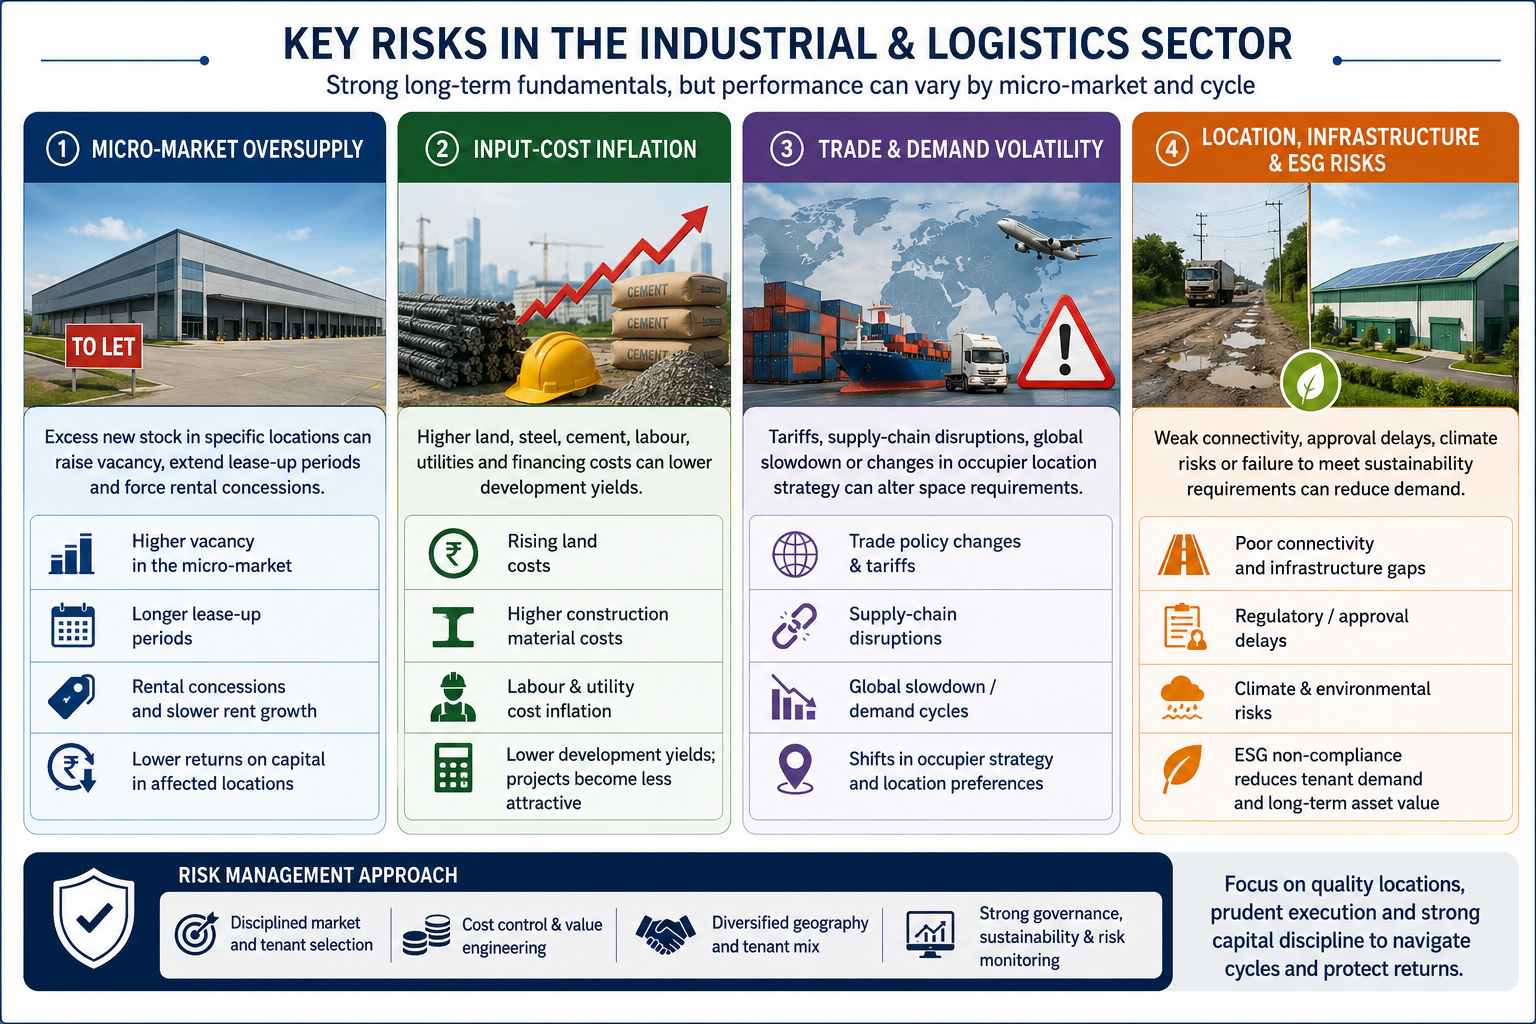
The industrial and logistics sector remains sensitive to local supply-demand conditions, tenant capex cycles and the cost of land and construction. Even when national demand is healthy, oversupply in an individual micro-market can increase vacancies and constrain rent growth. Sector returns also depend on connectivity, regulatory execution and the ability of occupiers to sustain expansion through economic and trade cycles.
The key risks are:
Micro-market oversupply: Excess new stock in specific locations can raise vacancy, extend lease-up periods and force rental concessions despite healthy national warehousing demand
Input-cost inflation: Higher land, steel, cement, labour, utilities and financing costs can lower development yields and make new projects less economically attractive.
Trade and demand volatility: Tariffs, supply-chain disruptions, global slowdown or changes in occupier location strategy can alter industrial and distribution requirements across regions
Location, infrastructure and ESG: Weak connectivity, approval delays, climate risks or failure to meet sustainability requirements can reduce tenant demand and long-term asset value
Government Policy Support
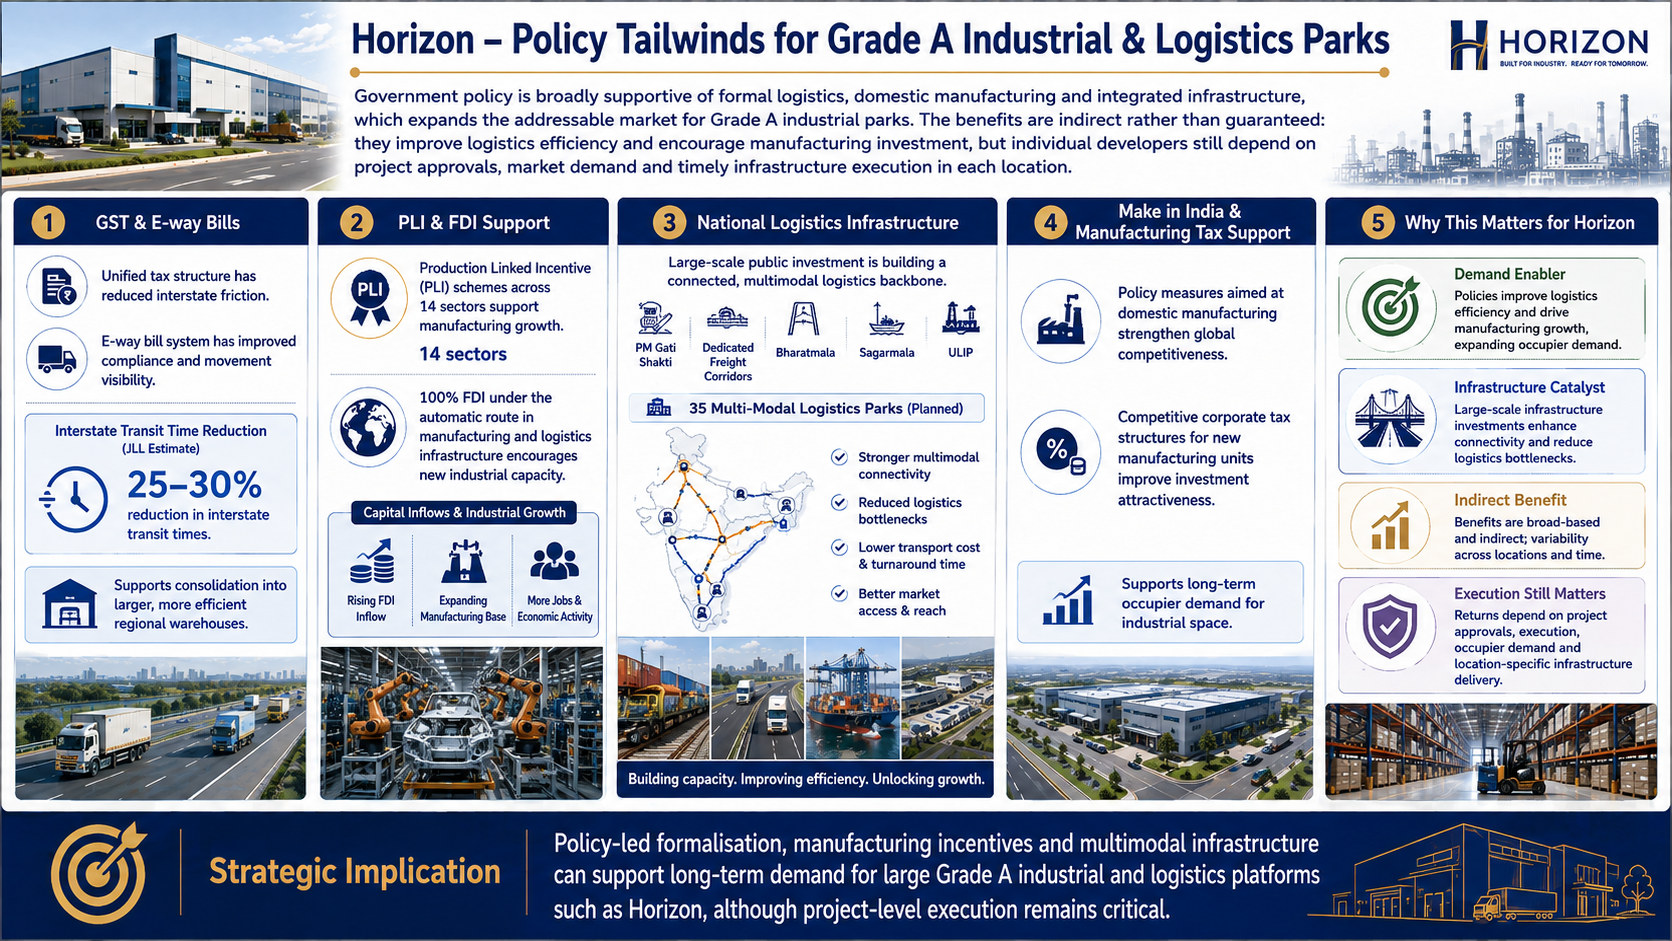
Government policy is broadly supportive of formal logistics, domestic manufacturing and integrated infrastructure, which expands the addressable market for Grade A industrial parks. The benefits are indirect rather than guaranteed: they improve logistics efficiency and encourage manufacturing investment, but individual developers still depend on project approvals, market demand and timely infrastructure execution in each location.
The key policies are:
GST and e-way bills: A unified tax structure has reduced interstate friction; the JLL report cites a 25-30% reduction in interstate transit times, supporting consolidation into larger regional warehouses
PLI and FDI: Production Linked Incentive schemes across 14 sectors and 100% FDI under the automatic route in manufacturing and logistics infrastructure encourage new industrial capacity
National logistics infrastructure: PM Gati Shakti, Dedicated Freight Corridors, Bharatmala, Sagarmala, ULIP and the planned 35 MMLPs strengthen multimodal connectivity and reduce logistics bottlenecks
Make in India and manufacturing tax support: Policy measures aimed at domestic manufacturing, together with competitive corporate-tax structures for new manufacturing units, support long-term occupier demand for industrial space.
Fundraise/Future Plans
Shareholding
Pre-issue shareholding
Promoter Holding 0.0%
Post-Issue Shareholding
Promoter Holding 0.0%
Category
Pre-Issue%Post-Issue%
Promoters
BREP Asia III India Holding Co III Pte. Ltd.
33.7%28.6%
BREP Asia II EIP Holding (NQ) Pte. Ltd.
33.4%28.4%
BREP Asia II Indian Holding Co VI (NQ) Pte. Ltd.
21.6%18.3%
Total Promoter Holding
88.7%75.3%
Additional Shareholders
0.0%0.0%
Total Additional Holding
0.0%0.0%
Total Shareholding
88.7%75.3%
- Overview
- Business
- Financial Highlights
- Industry Overview
- Fundraise/Future Plans
- Documentation
Get the Preqt App and keep in touch around the clock!
 Monitor your investments in real-time.
- Receive tailored deal suggestions.
- Get real-time updates and alerts.
