


Hy-Tech Engineers
Engineering Fluid PowerBuilt for Pressure
IPO Summary (PrEqT)
Hy-Tech Engineers Limited is a precision-engineering manufacturer focused on hydraulic fittings, with more than four decades of operating history, an integrated manufacturing footprint and more than 11,000 SKUs. The Company serves OEM and industrial customers through direct and distributor-led channels across India and eleven international markets. FY26 revenue from operations was INR 189.4 Cr, EBITDA was INR 41.7 Cr at a 22.0% margin, and PAT was INR 22.6 Cr. From FY24 to FY26, revenue, EBITDA and PAT grew at approximately 17.3%, 36.0% and 39.6% CAGR, respectively. At the cap price of INR 53.0, the post-issue market capitalisation is approximately INR 502.7 Cr and the FY26 diluted P/E is approximately 19.6x. The issue combines a fresh capital raise of approximately INR 60.0 Cr with an OFS of approximately INR 75.7 Cr. Key positives are a 95.1% repeat-customer revenue share, a 29.4% export mix, backward-integrated forging and improving return metrics. Key monitorables are customer concentration, cyclicality in construction/farming/automotive demand, raw-material price volatility and execution of the planned capacity expansion.
IPO Review Rating
Above Avg
MainboardDriving Industrial Efficiency Through Precision Hydraulic Engineering Solutions
Hy-Tech is a profitable and cash-generative precision-engineering business with a materially improved financial profile over FY24–FY26. Its strongest characteristics are the combination of INR 189.4 Cr FY26 revenue, INR 41.7 Cr EBITDA, INR 22.6 Cr PAT, 22.0% EBITDA margin, 20.2% ROE, 24.4% ROCE and only 0.2x D/E. This indicates that recent growth has not come at the cost of either profitability or balance-sheet quality. The principal weaknesses are external rather than financial: a fragmented hydraulic-fittings industry, a relatively limited BRLM track record and some governance-monitoring points around related parties and promoter-linked matters.
PARAMETER
WEIGHT
SCORE
KEY FACTORS
Financial Performance
40.0%
4.0/5
Hy-Tech has a good-quality financial profile, rather than a hyper-growth one. Revenue grew by 17.3%, but profitability, leverage, returns and cash conversion are strong. The decline in D/E from approximately 0.5x in FY24 to 0.2x in FY26 is particularly positive.
Show more
Detailed Analysis
Revenue increased from INR 137.7 Cr in FY24 to INR 161.4 Cr in FY25 and INR 189.4 Cr in FY26, representing a FY24–FY26 CAGR of approximately 17.3%
EBITDA increased from INR 22.6 Cr in FY24 to INR 35.8 Cr in FY25 and INR 41.7 Cr in FY26, while EBITDA margin expanded from 16.4% to 22.0%
PAT nearly doubled from INR 11.6 Cr in FY24 to INR 19.6 Cr in FY25 and INR 22.6 Cr in FY26, with FY26 PAT margin of 11.7%
Debt-to-equity improved from approximately 0.5x in FY24 to 0.4x in FY25 and 0.2x in FY26, supported by earnings growth and lower borrowings
ROE improved from 15.1% in FY24 to 21.4% in FY25 and remained healthy at 20.2% in FY26, despite expansion in the equity base
Operating cash flow remained positive at INR 17.0 Cr in FY25 and increased sharply to INR 30.3 Cr in FY26, exceeding FY26 PAT of INR 22.6 Cr
The largest customer contributed only 9.3% of FY26 revenue, although the Top 10 customers together accounted for approximately 45.3%
Industry
15.0%
3.0/5
Hy-Tech operates in an industry with double-digit structural growth and diversified end-market exposure, but competitive intensity remains high because of the fragmented supplier base and relatively low switching barriers in standardised products.
Show more
Detailed Analysis
India's hydraulic-fittings market is projected to expand at approximately 10.4% CAGR from CY24 to CY30, supported by construction equipment, industrial machinery, agriculture, railways and material handling
Demand is expanding alongside infrastructure creation, industrial automation, farm mechanisation and growth in construction and manufacturing equipment
Generic hydraulic fittings face limited regulatory complexity, but railway and defence supplies require certifications such as IRIS and DRDO approvals
Management
15.0%
4.0/5
Governance is reasonably strong for a promoter-led manufacturing Company. The business benefits from more than four decades of promoter operating experience, 50.0% Board independence and no promoter pledge.
Show more
Detailed Analysis
Chairman and Managing Director Hemant Mondkar has been associated with the business since 1979, giving him more than 40 years of experience in hydraulic fittings and precision engineering
The Board comprises 8 Directors, of whom 4 are Independent Directors, resulting in exactly 50.0% independent representation
Two labour-related complaints involving the promoter and a GST matter of approximately INR 1.3 Cr are pending, along with certain historical corporate-record deficiencies
FY26 operating RPTs were approximately INR 8.8 Cr, equivalent to around 4.65% of revenue, largely involving the Company's overseas distribution relationship with Hy-Tech USA
Valuation
20.0%
4.0/5
Valuation is the strongest part of Hy-Tech's scoring. At INR 53.0, the IPO is priced at 19.6x FY26 P/E and approximately 12.7x EV/EBITDA, while the Company generates 20.2% RoNW and 24.4% ROCE. P/B at 3.6x is less compelling in isolation.
Show more
Detailed Analysis
Hy-Tech trades at approximately 19.6x FY26 earnings at INR 53.0, compared with the disclosed peer average of approximately 135.6x
Hy-Tech's estimated EV/EBITDA is approximately 12.7x, versus an indicative peer average of around 38.3x, implying a peer/Hy-Tech ratio of approximately 3.0x
The cap price of INR 53.0 represents approximately 3.6x FY26 NAV of INR 14.6 per share
Approximately 44.2% of offered shares are Fresh Issue, while around 55.8% are OFS
Merchant Banker Track Record
10.0%
3.0/5
New Berry's available public-issue track record is limited, and the representative deal showed only 4.2% listing gains and 1.1x subscription. The 100.0% success statistic is based on only one transaction and should therefore carry very low analytical weight.
Show more
Detailed Analysis
The available recent public-issue track record shows only a modest listing gain: Tejas Cargo India listed at INR 175.0 versus its INR 168.0 issue price, representing a listing premium of approximately 4.2%
Tejas Cargo India was subscribed only approximately 1.1x
New Berry Capitals' disclosed recent transaction history is materially thinner than established institutional mainboard merchant bankers
TOTAL
100%
3.8/5
Weighted Composite Score
Issue Price
₹50.0 to ₹53.0
As of 29 Aug 2026
GMP
₹30.0
As of 29 Aug 2026
Estimated Gain / Loss
+56.6%
Lot Size
283.0 Shares
Grey Market Premium (GMPs) are shared for knowledge purpose only. PrEqt doesn’t promote or execute the trades.
| Issue size | |
|---|---|
| Overall | ₹136.0 Cr |
| Fresh Issue | ₹60.0 Cr |
| Offer for Sale | ₹76.0 Cr |
Minimum Investment
₹14,999.0 / 80,089 shares

Merchant Banker
New Berry Capitals Pvt.Ltd.
IPO Document
RHP / Anchor Document
Offer Start Date
24th Aug 2026
Offer End Date
27th Aug 2026
Valuation
₹502.7 Cr
Revenue (FY'26)
₹193.4 Cr
PAT (FY'26)
₹22.6 Cr
Issue Size
₹136.0 Cr
Face Value
₹ 5.0Offer Price
₹ 53.0Lot Size
283.0 sharesSale Type
Fresh capital cum OFSPAT (FY'26)
₹ 22.6 CrPAT Margin (FY'26)
11.7 %P/E Multiple
19.6xEBITDA (FY'26)
₹ 41.7 CrCAGR Growth 2Y
17.1 %ROE (FY'26)
20.2 %ROCE (FY'26)
24.4 %Price to Book Value
4.1xDebt/Equity
0.2xCompany Website
www.hy-techengineers.comExplore new deals
Overview
Fund Allocation
Total: ₹0 CrSource:Company DRHP
Timeline
IPO Open Date
To Be Announced
IPO Close Date
To Be Announced
Tentative Allotment
To Be Announced
Initiation of Refunds
To Be Announced
Credit of Shares to Demat
To Be Announced
Tentative Listing Date
To Be Announced
Business
Business Model
Geographical Presence
Sales Channel
Key Risk Factor
Financial Highlights
Income Statement
Revenue growth with EBITDA and PAT margins
| Financial Metric | FY 2024 | FY 2025 | FY 2026 |
|---|---|---|---|
| Revenue (₹ Cr) | 141.2 | 166.7 | 193.4 |
| Growth (%) | - | 17.2% | 17.4% |
| EBITDA (₹ Cr) | 22.6 | 35.8 | 41.7 |
| EBITDA Margin (%) | 16.4% | 22.2% | 22.0% |
| PAT (₹ Cr) | 11.6 | 19.6 | 22.6 |
| PAT Margin (%) | 8.2% | 11.8% | 11.7% |
OBSERVATIONS & INSIGHTS
Revenue grew 17.4% in FY'26 due higher domestic and export product sales, new customer additions and improved capacity utilisation
EBITDA grew 16.5% in FY'26; scale-up and operating leverage, partly offset by higher job work, energy and plant overheads
PAT grew 16.5%; scale-up and operating leverage, partly offset by higher job work, energy and plant overheads
Balance Sheet
| Financial Metric | FY 2024 | FY 2025 | FY 2026 |
|---|---|---|---|
| Net Worth | ₹ 82.2 Cr | ₹ 101.3 Cr | ₹ 122.0 Cr |
| Total Assets | ₹ 146.2 Cr | ₹ 170.7 Cr | ₹ 175.7 Cr |
| Total Borrowing | ₹ 40.8 Cr | ₹ 43.5 Cr | ₹ 29.8 Cr |
| Reserves & Surplus | ₹ 81.8 Cr | ₹ 59.5 Cr | ₹ 80.3 Cr |
OBSERVATIONS & INSIGHTS
Reserves & Surplus / Other Equity fell from INR 81.8 Cr in FY24 to INR 59.5 Cr in FY25 because INR 41.4 Cr of reserves were capitalised through a bonus issue; it then rebuilt to INR 80.3 Cr in FY26 as INR 22.6 Cr PAT and remeasurement gains exceeded the INR 2.1 Cr dividend
Total Equity increased from INR 82.2 Cr to INR 122.0 Cr over FY24-FY26. The FY25 bonus issue reclassified reserves into share capital without reducing total equity, while retained profits drove the underlying increase in net worth
Total Borrowings moved from INR 40.8 Cr in FY24 to INR 43.5 Cr in FY25 as capex was partly debt-funded, then declined to INR 29.8 Cr in FY26 after repayment of INR 7.4 Cr long-term debt and INR 7.9 Cr net short-term borrowings
Total Assets rose to INR 175.7 Cr in FY26 as the Company expanded manufacturing capacity and working-capital assets; the slower FY26 asset growth versus PAT growth is consistent with the improvement in ROA and ROCE
Cash Flow
| Financial Metric | FY 2023 | FY 2024 | FY 2025 |
|---|---|---|---|
CFI (₹ Cr) Cash used for investments and long-term assets. | -35.5 Cr | -13.4 Cr | -7.2 Cr |
CFF (₹ Cr) Cash flow related to funding and borrowings. | +16.6 Cr | -3.5 Cr | -21.3 Cr |
CFO (₹ Cr) Cash generated from core business operations. | +18.7 Cr | +17.0 Cr | +30.3 Cr |
Working Capital
| Efficiency Metric | FY 2023 | FY 2024 | FY 2025 |
|---|---|---|---|
Debtor Days Average number of days taken to collect customer payments. | - | - | - |
Creditor Days Average time taken to pay suppliers and vendors. | - | - | - |
Inventory Days Average number of days inventory remains unsold. | - | - | - |
CCC (Cash Conversion Cycle) (Debtor Days + Inventory Days - Creditor Days) | - | - | - |
Financial Ratios
Measures the company’s leverage relative to shareholder equity.
OBSERVATIONS & INSIGHTS
ROE increased sharply in FY25 because PAT rose 69.2% while average equity grew more slowly; it eased to 20.2% in FY26 because the equity base continued to accumulate retained earnings while PAT growth moderated to 15.2%
Debt / Equity improved from 0.5x to 0.2x as total equity increased through retained profits while borrowings fell materially in FY26 after long-term and short-term repayments
Interest Coverage remained around 5.3x through FY24-FY25 and improved to 6.9x in FY26 because EBIT expanded while finance costs fell from INR 4.8 Cr to INR 4.5 Cr after debt reduction
Current Ratio: strengthened from 1.7x to 2.9x as current assets expanded with the business while FY26 current liabilities fell, primarily because current borrowings and trade payables declined
ROA rose from 7.9% to 13.0% as PAT growth materially outpaced total-asset growth
ROCE improved each year to 24.4% because EBIT scaled faster than the capital employed base and utilisation of the manufacturing asset base improved
Industry Overview
Industry Drivers
Broad industrial and infrastructure tailwind
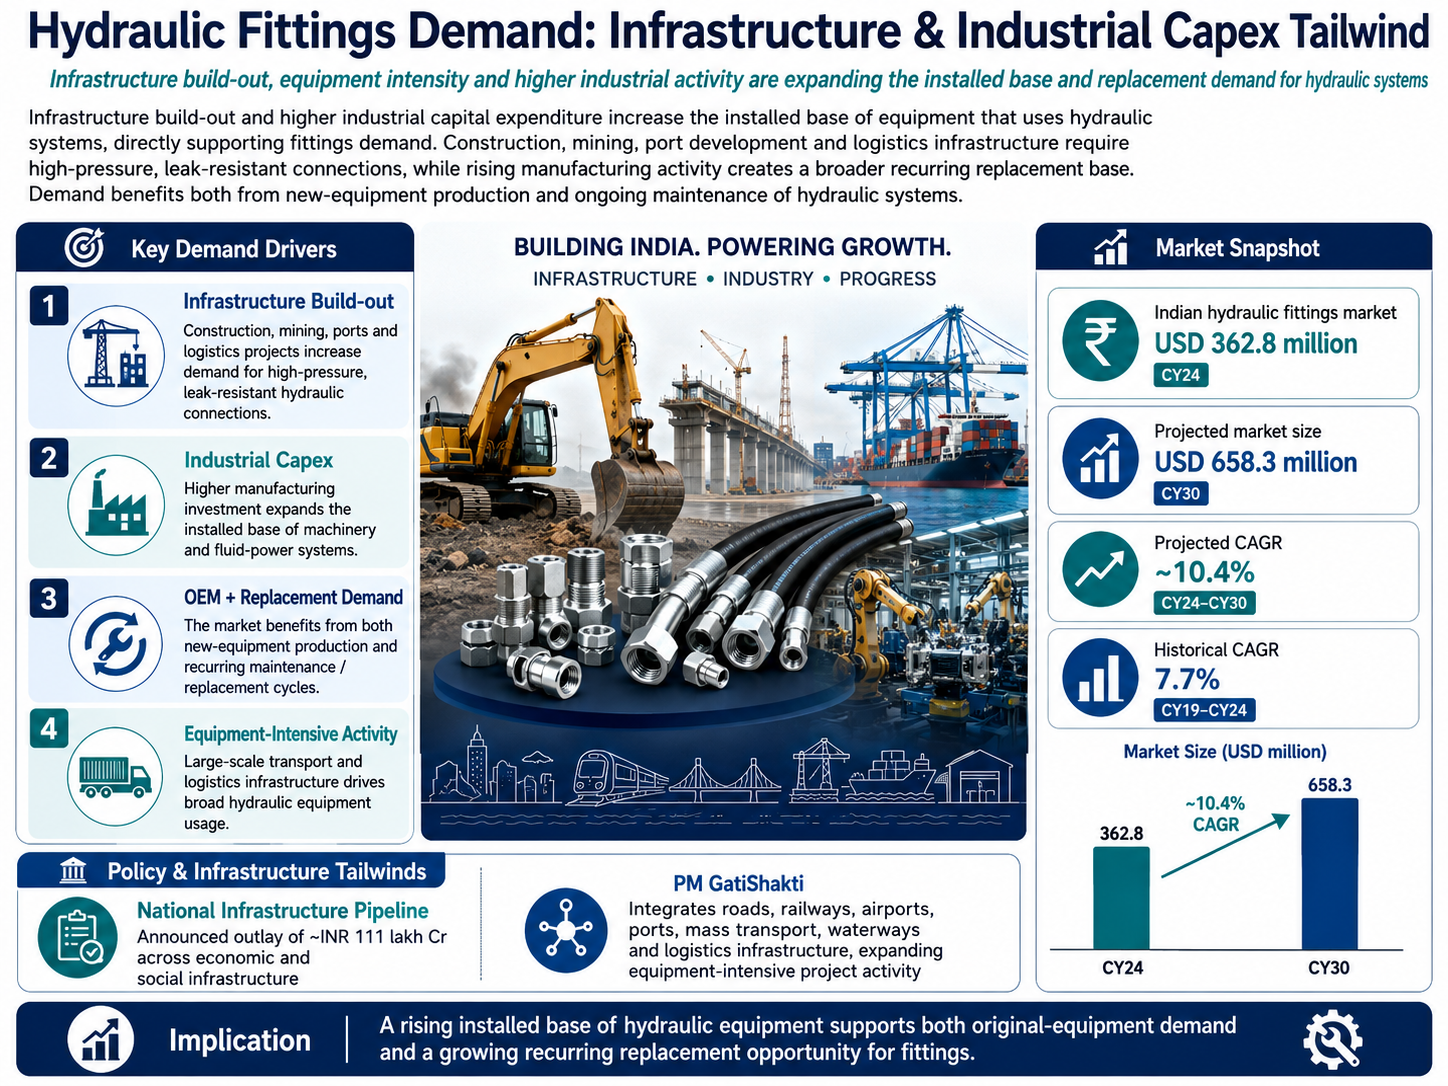
Infrastructure build-out and higher industrial capital expenditure increase the installed base of equipment that uses hydraulic systems, directly supporting fittings demand. Construction, mining, port development and logistics infrastructure require high-pressure, leak-resistant connections, while rising manufacturing activity creates a broader recurring replacement base. The demand pool therefore benefits both from new-equipment production and ongoing maintenance of hydraulic systems.
The key drivers are:
Indian hydraulic fittings market is approximately USD 362.8 million in CY24; projected to reach approximately USD 658.3 million by CY30
Projected market CAGR is approximately 10.4% during CY24-CY30 versus 7.7% during CY19-CY24
National Infrastructure Pipeline has an announced outlay of approximately INR 111 lakh Cr across economic and social infrastructure
PM GatiShakti integrates roads, railways, airports, ports, mass transport, waterways and logistics infrastructure, expanding equipment-intensive project activity
Mechanisation, automation and high-pressure applications
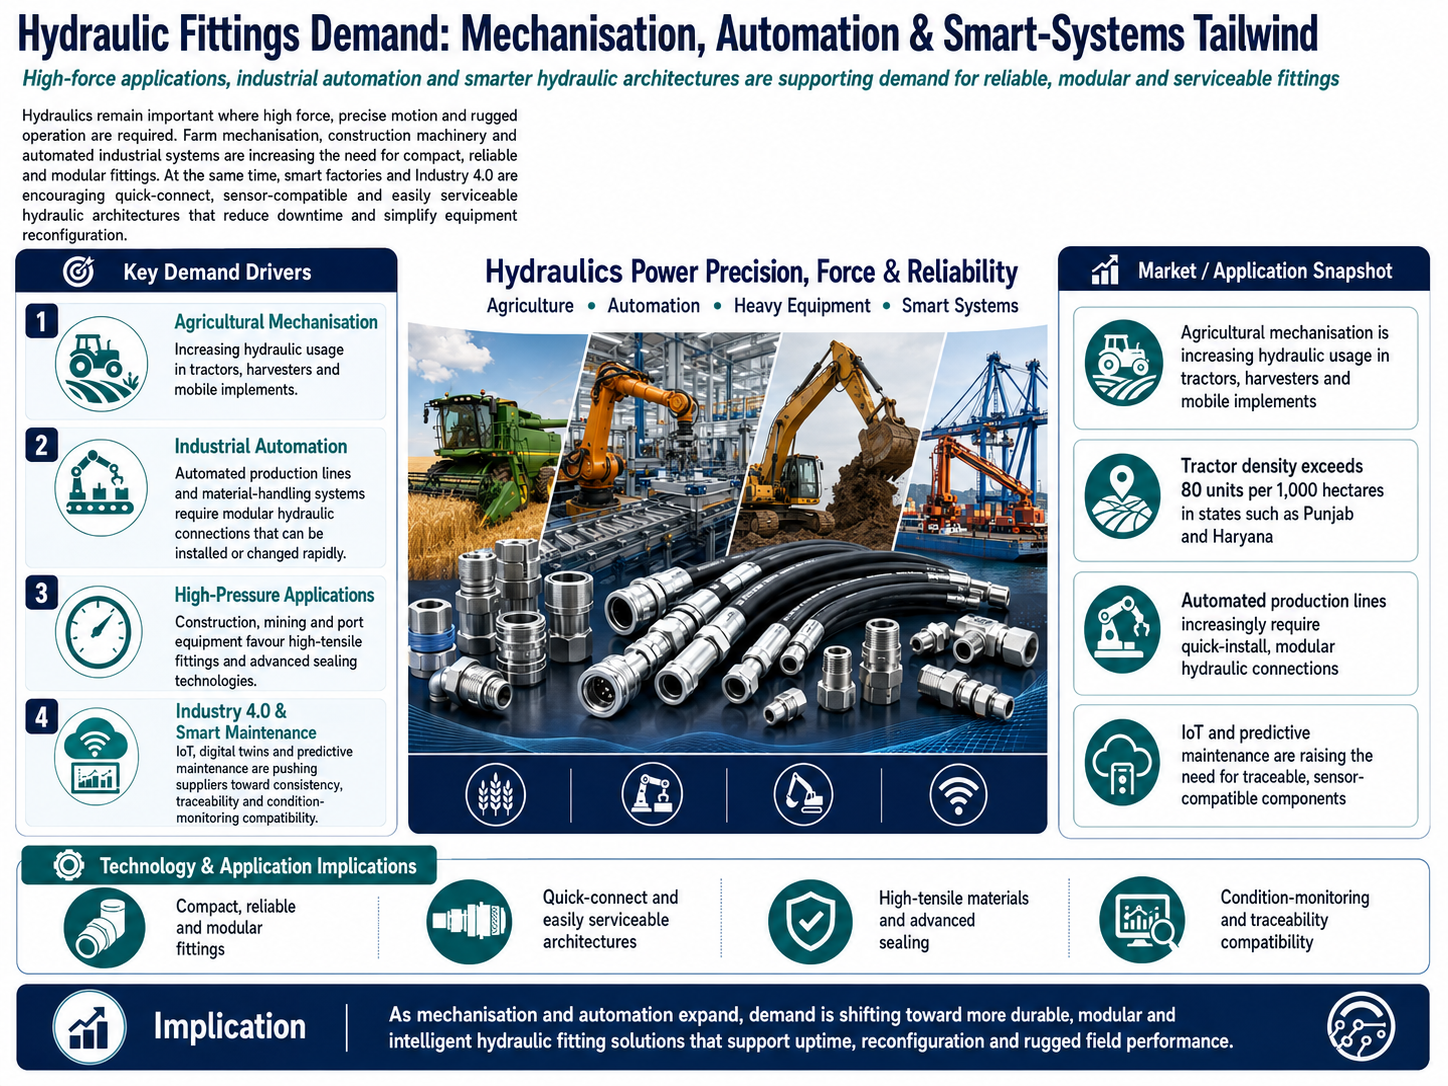
Hydraulics remain important where high force, precise motion and rugged operation are required. Farm mechanisation, construction machinery and automated industrial systems are increasing the need for compact, reliable and modular fittings. At the same time, smart factories and Industry 4.0 are encouraging quick-connect, sensor-compatible and easily serviceable hydraulic architectures that reduce downtime and simplify equipment reconfiguration.
The key details are:
Agricultural mechanisation is increasing hydraulic usage in tractors, harvesters and mobile implements; tractor density exceeds 80 units per 1,000 hectares in states such as Punjab and Haryana
Automated production lines and material-handling systems increasingly require modular hydraulic connections that can be installed or changed rapidly
High-pressure construction, mining and port applications favour high-tensile fittings and advanced sealing technologies
IoT, digital twins and predictive maintenance are pushing hydraulic-component suppliers toward higher consistency, traceability and condition-monitoring compatibility
Customisation, standards and premiumisation
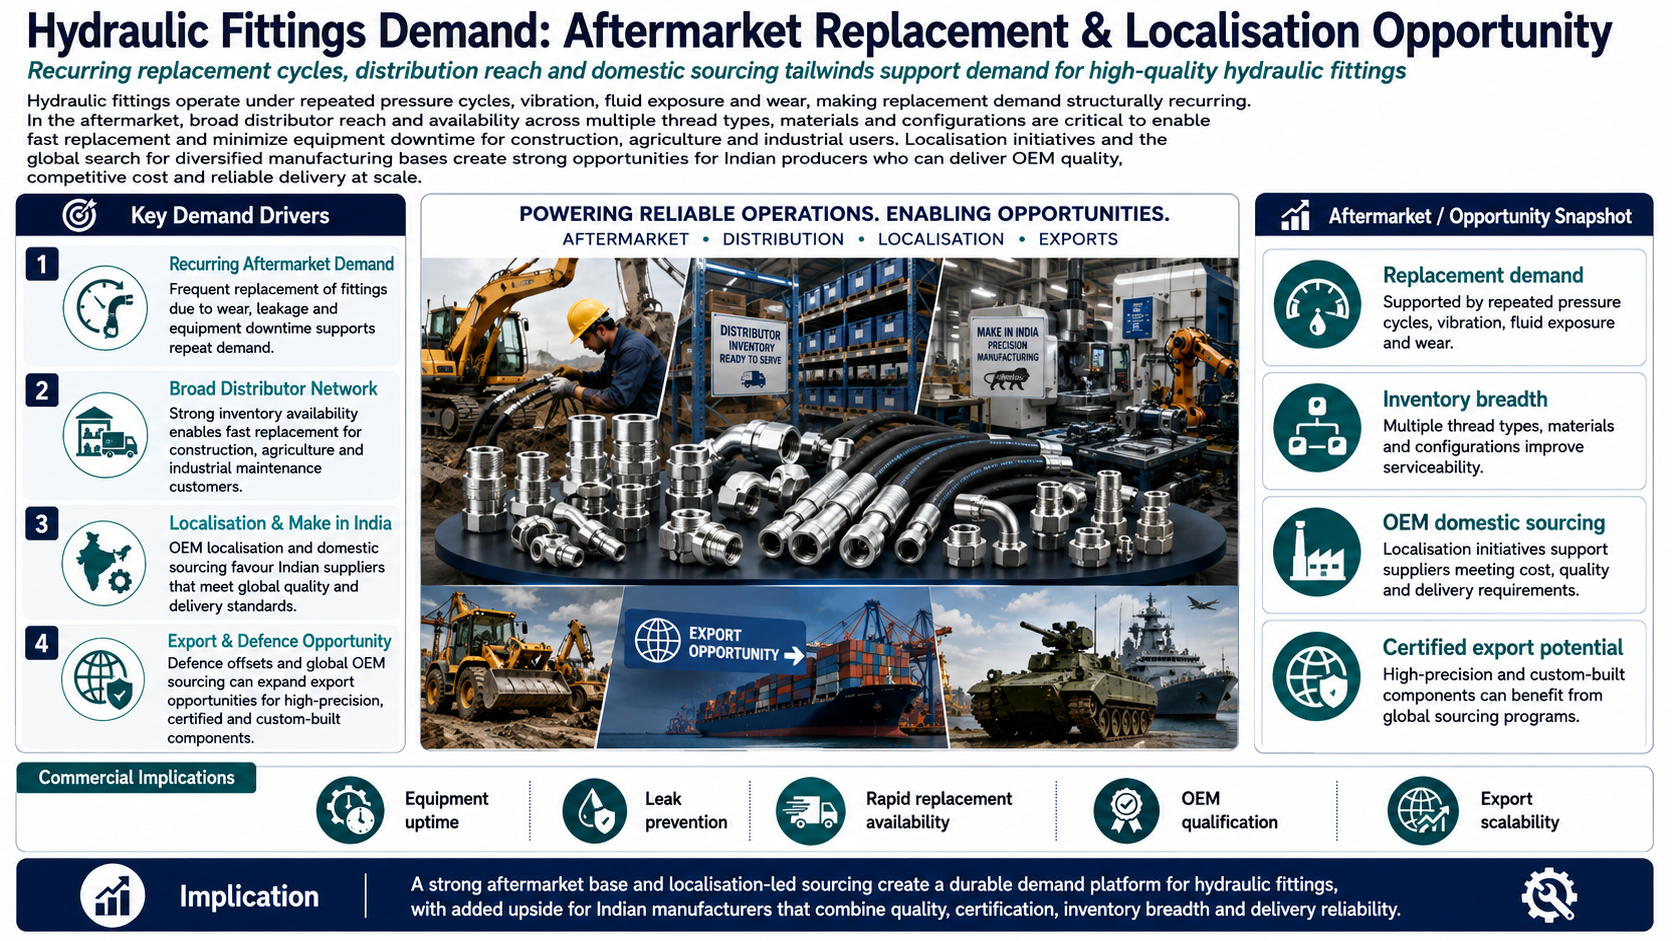
Catalogue fittings continue to dominate high-volume replacement demand, but OEM and export applications are moving toward customized products tailored to equipment geometry, pressure ratings and lifecycle requirements. This increases the value of engineering capability, qualification history and SKU breadth. Compliance with international dimensional and quality standards also raises supplier switching costs for critical applications and supports premiumisation of certified products.
The key details are:
Catalogue fittings are widely used in aftermarket, repair and small-manufacturer applications because of immediate availability and standardisation
Customized fittings are gaining share in OEM and export segments as machinery becomes more compact, performance-sensitive and application-specific
DIN, SAE, JIC, BSP and related global connection standards improve interchangeability while raising qualification requirements for export-oriented suppliers
Defence and rail applications increasingly require additional certifications and approvals such as MoD/DGQA, IRIS, RDSO-aligned specifications and, for aerospace, AS9100
Risks in the Industry
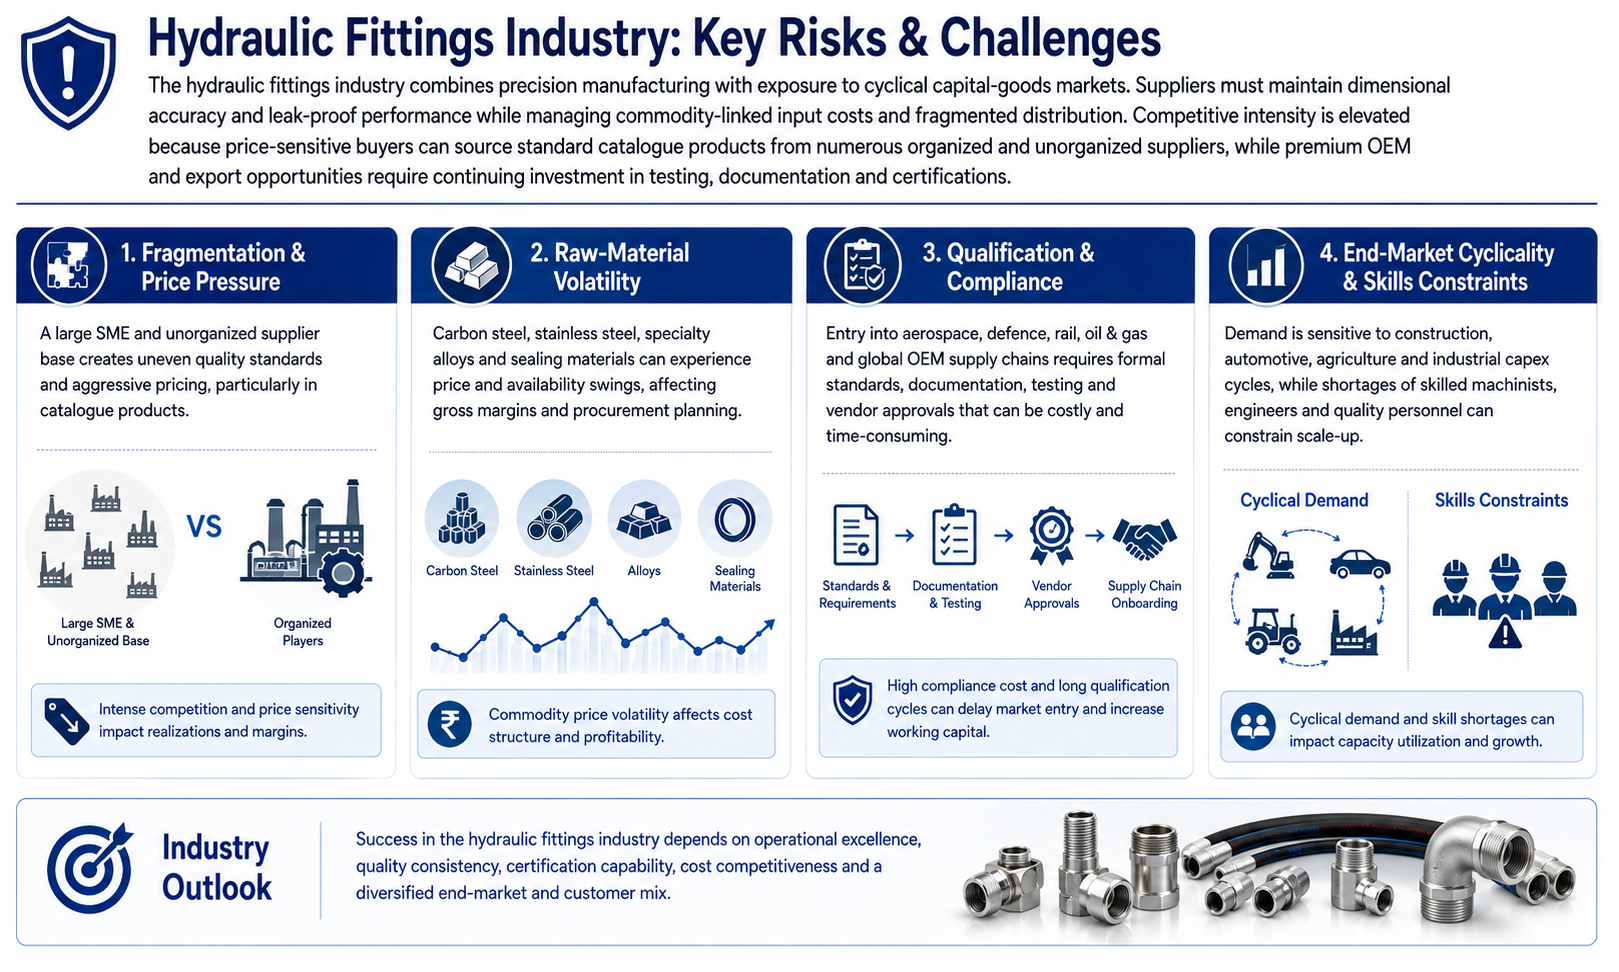
The hydraulic fittings industry combines precision manufacturing with exposure to cyclical capital-goods markets. Suppliers must maintain dimensional accuracy and leak-proof performance while managing commodity-linked input costs and fragmented distribution. Competitive intensity is elevated because price-sensitive buyers can source standard catalogue products from numerous organized and unorganized suppliers, while premium OEM and export opportunities require continuing investment in testing, documentation and certifications.
The key risks are:
Fragmentation and price pressure: A large SME and unorganized supplier base creates uneven quality standards and aggressive pricing, particularly in catalogue products
Raw-material volatility: Carbon steel, stainless steel, specialty alloys and sealing materials can experience price and availability swings, affecting gross margins and procurement planning
Qualification and compliance: Entry into aerospace, defence, rail, oil & gas and global OEM supply chains requires formal standards, documentation, testing and vendor approvals that can be costly and time-consuming
End-market cyclicality and skills: Demand is sensitive to construction, automotive, agriculture and industrial capex cycles, while shortages of skilled machinists, engineers and quality personnel can constrain scale-up
Government Policy Support
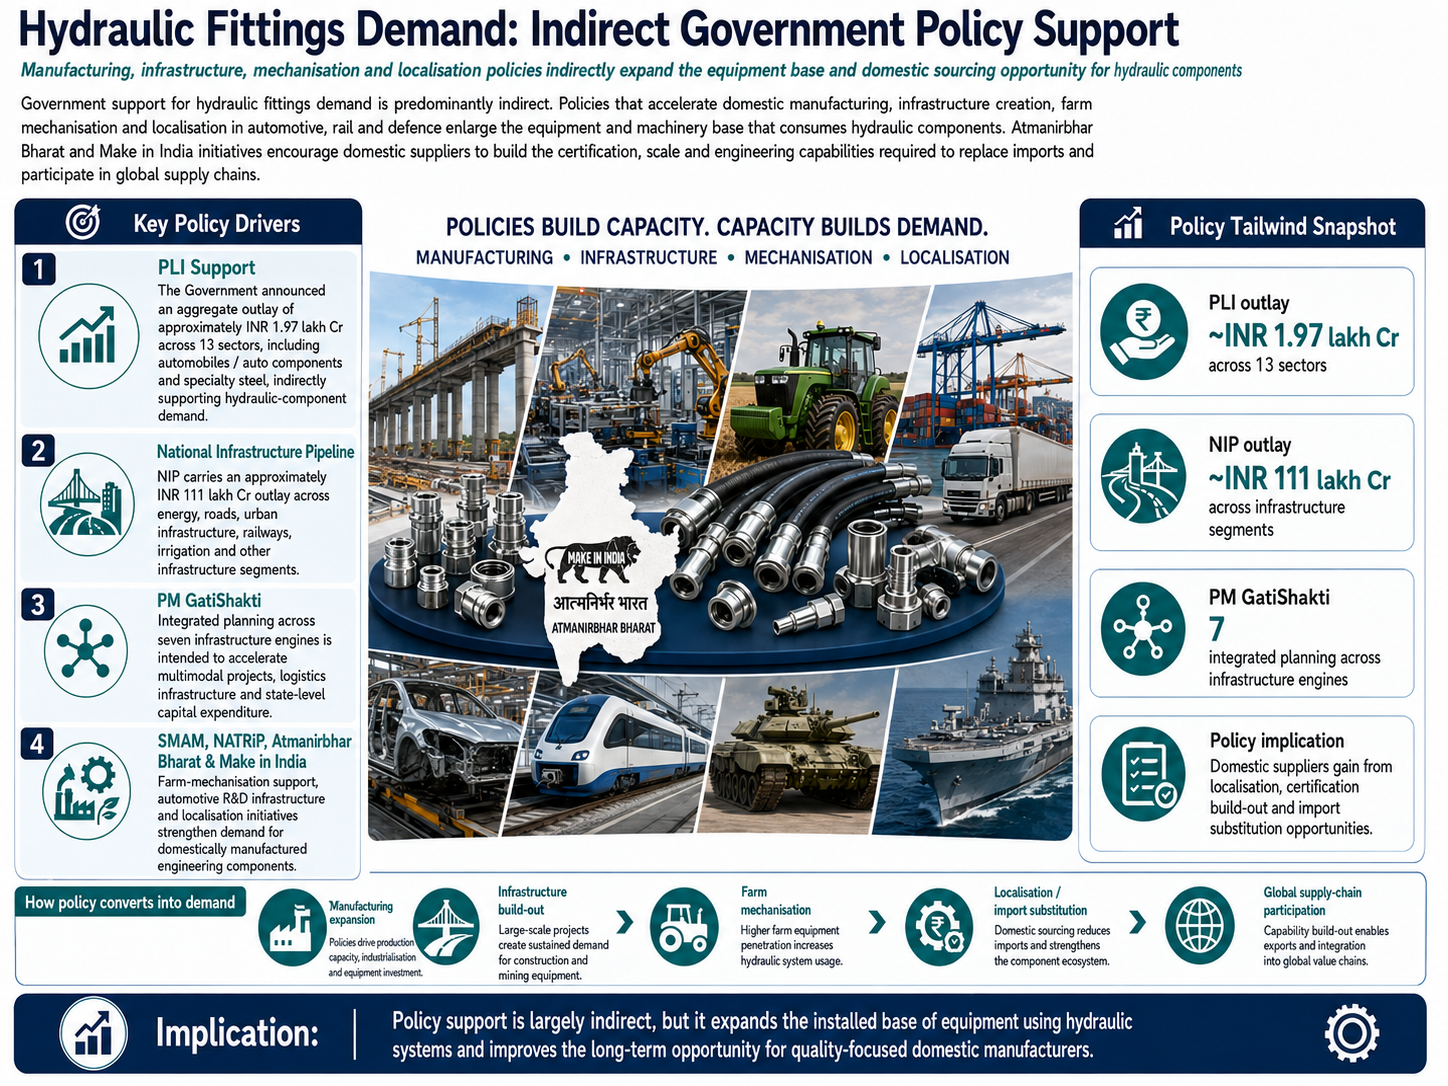
Government support is predominantly indirect: hydraulic-fitting demand benefits when policies accelerate domestic manufacturing, infrastructure creation, farm mechanisation and localisation in automotive, rail and defence. These schemes enlarge the equipment and machinery base that consumes hydraulic components, while Atmanirbhar Bharat and Make in India encourage domestic suppliers to build the certification, scale and engineering capabilities required to replace imports and participate in global supply chains.
The key policies are:
The Government announced an aggregate outlay of approximately INR 1.97 lakh Cr across 13 sectors, including automobiles/auto components and specialty steel, indirectly supporting hydraulic-component demand
The National Infrastructure Pipeline carries an approximately INR 111 lakh Cr outlay across energy, roads, urban infrastructure, railways, irrigation and other infrastructure segments
Integrated planning across seven infrastructure engines is intended to accelerate multimodal projects, logistics infrastructure and state-level capital expenditure
SMAM, NATRiP, Atmanirbhar Bharat and Make in India: farm-mechanisation support, automotive R&D; infrastructure and localisation initiatives strengthen demand for domestically manufactured engineering components
Fundraise/Future Plans
Shareholding
Pre-issue shareholding
Promoter Holding 0.0%
Post-Issue Shareholding
Promoter Holding 0.0%
Category
Pre-Issue%Post-Issue%
Promoters
Hemant Tukaram Mondkar
64.8%47.6%
Surekha Hemant Mondkar jointly with Hemant
24.8%16.3%
Ashwin Hemant Mondkar
8.3%7.3%
Total Promoter Holding
97.9%71.2%
Additional Shareholders
0.0%0.0%
Total Additional Holding
0.0%0.0%
Total Shareholding
97.9%71.2%
- Overview
- Business
- Financial Highlights
- Industry Overview
- Fundraise/Future Plans
- Documentation
Get the Preqt App and keep in touch around the clock!
 Monitor your investments in real-time.
- Receive tailored deal suggestions.
- Get real-time updates and alerts.
