

Indian Potash Ltd
Strengthening Indian AgricultureGrowing India Together
Unlisted Review Rating
Average
DRHP Not FiledStrengthening Indian Agriculture Through Reliable Inputs and Farmer Partnerships
Indian Potash Limited offers a substantial headline valuation discount, a low P/B multiple and strong consolidated profitability supported by valuable associate investments. However, core operating growth and margins are modest, the business is highly dependent on government fertiliser policy and imported inputs, and the ongoing CBI investigation remains a significant governance overhang.
PARAMETER
WEIGHT
SCORE
KEY FACTORS
Financial Performance
25.0%
3.0/5
The sharp reduction in revenue from FY23 largely reflects normalisation after an unusually high-import and high-fertiliser-price period. Profitability improved strongly in FY25, although a substantial proportion of consolidated PAT is contributed by equity-accounted associates rather than the Company’s core operating business
Show more
Detailed Analysis
Consolidated revenue from operations decreased from INR 33,323.0 Cr in FY23 to INR 20,688.9 Cr in FY25, representing a 2-year CAGR of negative 21.2%. Revenue also declined by 1.2% in FY25, from INR 20,946.4 Cr in FY24
Operating EBITDA increased to approximately INR 1,305.5 Cr in FY25, calculated using profit before associate contribution and tax of INR 737.7 Cr, finance costs of INR 499.4 Cr and depreciation of INR 68.4 Cr. The resulting operating EBITDA margin was 6.3%
Consolidated PAT increased from INR 1,257.8 Cr in FY24 to INR 1,661.4 Cr in FY25, representing growth of 32.1%. PAT margin improved from 6.0% to 8.0%
Total borrowings stood at INR 5,263.8 Cr, comprising current borrowings of INR 5,192.0 Cr and non-current borrowings of INR 71.8 Cr. Against total equity of INR 11,321.5 Cr, debt-to-equity was approximately 0.5x, based on an unrounded ratio of 0.46x
FY25 PAT of INR 1,661.4 Cr, against average FY24–FY25 equity of INR 10,418.9 Cr, generated an ROE of approximately 16.0%
Operating cash flow improved from negative INR 1,469.0 Cr in FY24 to positive INR 503.7 Cr in FY25, supported by higher trade payables and recovery of other current assets, partly offset by increases in inventories and receivables
Industry
25.0%
2.0/5
India’s fertiliser market was estimated at USD 10.8 billion in 2022 and is projected to reach USD 14.3 billion by 2028, representing a CAGR of approximately 4.9%
Show more
Detailed Analysis
India consumes more than 55.0 million tonnes of fertilisers annually, while projected growth remains below 5.0%. The conventional fertiliser industry is therefore classified as Mature
The latest reliable public company-share datapoint located indicated that IPL accounted for approximately 69.0% of Indian MOP imports in FY22. This alone implies a minimum segment HHI of 4,761.0, before including the shares of other participants
DAP represented more than 60.0% of the Company’s turnover, while profitability was materially affected by the Nutrient-Based Subsidy regime, regulated MRPs, import directions and government compensation methodology. The Company stated that DAP remained loss-making despite a special support package of INR 3,500.0 per MT
Foreign-exchange earnings stood at INR 2,190.2 Cr, equivalent to 10.6% of FY25 revenue, while foreign-exchange outgo was significantly higher at INR 19,787.9 Cr. The Company therefore remains highly exposed to imported fertiliser prices, currency movements and overseas supply availability
Management
25.0%
3.0/5
The Company benefits from highly experienced operating leadership and long-standing institutional relationships. However, governance scoring is materially affected by low independent-director representation and the continuing CBI matter, which has resulted in a qualified statutory audit opinion.
Show more
Detailed Analysis
IPL does not have a conventional founder-promoter management structure; therefore, Managing Director Dr. P. S. Gahlaut’s experience has been used as the operating-leadership proxy. He joined IPL in 1985 and became Managing Director in 1997, representing approximately 40.0 years of Company experience by FY25
The board comprised approximately 16.0 directors, of whom 3.0 were identified as independent directors, representing independent board participation of approximately 18.8%
The statutory auditor issued a qualified opinion because of an ongoing CBI investigation involving the Managing Director and one director. The related writ petition remains sub judice, and the potential financial or internal-control impact cannot presently be determined
Recurring operating related-party transactions were approximately INR 1,665.2 Cr, equivalent to 8.0% of FY25 consolidated revenue. The calculation includes recurring sales, purchases, services, discounts, management remuneration and employee-fund contributions, but excludes dividends and equity subscriptions
Valuation
25.0%
5.0/5
Indian Potash appears inexpensive on headline equity-valuation measures, with a P/E of 6.0x, a 46.3% discount to the industry P/E and a P/B of 1.0x. The low observed unlisted-share volatility also supports the valuation score
Show more
Detailed Analysis
The Company is valued at a P/E multiple of 6.0x, compared with the fertiliser-industry P/E of 11.2x, representing a discount of 46.3%
the Company is valued at approximately 11.9x EV/EBITDA, The peer median EV/EBITDA is approximately 9.8x, implying that Indian Potash trades at a premium of 21.1% to the selected peer median
The Company is valued at a P/B multiple of 1.0x, indicating that its equity is valued broadly in line with its reported book value. The multiple is substantially lower than the levels commonly observed for high-return or asset-light businesses
TOTAL
100%
3.3/5
Weighted Composite Score
Per Share Price
₹465.4
As of 24 Oct 2026
Lot Size
2.0 Shares
Minimum Investment
₹23,270.0 / 50 shares
Market Cap.
Revenue FY’25
PAT FY’25
P/E Multiple
Face Value
₹ 10.0Lot Size
2.0 sharesSale Type
PrimaryPAT FY’25
₹ 1,661.3 CrPAT Margin (%)
8.0 %P/E Multiple
6.0xCAGR Growth 3Y
3.8 %ROE (FY’25)
14.7 %ROCE (FY’25)
25.1 %Price to Book Value ratio
1.0xDebt/Equity (FY’25)
0.4xMerchant banker appointed
❌ NoCompany Website
indianpotash.orgDisclaimer: Unlisted shares are unregulated & illiquid. This is NOT investment advice. Please do your own due diligence before investing.
Minimum Investment
₹23,270.0 / 50 sharesShares Lot 2 X 25
Investment amount
₹23,270.0
Overview
Business
Business Model
Geographical Presence
Sales Channel
Financial Highlights
Income Statement
Revenue growth with EBITDA and PAT margins
| Financial Metric | FY 2023 | FY 2024 | FY 2025 |
|---|---|---|---|
| Revenue (₹ Cr) | 33,323.0 | 20,946.4 | 20,688.9 |
| Growth (%) | 80.1% | -37.1% | -1.2% |
| EBITDA (₹ Cr) | 3,451.1 | 2,657.6 | 3,254.4 |
| EBITDA Margin (%) | 10.4% | 12.7% | 15.7% |
| PAT (₹ Cr) | 1,874.4 | 1,257.8 | 1,661.3 |
| PAT Margin (%) | 5.6% | 6.0% | 8.0% |
OBSERVATIONS & INSIGHTS
Revenue normalised after FY23: Revenue declined from ₹33,323 Cr in FY23 to ₹20,946 Cr in FY24 and ₹20,689 Cr in FY25, mainly reflecting fertiliser price cycles, calibrated imports and a high FY23 base.
Profitability improved in FY25: Consolidated PAT increased from ₹1,257.83 Cr in FY24 to ₹1,661.35 Cr in FY25, supported by stronger total comprehensive income and associate contribution.
EBITDA margin expanded: Calculated EBITDA margin improved from 12.7% in FY24 to 15.7% in FY25 despite revenue decline.
Associate contribution is material: A large part of consolidated profitability is influenced by share of profit from associate / jointly controlled entity.
Balance Sheet
| Financial Metric | FY 2023 | FY 2024 | FY 2025 |
|---|---|---|---|
| EQUITY & LIABILITIES | ₹ 19,064.5 Cr | ₹ 17,621.0 Cr | ₹ 22,109.5 Cr |
| Net Worth | ₹ 8,239.8 Cr | ₹ 9,516.2 Cr | ₹ 11,321.4 Cr |
| Share Capital | ₹ 28.6 Cr | ₹ 28.6 Cr | ₹ 28.6 Cr |
| Reserves & Surplus | ₹ 8,211.2 Cr | ₹ 9,487.6 Cr | ₹ 11,292.8 Cr |
| Total Liabilities | ₹ 10,824.7 Cr | ₹ 8,104.8 Cr | ₹ 10,788.1 Cr |
| Current Liabilities | ₹ 9,802.6 Cr | ₹ 6,867.7 Cr | ₹ 9,392.8 Cr |
| Borrowings | ₹ 3,839.1 Cr | ₹ 4,449.6 Cr | ₹ 5,191.9 Cr |
| Trade Payables | ₹ 5,364.0 Cr | ₹ 2,051.8 Cr | ₹ 3,747.1 Cr |
| Other Current Liabilities | ₹ 599.5 Cr | ₹ 366.3 Cr | ₹ 453.8 Cr |
| Non-Current Liabilities | ₹ 1,022.1 Cr | ₹ 1,237.1 Cr | ₹ 1,395.3 Cr |
| Borrowings | ₹ 124.6 Cr | ₹ 124.9 Cr | ₹ 71.8 Cr |
| Other Non-Current Liabilities | ₹ 897.5 Cr | ₹ 1,112.2 Cr | ₹ 1,323.5 Cr |
| ASSETS | ₹ 14,635.5 Cr | ₹ 12,505.8 Cr | ₹ 16,349.4 Cr |
| Current Assets | ₹ 12,784.9 Cr | ₹ 10,243.9 Cr | ₹ 11,237.1 Cr |
| Trade Receivables | ₹ 5,454.3 Cr | ₹ 3,669.7 Cr | ₹ 4,507.1 Cr |
| Inventory | ₹ 4,012.8 Cr | ₹ 3,791.7 Cr | ₹ 4,689.8 Cr |
| Cash & Cash Equivalents | ₹ 1,400.7 Cr | ₹ 613.6 Cr | ₹ 421.0 Cr |
| Other Current Assets | ₹ 1,917.1 Cr | ₹ 2,168.9 Cr | ₹ 1,619.2 Cr |
| Non-Current Assets | ₹ 1,850.6 Cr | ₹ 2,261.9 Cr | ₹ 5,112.3 Cr |
| Fixed Assets | ₹ 1,332.9 Cr | ₹ 1,321.1 Cr | ₹ 2,065.7 Cr |
| Other Non-Current Assets | ₹ 517.7 Cr | ₹ 940.8 Cr | ₹ 3,046.6 Cr |
OBSERVATIONS & INSIGHTS
Strong net worth growth: Net worth increased from ₹8,239.80 Cr in FY23 to ₹11,321.49 Cr in FY25.
Asset base expanded: Total assets increased from ₹19,064.74 Cr in FY23 to ₹22,109.85 Cr in FY25, after a decline in FY24, indicating recovery in scale and asset deployment.
Working-capital heavy balance sheet: Trade receivables and inventory together stood at ₹9,196.95 Cr in FY25, making working capital a key monitorable.
Short-term borrowing-led funding: Current borrowings increased from ₹3,839.16 Cr in FY23 to ₹5,191.99 Cr in FY25, while non-current borrowings declined to ₹71.80 Cr, showing funding is mainly working-capital led.
Trade payables rebounded: Trade payables increased from ₹2,051.87 Cr in FY24 to ₹3,747.12 Cr in FY25, providing supplier-credit support but indicating dependence on trade-credit cycle.
Investments / associates are material: Investments accounted using equity method increased from ₹4,428.88 Cr in FY23 to ₹5,760.31 Cr in FY25 and remain a major component of the consolidated balance sheet.
Cash balance declined: Cash & bank balance declined from ₹1,400.71 Cr in FY23 to ₹421.06 Cr in FY25, despite improved FY25 operating cash flow.
Capital structure remains moderate: Debt/equity stayed broadly stable at around 0.46x-0.48x over FY23-FY25, indicating moderate leverage for a large working-capital-intensive fertiliser distributor.
Cash Flow
| Financial Metric | FY 2023 | FY 2024 | FY 2025 |
|---|---|---|---|
CFO (₹ Cr) Cash generated from core business operations. | -5,114.6 Cr | -1,468.9 Cr | +503.6 Cr |
CFI (₹ Cr) Cash used for investments and long-term assets. | +3,709.9 Cr | +675.6 Cr | -881.1 Cr |
CFF (₹ Cr) Cash flow related to funding and borrowings. | +2,310.2 Cr | +192.2 Cr | +131.4 Cr |
Working Capital
| Efficiency Metric | FY 2023 | FY 2024 | FY 2025 |
|---|---|---|---|
Debtor Days Average number of days taken to collect customer payments. | - | - | - |
Creditor Days Average time taken to pay suppliers and vendors. | - | - | - |
Inventory Days Average number of days inventory remains unsold. | - | - | - |
CCC (Cash Conversion Cycle) (Debtor Days + Inventory Days - Creditor Days) | - | - | - |
Financial Ratios
Measures the company’s leverage relative to shareholder equity.
OBSERVATIONS & INSIGHTS
ROCE remained healthy: ROCE stood at 25.1% in FY25, though lower than FY23 due to a larger capital employed base and normalised profit levels.
Leverage is moderate: Debt/equity stayed broadly stable at around 0.46x-0.48x across FY23-FY25.
Liquidity is working-capital sensitive: Current ratio declined to 1.2x in FY25 from 1.5x in FY24 as current borrowings and trade payables increased.
Interest coverage improved from FY23: Interest coverage increased from 4.9x in FY23 to 6.4x in FY25.
Industry Overview
Industry Drivers
Fertiliser Demand, Food Security and Balanced Nutrition
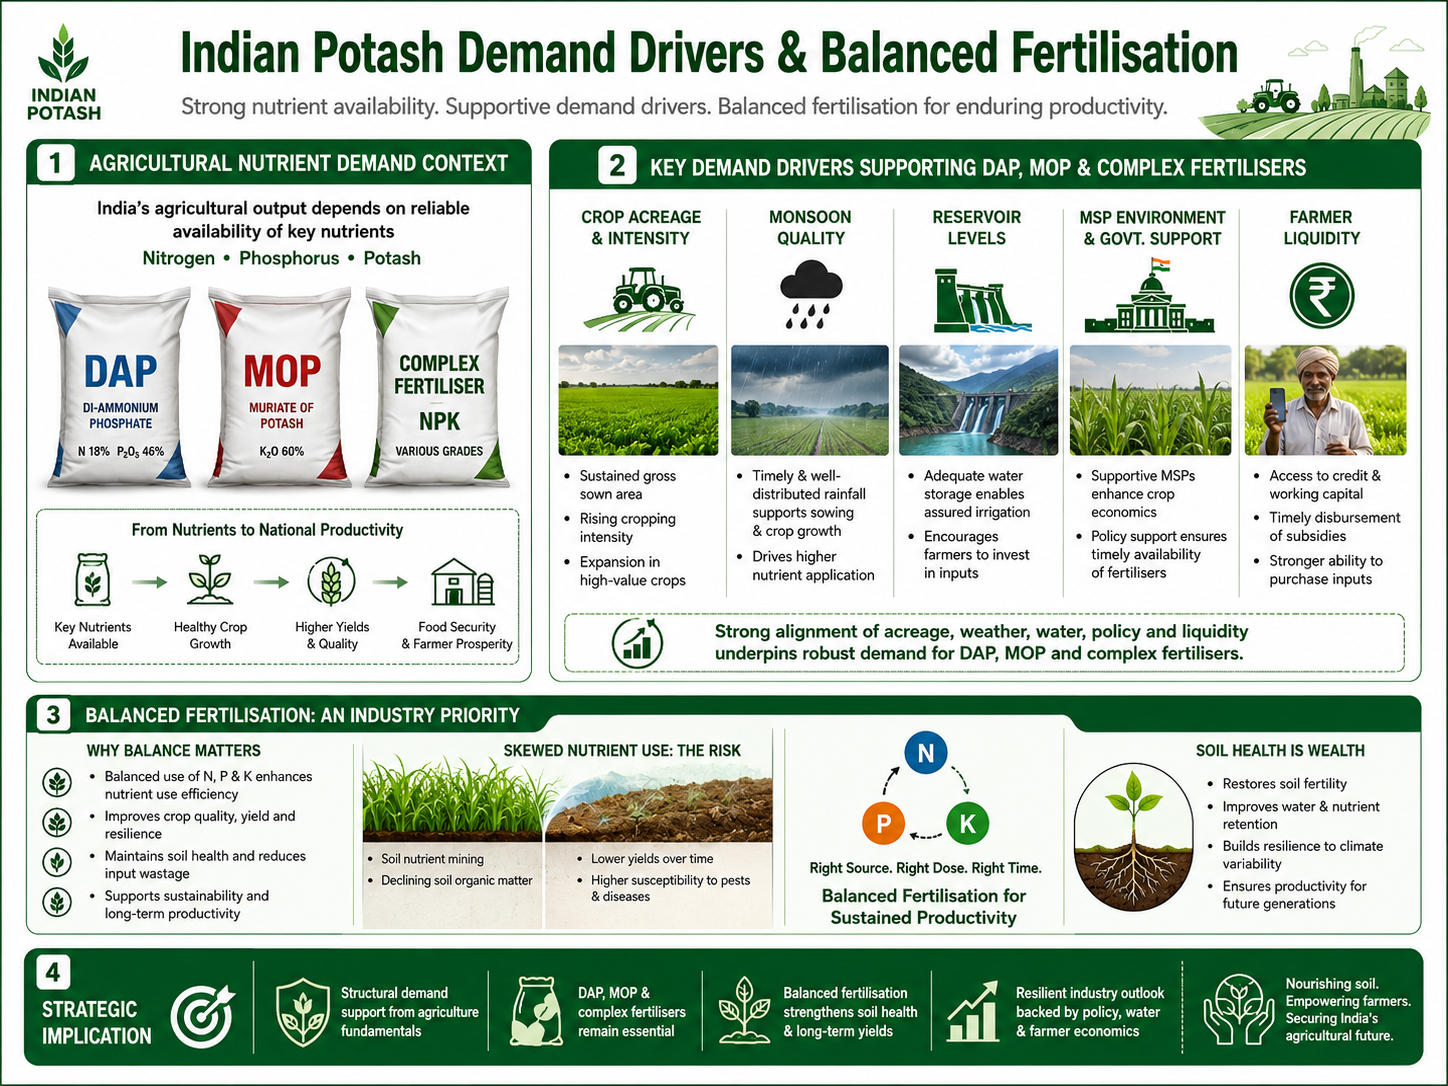
India’s agricultural output depends on reliable availability of key nutrients including nitrogen, phosphorus and potash.
Demand for DAP, MOP and complex fertilisers is supported by crop acreage, monsoon quality, reservoir levels, MSP environment and farmer liquidity.
Balanced fertilisation remains an industry priority because skewed nutrient use affects soil health and long-term productivity.
Import Linkages, Distribution Reach and Supply Security
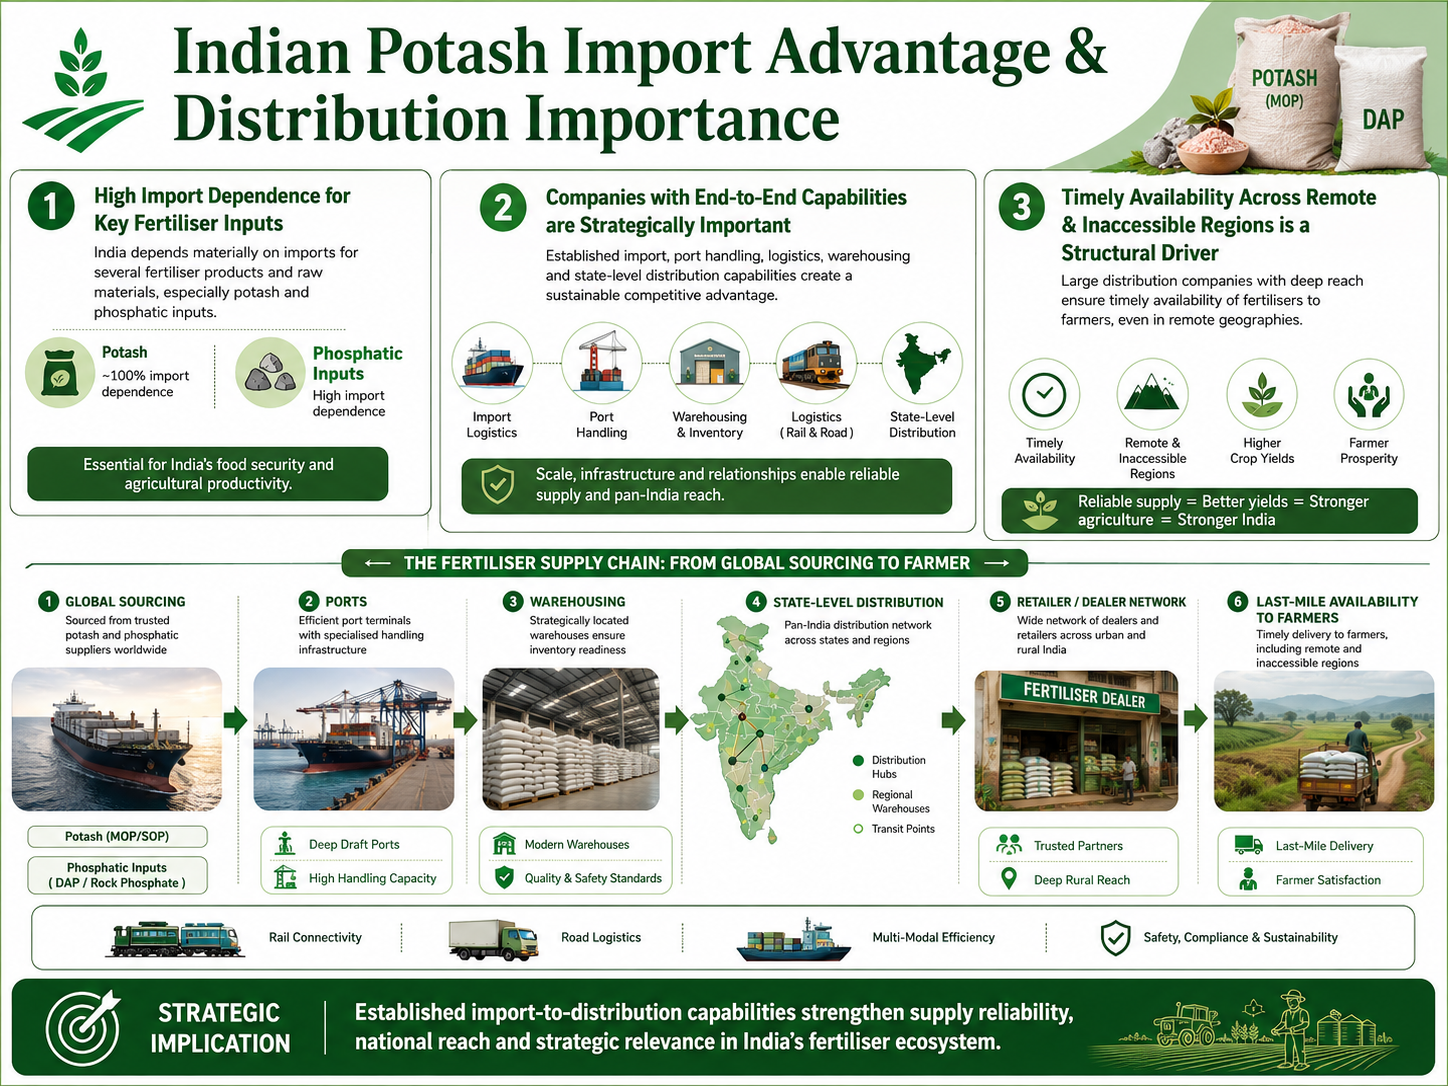
India depends materially on imports for several fertiliser products and raw materials, especially potash and phosphatic inputs.
Companies with established import, logistics, port, warehousing and state-level distribution capabilities are strategically important.
Timely availability across remote and inaccessible regions is a structural driver for large fertiliser distribution companies.
Adjacent Agri and Biofuel Opportunities
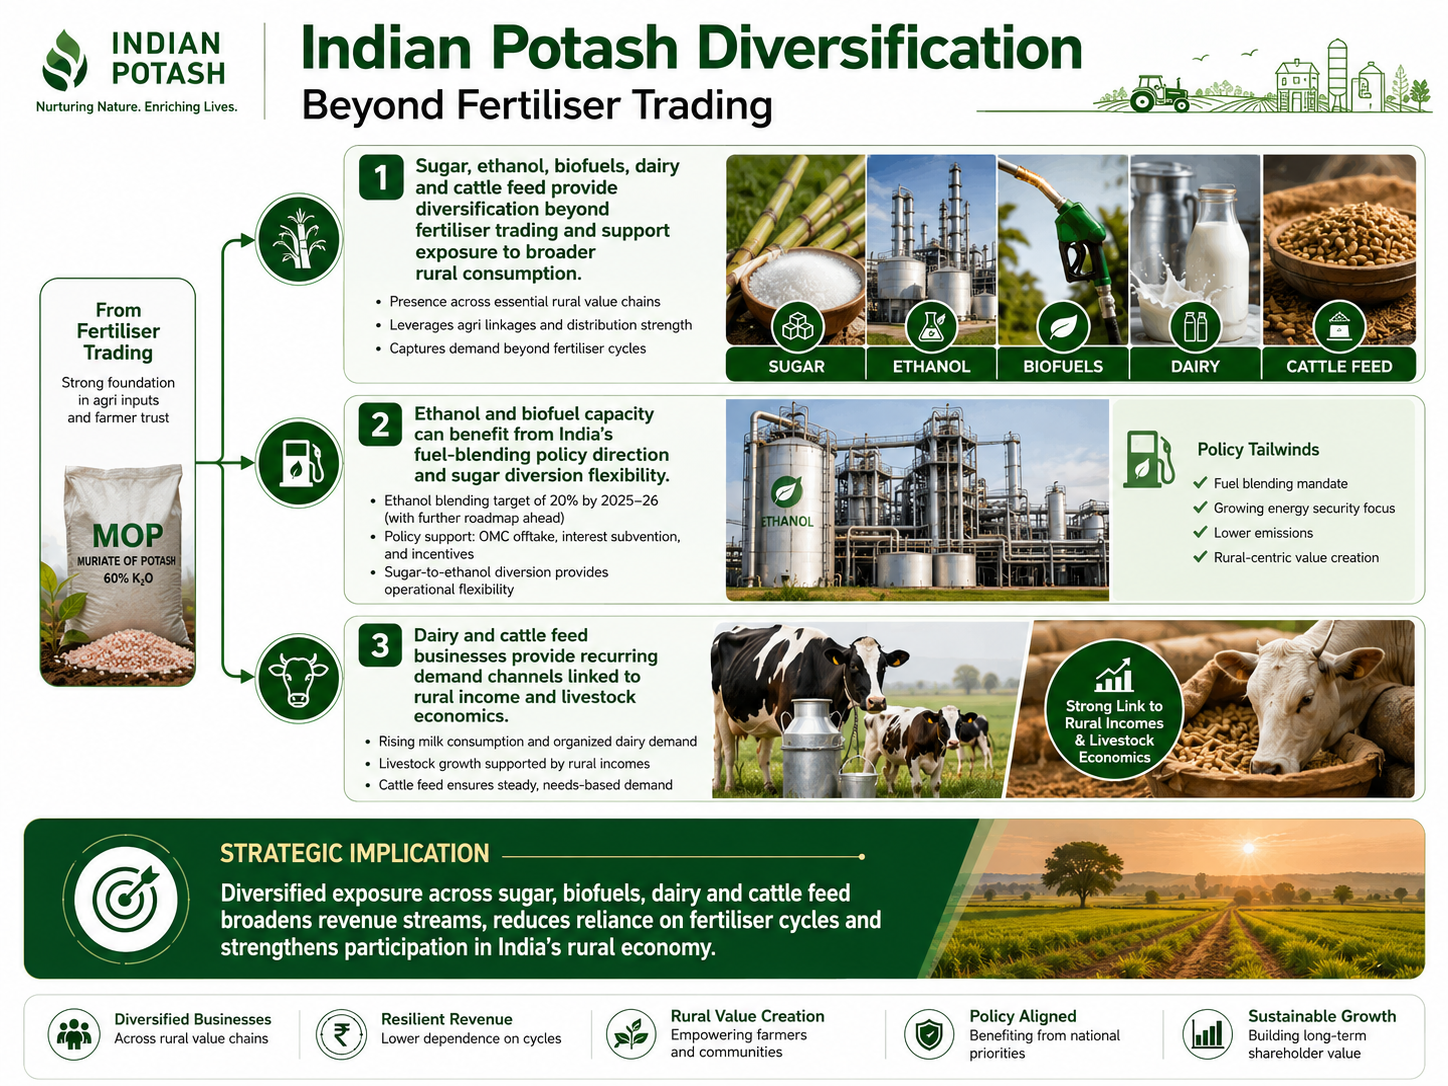
Sugar, ethanol, biofuels, dairy and cattle feed provide diversification beyond fertiliser trading and support exposure to broader rural consumption.
Ethanol and biofuel capacity can benefit from India’s fuel-blending policy direction and sugar diversion flexibility.
Dairy and cattle feed businesses provide recurring demand channels linked to rural income and livestock economics.
Risks in the Industry
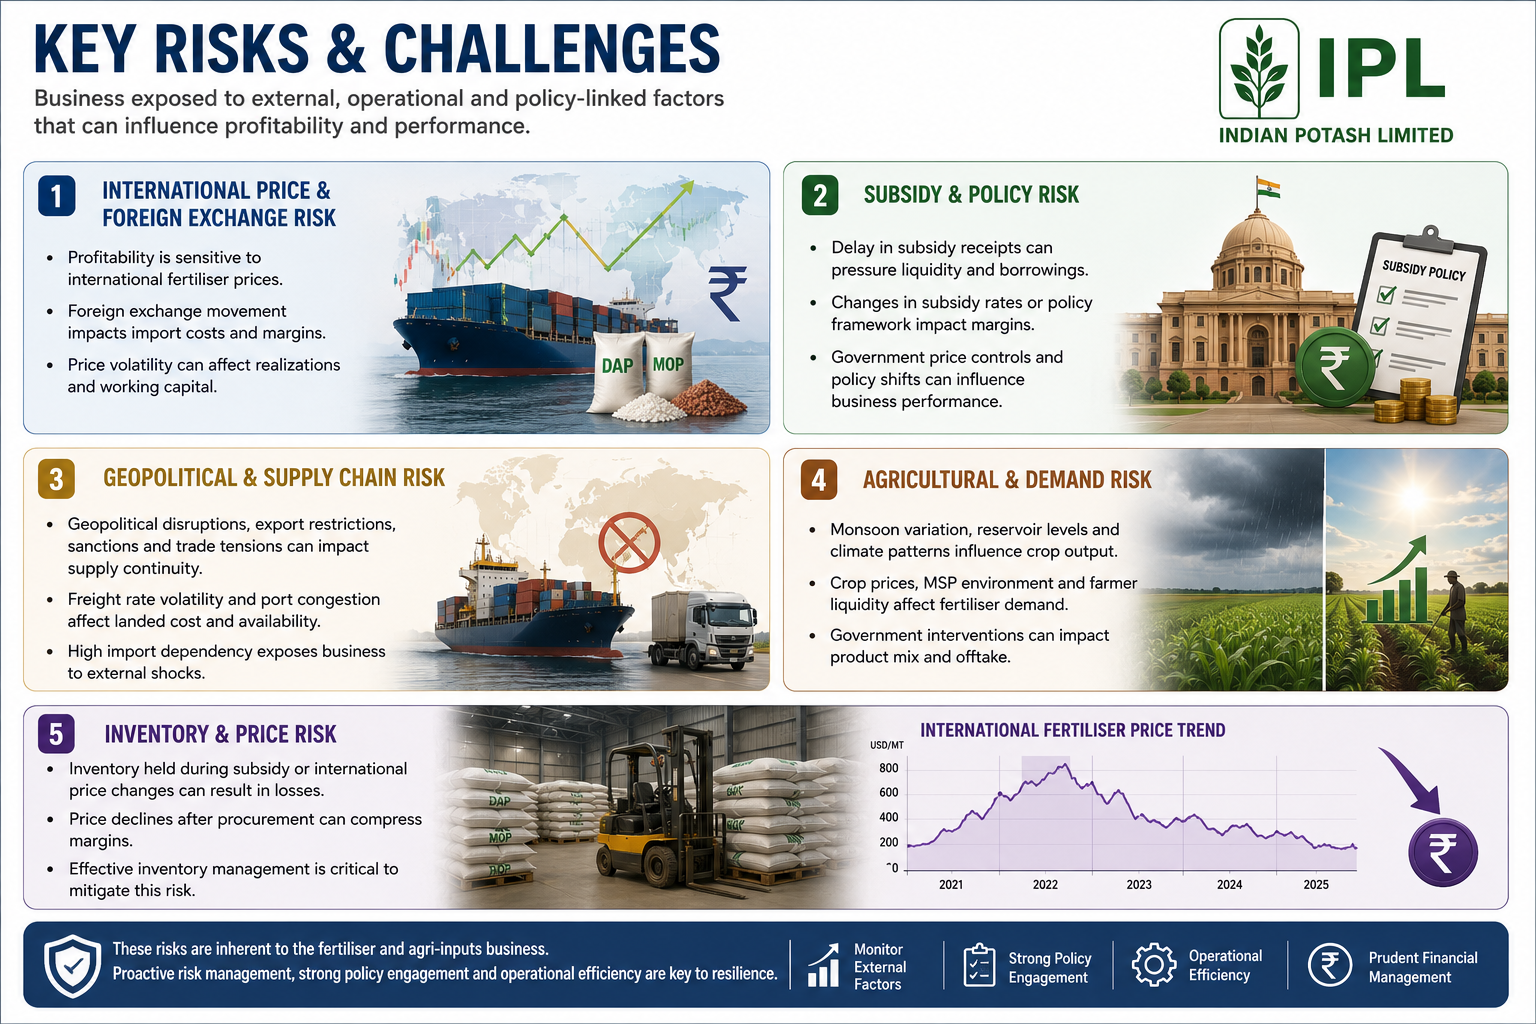
Profitability is sensitive to international fertiliser prices, foreign exchange movement and subsidy-rate revisions.
Delay in subsidy receipts can pressure liquidity, borrowings and working capital.
Geopolitical disruption, export restrictions, sanctions, freight volatility and import dependency can affect supply continuity.
Monsoon variation, crop prices, farmer liquidity and government price controls can influence product mix and demand.
Inventory held during subsidy or international price changes can result in losses or margin compression.
Government Policy Support
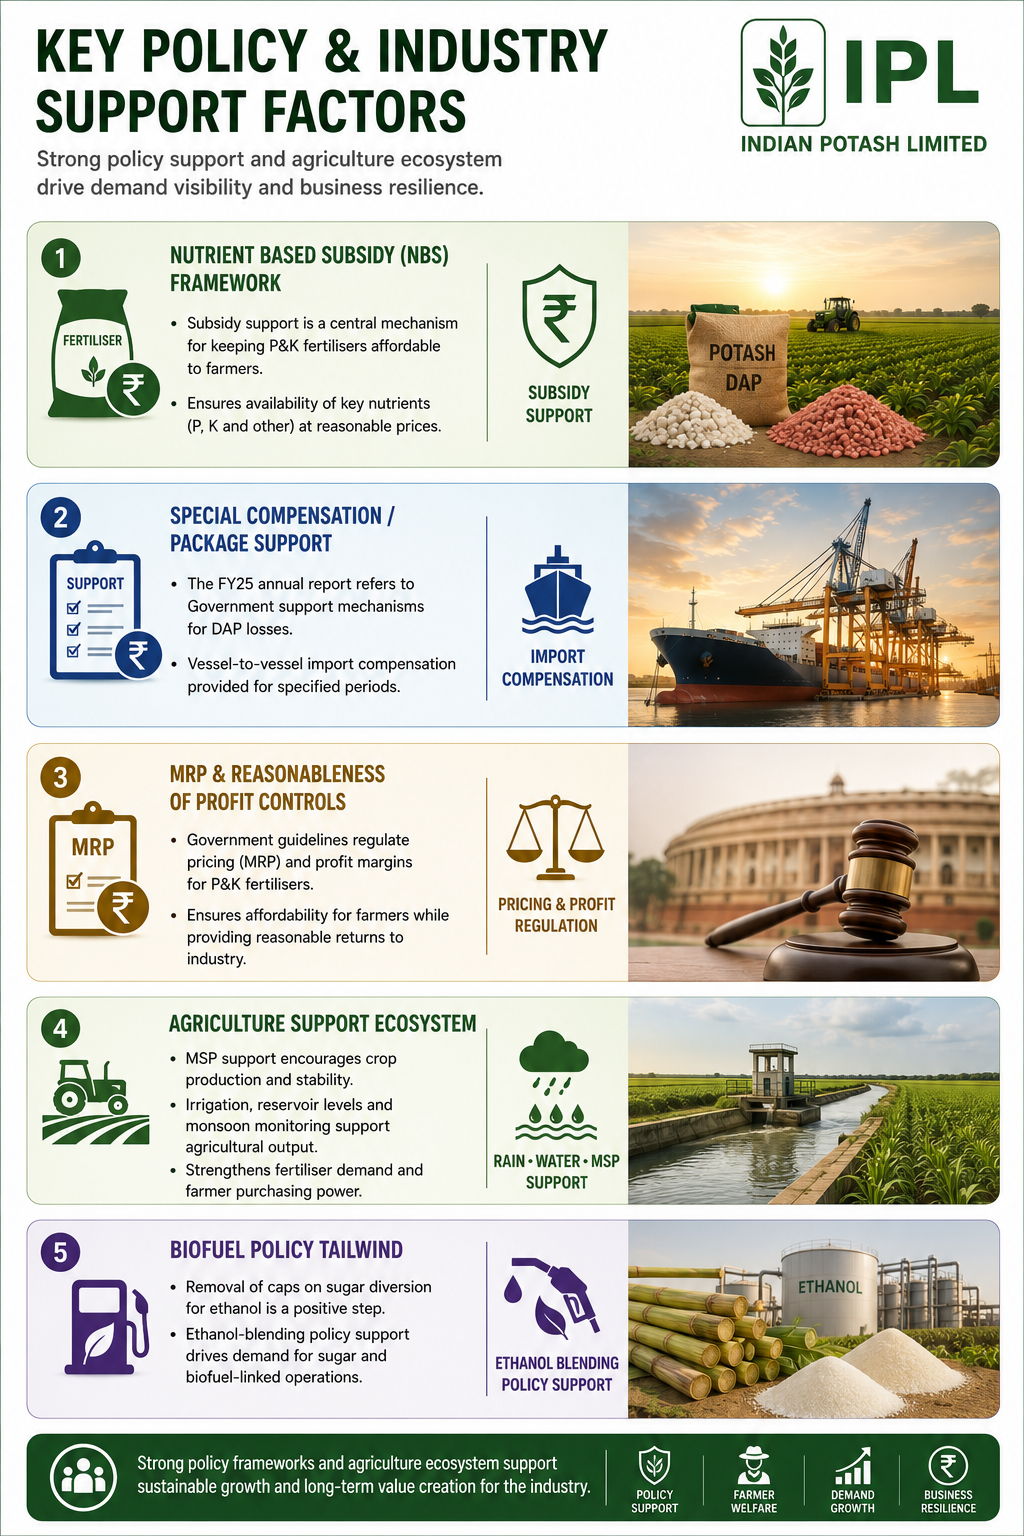
Nutrient Based Subsidy (NBS) framework: Subsidy support is a central mechanism for keeping P&K fertilisers affordable to farmers.
Special compensation / package support: The FY25 annual report refers to Government support mechanisms for DAP losses and vessel-to-vessel import compensation for specified periods.
MRP and reasonableness of profit controls: Government guidelines regulate pricing and profit margins for phosphatic and potassic fertilisers, shaping industry returns.
Agriculture support ecosystem: MSP, irrigation, reservoir levels and monsoon monitoring indirectly support fertiliser demand and farmer purchasing power.
Biofuel policy tailwind: Removal of caps on sugar diversion for ethanol and ethanol-blending policy support can benefit sugar and biofuel-linked operations.
- Overview
- Business
- Financial Highlights
- Industry Overview
- Documentation
Get the Preqt App and keep in touch around the clock!
 Monitor your investments in real-time.
- Receive tailored deal suggestions.
- Get real-time updates and alerts.
