


Infobay Ai Limited
Data That Powers AIPrecision for Artificial Intelligence
Unlisted Review and Rating
Considerable
DRHP Not FiledOverall Recommendation
InfoBay has delivered exceptional revenue and profit growth, high margins, strong cash generation, zero debt and substantial global AI exposure. Nevertheless, the investment requires customer-level due diligence because concentration is undisclosed, nearly all revenue is export-derived, the AI pivot has only a short operating history, no independent directors are identified, the FY26 attachment lacks the complete audit report, and unlisted quotations vary considerably. A purchase above approximately INR 4.1 lakh would offer a meaningfully smaller margin of safety.
PARAMETER
WEIGHT
SCORE
KEY FACTORS
Financial Performance
25.0%
5.0/5
Exceptional growth, margins, ROE, cash generation and zero debt produce a very strong financial score, subject to earnings-quality verification
Show more
Detailed Analysis
Revenue increased from INR 11.41 crore to INR 107.78 crore, representing an exceptional 207.3% two-year CAGR
Core EBITDA, excluding other income, was approximately INR 63.39 crore, producing a very strong 58.8% margin
FY26 PAT of INR 48.62 crore represented an excellent 45.1% margin, up from a loss in FY24
Conventional borrowings were nil at FY26-end against equity of ₹88.05 crore
PAT on average FY25–FY26 equity produces an exceptional 77.8% ROE
Industry
25.0%
4.0/5
Structural AI demand and export opportunities are excellent, but intense competition and evolving data regulations create meaningful execution risk
Show more
Detailed Analysis
India’s AI market is expected to grow approximately 25–35% annually and reach USD 17 billion by 2027
AI training data, model evaluation and post-training services remain in a rapid-growth, early-development stage
The industry includes global data specialists, outsourcing firms and customers developing internal capabilities, creating intense competition
Data privacy, dataset provenance, copyright, medical data and emerging AI regulations create meaningful compliance exposure
Management
25.0%
3.0/5
Strong revenue growth, improving EBITDA margins, asset-light model
Show more
Detailed Analysis
The promoters have approximately a decade of operating experience since the Company’s 2016 incorporation, including the EduGorilla-to-AI transition
Four directors are identified, but none is designated as independent in the FY26 disclosures
Director remuneration and reimbursements totalled INR 2.32 crore, approximately 2.2% of revenue
Valuation Metrics
25.0%
3.0/5
Strong revenue growth, improving EBITDA margins, asset-light model
Show more
Detailed Analysis
Approximately 12.5x is close to Datamatics’ 11.5x, above TaskUs’ 4.7x and below Innodata’s 28.7x
The approximately 9.4x P/B multiple remains expensive despite excellent ROE
Dealer indications range from approximately INR 299,000 to INR 410,711, showing wide pricing dispersion and limited liquidity
TOTAL
100%
3.8/5
Weighted Composite Score
Per Share Price
₹425000.0
As of 24 Oct 2026
Lot Size
1.0 Shares
Minimum Investment
₹4,25,000.0 / 1 shares
Market Cap. (₹ Cr)
Revenue FY’26
PAT FY’26
P/E Multiple
Face Value
₹ 10.0Lot Size
1.0 sharesSale Type
Secondary SalePAT FY’26
₹ 48.6 CrPAT Margin (%)
45.1 %P/E Multiple
14.2xCAGR Growth 3Y
116.7 %ROE (FY’26)
77.8 %ROCE (FY’26)
74.0 %Price to Book Value ratio
18.7xDebt/Equity (FY’26)
0.0xMerchant banker appointed
❌ NoCompany Website
infobay.aiDisclaimer: Unlisted shares are unregulated & illiquid. This is NOT investment advice. Please do your own due diligence before investing.
Minimum Investment
₹4,25,000.0 / 1 sharesShares Lot 1 X 1
Investment amount
₹4,25,000.0
Overview
Business
Business Model
Geographical Presence
Sales Channel
Key Risk Factor
Financial Highlights
Income Statement
Revenue growth with EBITDA and PAT margins
| Financial Metric | FY 2024 | FY 2025 | FY 2026 |
|---|---|---|---|
| Revenue (₹ Cr) | 11.4 | 48.4 | 107.8 |
| Growth (%) | 0.0% | 324.1% | 122.7% |
| EBITDA (₹ Cr) | 2.6 | 26.5 | 68.7 |
| EBITDA Margin (%) | 22.5% | 54.7% | 63.7% |
| PAT (₹ Cr) | -0.2 | 16.3 | 48.6 |
| PAT Margin (%) | -1.7% | 33.6% | 45.1% |
OBSERVATIONS & INSIGHTS
Revenue expanded 324.1% in FY25 and 122.7% in FY26, producing a 207.3% two-year CAGR despite moderation from the FY25 growth rate
The EBITDA proxy increased from ₹2.6 Cr to ₹68.7 Cr and margin expanded by 41.2 percentage points as revenue outpaced the growth in operating costs
The FY24 loss of ₹0.2 Cr turned into PAT of ₹16.3 Cr in FY25 and ₹48.6 Cr in FY26. A PAT CAGR is not meaningful because the starting period was loss-making
Basic EPS rose sharply, but the small and changing weighted-average equity base means EPS should be reconciled to all outstanding equity, preference securities, options and conversion terms before valuation
Balance Sheet
| Financial Metric | FY 2024 | FY 2025 | FY 2026 |
|---|---|---|---|
| EQUITY & LIABILITIES | ₹ 22.2 Cr | ₹ 45.0 Cr | ₹ 106.9 Cr |
| Net Worth | ₹ 3.9 Cr | ₹ 37.0 Cr | ₹ 88.0 Cr |
| Share Capital | ₹ 0.0 Cr | ₹ 0.0 Cr | ₹ 0.0 Cr |
| Reserves & Surplus | ₹ 3.9 Cr | ₹ 37.0 Cr | ₹ 88.0 Cr |
| Total Liabilities | ₹ 18.3 Cr | ₹ 8.0 Cr | ₹ 18.9 Cr |
| Current Liabilities | ₹ 0.9 Cr | ₹ 7.3 Cr | ₹ 18.6 Cr |
| Borrowings | ₹ 0.0 Cr | ₹ 0.0 Cr | ₹ 0.0 Cr |
| Trade Payables | ₹ 0.4 Cr | ₹ 0.8 Cr | ₹ 0.5 Cr |
| Other Current Liabilities | ₹ 0.5 Cr | ₹ 6.5 Cr | ₹ 18.1 Cr |
| Non-Current Liabilities | ₹ 17.4 Cr | ₹ 0.7 Cr | ₹ 0.3 Cr |
| Borrowings | ₹ 17.1 Cr | ₹ 0.4 Cr | ₹ 0.0 Cr |
| Other Non-Current Liabilities | ₹ 0.3 Cr | ₹ 0.3 Cr | ₹ 0.3 Cr |
| ASSETS | ₹ 22.2 Cr | ₹ 45.0 Cr | ₹ 107.0 Cr |
| Current Assets | ₹ 10.7 Cr | ₹ 16.2 Cr | ₹ 76.3 Cr |
| Trade Receivables | ₹ 3.2 Cr | ₹ 3.3 Cr | ₹ 12.2 Cr |
| Inventory | ₹ 1.2 Cr | ₹ 1.0 Cr | ₹ 0.7 Cr |
| Cash & Cash Equivalents | ₹ 0.9 Cr | ₹ 0.8 Cr | ₹ 4.1 Cr |
| Other Current Assets | ₹ 5.4 Cr | ₹ 11.1 Cr | ₹ 59.3 Cr |
| Non-Current Assets | ₹ 11.5 Cr | ₹ 28.8 Cr | ₹ 30.7 Cr |
| Fixed Assets | ₹ 9.5 Cr | ₹ 6.2 Cr | ₹ 6.9 Cr |
| Other Non-Current Assets | ₹ 2.0 Cr | ₹ 22.6 Cr | ₹ 23.8 Cr |
OBSERVATIONS & INSIGHTS
Shareholders’ wealth increased from ₹3.9 Cr in FY24 to ₹88.1 Cr in FY26, driven predominantly by retained earnings and reserve movements
Non-current borrowings declined from ₹17.1 Cr to nil over two years, materially reducing financial risk
Other current assets increased to ₹59.3 Cr and other non-current assets reached ₹23.8 Cr, together representing 77.7% of FY26 total assets
Trade receivables increased to ₹12.2 Cr but represented 11.4% of FY26 revenue from operations
Fixed assets were ₹6.9 Cr in FY26, consistent with a service-led model, although capitalised intangible assets and their useful lives require review
Other current liabilities reached ₹18.1 Cr, mainly reflecting short-term provisions. Their nature, timing and cash-settlement requirements should be examined
Cash Flow
| Financial Metric | FY 2024 | FY 2025 | FY 2026 |
|---|---|---|---|
CFO (₹ Cr) Cash generated from core business operations. | +0.6 Cr | +20.2 Cr | +35.8 Cr |
CFI (₹ Cr) Cash used for investments and long-term assets. | -0.8 Cr | -20.3 Cr | -32.4 Cr |
CFF (₹ Cr) Cash flow related to funding and borrowings. | +0.3 Cr | +0 Cr | -0.1 Cr |
Working Capital
| Efficiency Metric | FY 2023 | FY 2024 | FY 2025 |
|---|---|---|---|
Debtor Days Average number of days taken to collect customer payments. | - | - | - |
Creditor Days Average time taken to pay suppliers and vendors. | - | - | - |
Inventory Days Average number of days inventory remains unsold. | - | - | - |
CCC (Cash Conversion Cycle) (Debtor Days + Inventory Days - Creditor Days) | - | - | - |
Financial Ratios
Measures the company’s leverage relative to shareholder equity.
OBSERVATIONS & INSIGHTS
ROE reached 77.8%, ROA reached 45.4% and ROCE reached 74.0% in FY26 as earnings grew much faster than the capital base
Debt-to-equity declined from 4.4x in FY24 to effectively nil in FY25 and 0.0x in FY26
FY25 finance cost was nominal and FY26 finance cost was nil, making conventional interest coverage extremely high or not applicable
Industry Overview
Industry Drivers
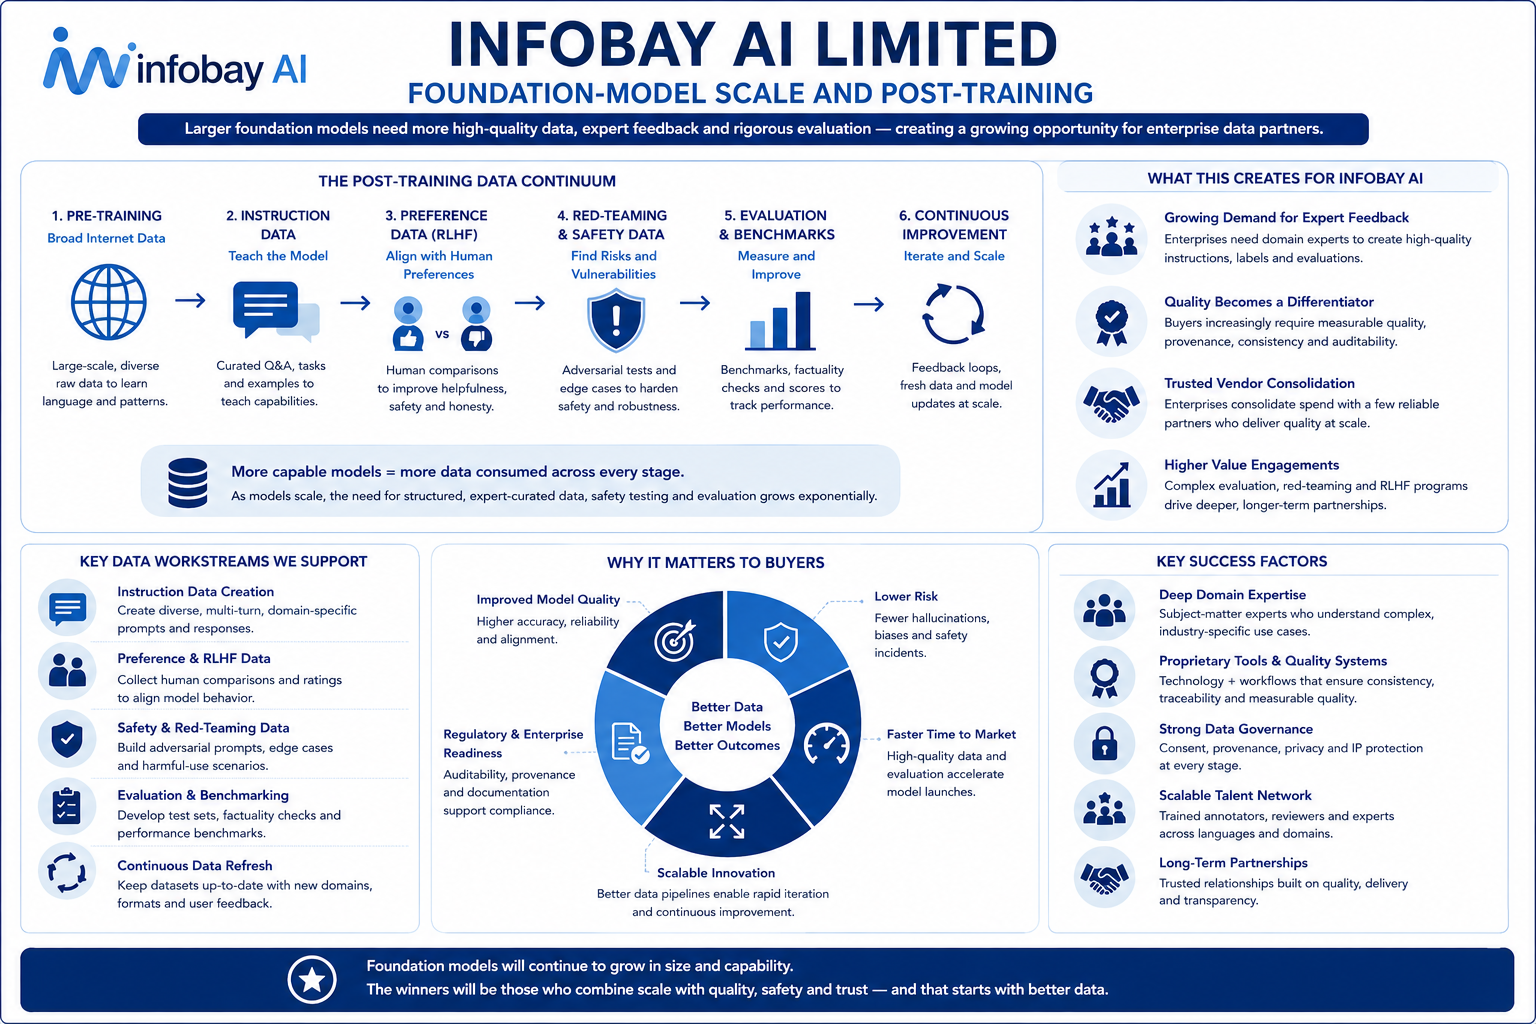
Foundation-Model Scale and Post-Training
Larger models require extensive instruction data, preference data, red-team cases and benchmark evaluation
This expands demand for structured expert feedback, but buyers increasingly require measurable quality and may consolidate spending among trusted vendors
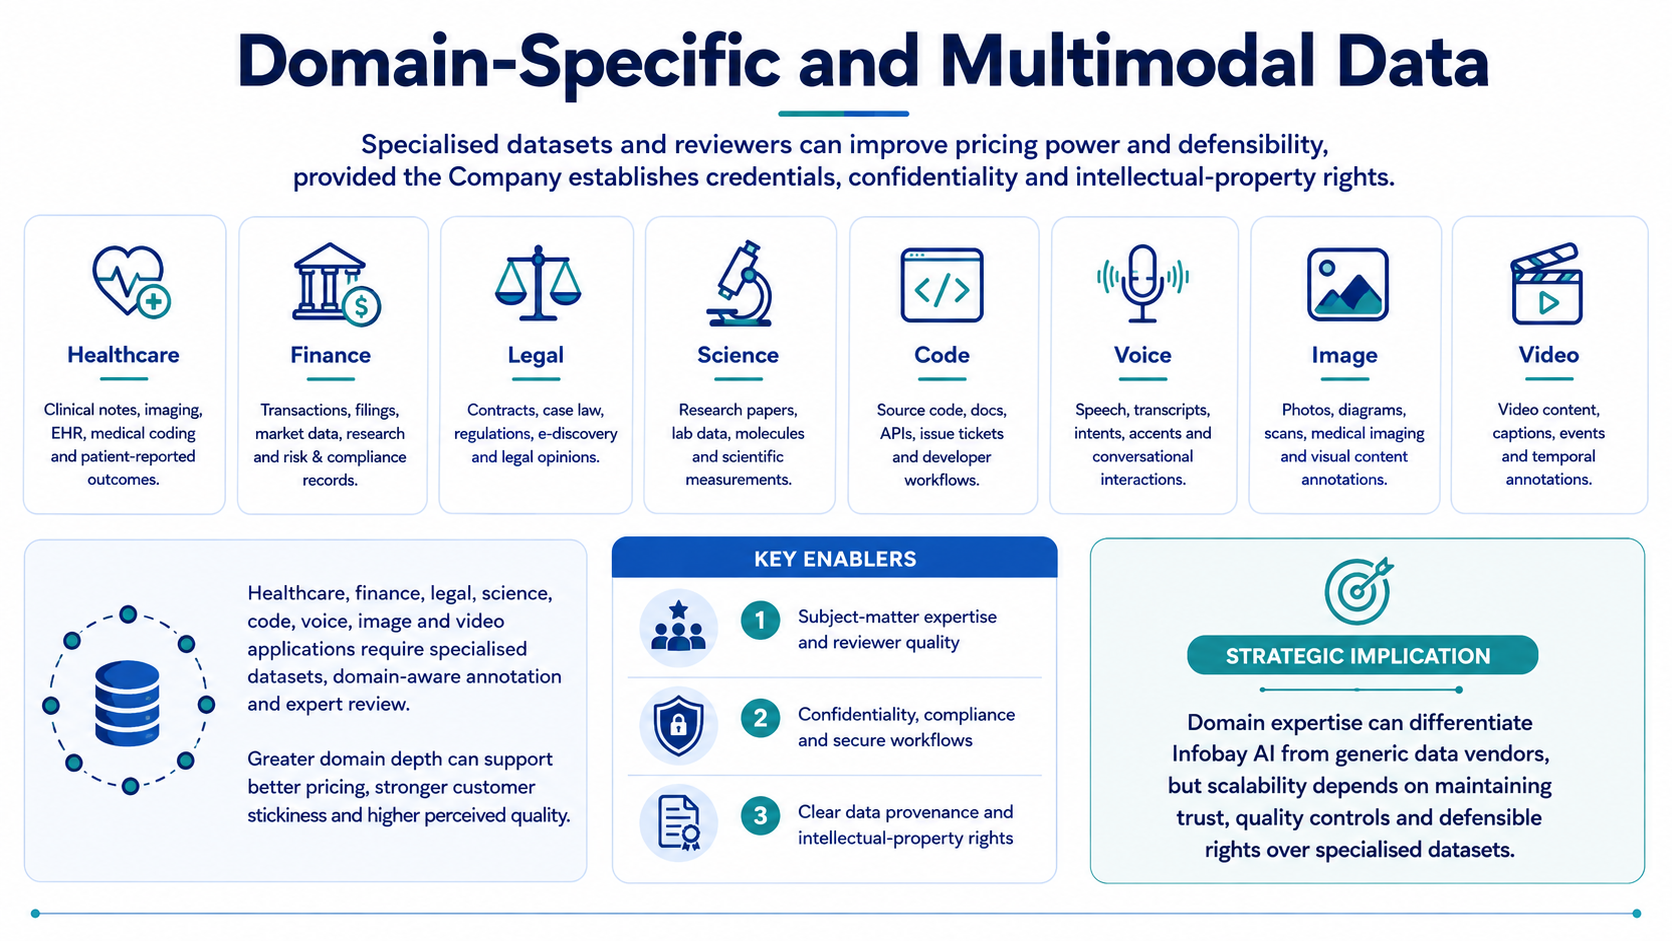
Domain-Specific and Multimodal Data
Healthcare, finance, legal, science, code, voice, image and video applications need specialised datasets and reviewers
Domain depth can improve pricing and defensibility, provided the Company can establish credentials, confidentiality and intellectual-property rights
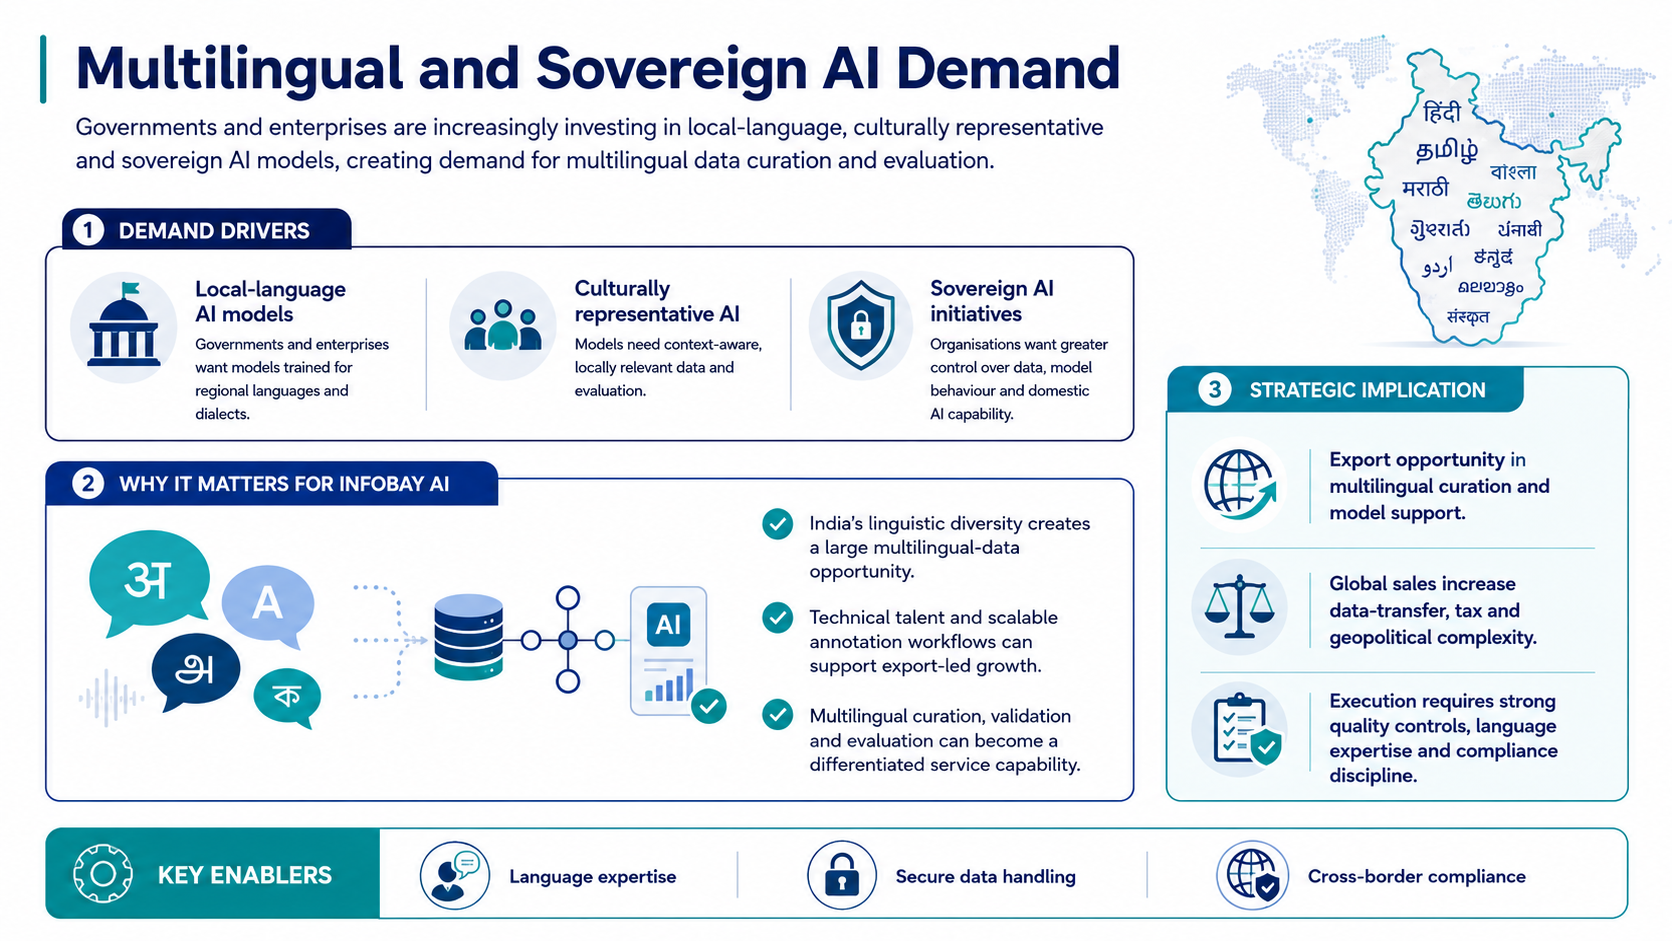
Multilingual and Sovereign AI Demand
Governments and enterprises are investing in local-language and culturally representative models
India’s linguistic diversity and technical talent create an export opportunity for multilingual curation, although global sales increase data-transfer, tax and geopolitical complexity
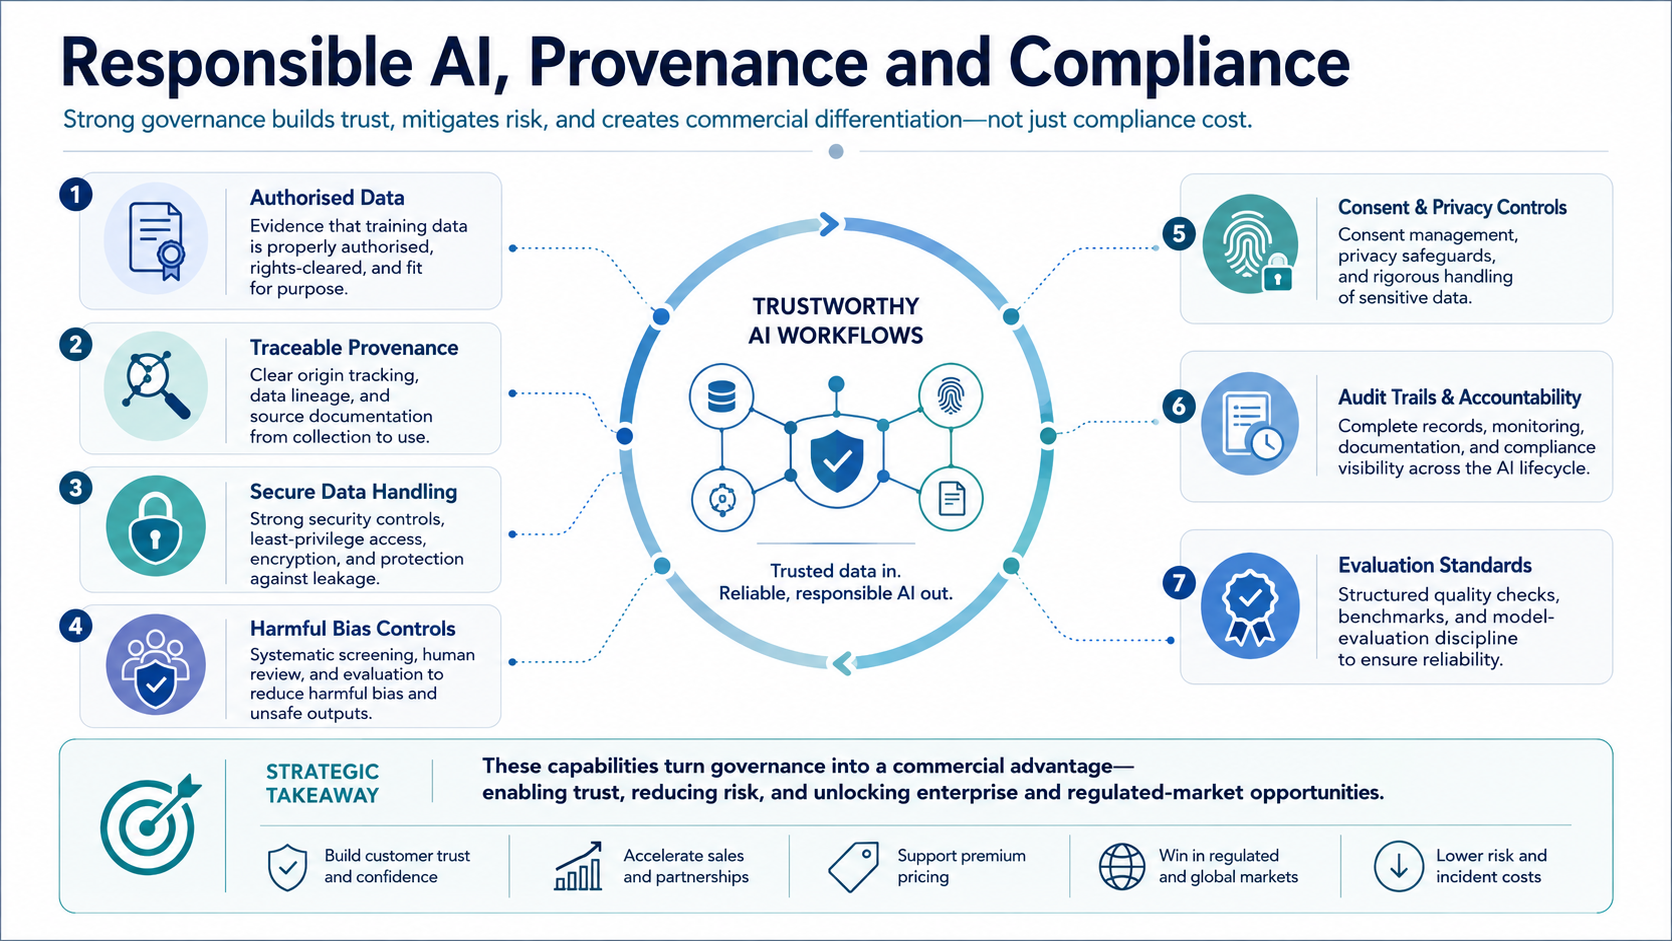
Responsible AI, Provenance and Compliance
Customers need evidence that training data is authorised, traceable, secure and free from harmful bias or leakage
Strong consent, audit trails, privacy controls and evaluation standards can become differentiators rather than only compliance costs
Government Policy Support
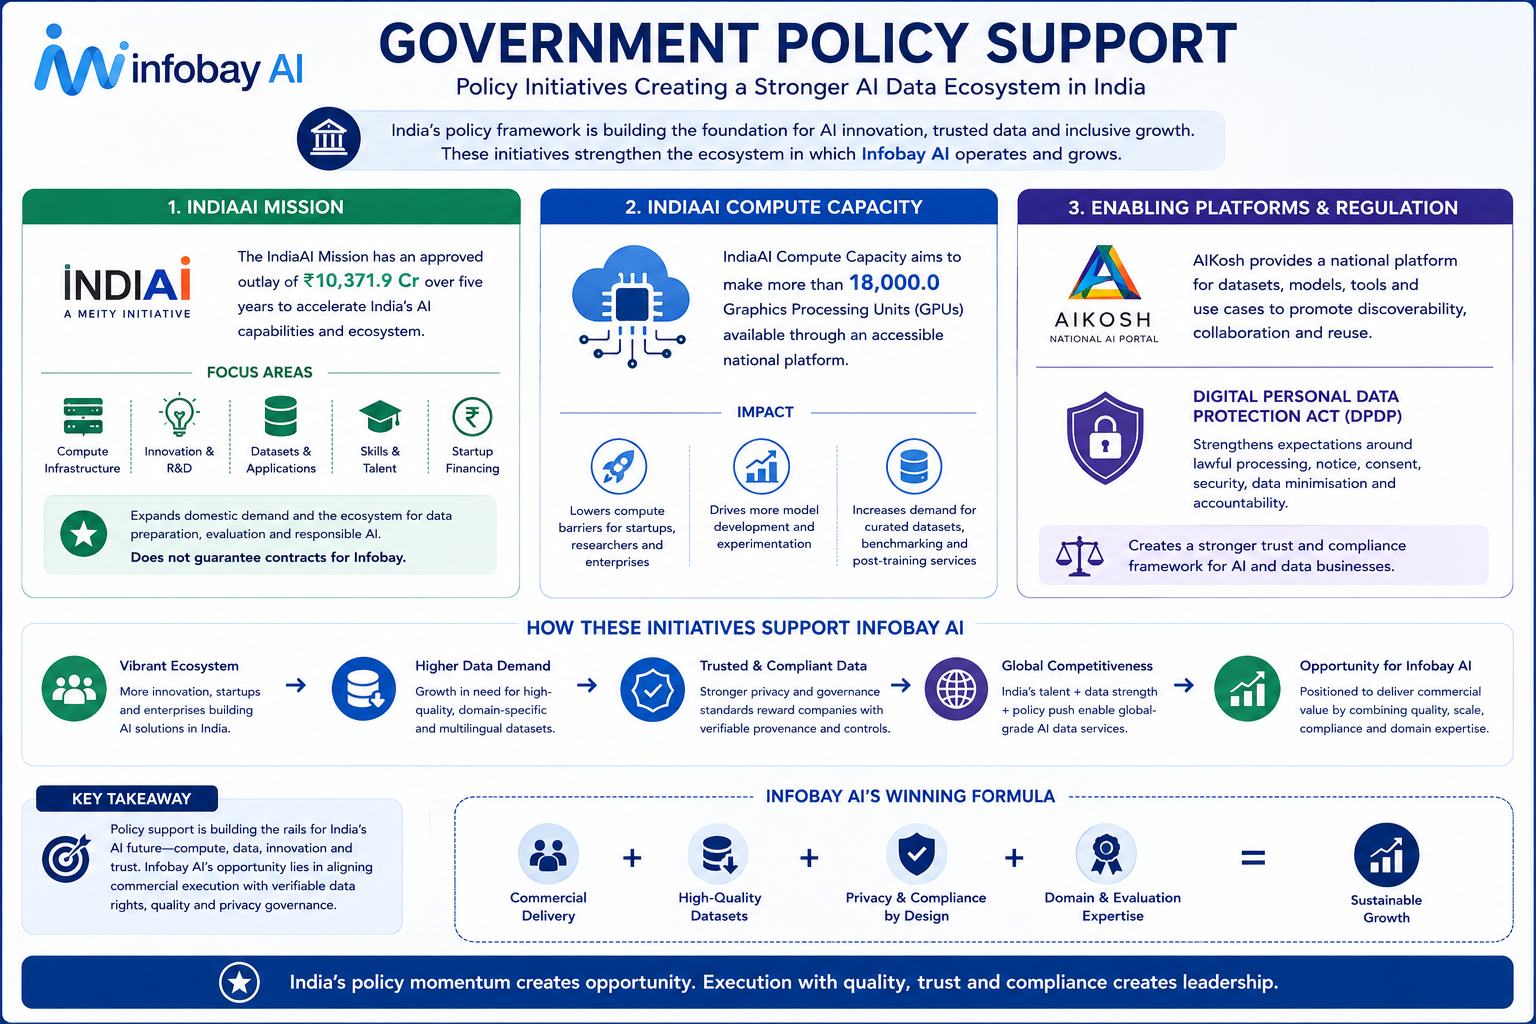
The IndiaAI Mission has an approved outlay of ₹10,371.9 Cr over five years to support compute infrastructure, innovation, datasets, applications, skills, startup financing and safe or trusted AI. These programmes can expand domestic demand and the ecosystem for data preparation and evaluation, but they do not guarantee contracts for Infobay
IndiaAI Compute Capacity is intended to make more than 18,000.0 graphics-processing units available through an accessible national platform. Lower compute barriers can increase model-development activity and indirectly create demand for curated datasets, benchmarking and post-training services
AIKosh provides a national platform for datasets, models and use cases, while the Digital Personal Data Protection framework increases expectations around lawful processing, notice, consent, security and accountability. Infobay’s opportunity therefore depends on combining commercial delivery with verifiable data rights and privacy governance
- Overview
- Business
- Financial Highlights
- Industry Overview
- Documentation
Get the Preqt App and keep in touch around the clock!
 Monitor your investments in real-time.
- Receive tailored deal suggestions.
- Get real-time updates and alerts.
