


Jainam Broking Limited
Markets Made AccessibleConnecting Capital, Creating Wealth
Unlisted Review and Rating
Buy
DRHP FiledOverall Recommendation
Jainam Broking combines strong profitability, high ROE, improved leverage and an inexpensive FY25-based valuation, making the financial profile the strongest part of the score. The weakness lies in earnings quality and predictability: revenue fell materially in FY25 even while PAT increased, proprietary/derivatives activity introduces greater volatility, and the current regulatory environment is actively reducing speculative trading activity. The INR 23.5 Cr NSE penalty is also important enough to warrant explicit governance monitoring. The Company screens positively overall, but the investment case depends heavily on whether it can sustain FY25 profitability under the post-SEBI derivatives regime and whether the eventual IPO disclosures confirm that the current valuation discount is genuine rather than compensation for higher business and regulatory risk
PARAMETER
WEIGHT
SCORE
KEY FACTORS
Financial Performance
25.0%
5.0/5
Jainam has delivered exceptional medium-term earnings growth, high margins, strong ROE and substantial deleveraging. The main weakness is volatility rather than profitability: FY25 revenue fell materially after an unusually strong FY24, while cash conversion has swung sharply between years
Show more
Detailed Analysis
Revenue from operations increased from INR 551.6 Cr in FY23 to INR 1,990.2 Cr in FY25, implying a FY23–FY25 CAGR of 89.9%. However, FY25 revenue declined 22.6% YoY from the restated FY24 revenue of INR 2,570.3 Cr, showing substantial revenue volatility
Computed FY25 EBITDA was approximately INR 792.9 Cr, translating into an EBITDA margin of 39.8%, materially above the scoring threshold
FY25 PAT increased to INR 468.3 Cr from INR 388.1 Cr in FY24 despite the revenue decline. PAT margin was a strong 23.5%
Borrowings declined sharply to INR 1,093.4 Cr against equity of INR 1,760.2 Cr, resulting in D/E of 0.6x, versus approximately 1.1x in FY24
FY25 PAT against average FY24–FY25 equity produces an ROE of approximately 27.4%, reflecting strong capital productivity
Industry
25.0%
3.0/5
The structural demand story remains attractive, with rising demat penetration and a projected 16.0–18.0% medium-term industry growth rate. The offset is significant: broking is highly competitive, technology-driven and increasingly exposed to policy changes designed to reduce speculative derivatives activity
Show more
Detailed Analysis
CRISIL Intelligence estimated the Indian broking industry at FY24 levels and projected 16.0–18.0% medium-term growth. Active NSE clients had also grown at a 31.6% CAGR between FY19 and FY24
The industry remains in a structural growth phase, supported by financialisation, digital onboarding and retail participation. Demat accounts increased from 151.4 million in FY24 to 175.4 million by H1 FY25
Regulation is the biggest sector risk. Recent derivatives-market measures caused ADTO to decline approximately 25.0% in H2 FY25 and broking-industry revenue to decline 6.0% YoY in H1 FY26; the higher derivatives STT adds another headwind
Jainam has an IFSC presence, but the core broking opportunity remains overwhelmingly linked to Indian capital-market activity rather than export demand
Management
25.0%
4.0/5
The core promoter brings deep operating experience, and the Board has reasonable independent representation. Related-party operating exposure does not appear excessive from the FY25 accounts. However, the INR 23.5 Cr NSE penalty is a genuine governance consideration and prevents the management score from being stronger
Show more
Detailed Analysis
Chairman & MD Milan Suresh Parikh has approximately 31.0 years of capital-market/financial-services experience and has been a director since Jainam's incorporation period in 2003
As disclosed in 2025 IPO-related documentation, the Board had 6.0 directors, including 3.0 independent directors, giving 50.0% independence
The FY25 accounts disclose promoter/group transactions, including financing and interest items, but operating RPT income remains small relative to revenue. The accounts state that RPTs were undertaken in the ordinary course and on an arm's-length basis
Valuation Metrics
25.0%
4.0/5
Strong revenue growth, improving EBITDA margins, asset-light model
Show more
Detailed Analysis
FY25 EPS of INR 26.0 per share implies a P/E of approximately 8.4x. Current P/E multiples for Angel One, 5paisa, Geojit and Motilal Oswal average approximately 32.7x, implying Jainam trades at approximately a 74.4% discount
Conservatively deducting only cash equivalents, Jainam's estimated EV is approximately INR 4,985.9 Cr, producing EV/EBITDA of 6.3x. Angel One and Motilal Oswal's three-year average EV/EBITDA benchmarks are approximately 9.7x and 9.3x, respectively, giving a peer/company ratio of approximately 1.5x
FY25 equity of INR 1,760.2 Cr implies book value of approximately INR 97.8 per share and P/B of approximately 2.2x
TOTAL
100%
4.0/5
Weighted Composite Score
Per Share Price
₹260.0
As of 24 Oct 2026
Lot Size
1,000.0 Shares
Minimum Investment
₹2,60,000.0 / 1,000 shares
Market Cap. (₹ Cr)
Revenue FY’25
PAT FY’25
P/E Multiple
Face Value
₹ 2.0Lot Size
1,000.0 sharesSale Type
Secondary SalePAT FY’25
₹ 468.3 CrPAT Margin (%)
23.5 %P/E Multiple
8.4xCAGR Growth 3Y
89.9 %ROE (FY’25)
27.4 %ROCE (FY’25)
25.0 %Price to Book Value ratio
2.2xDebt/Equity (FY’25)
0.6xMerchant banker appointed
❌ NoCompany Website
www.jainam.inDisclaimer: Unlisted shares are unregulated & illiquid. This is NOT investment advice. Please do your own due diligence before investing.
Minimum Investment
₹2,60,000.0 / 1,000 sharesShares Lot 1000 X 1
Investment amount
₹2,60,000.0
Overview
Business
Business Model
Geographical Presence
Sales Channel
Financial Highlights
Income Statement
Revenue growth with EBITDA and PAT margins
| Financial Metric | FY 2023 | FY 2024 | FY 2025 |
|---|---|---|---|
| Revenue (₹ Cr) | 551.6 | 2,570.3 | 1,990.2 |
| Growth (%) | 0.0% | 366.0% | -23.5% |
| EBITDA (₹ Cr) | 244.9 | 720.5 | 793.1 |
| EBITDA Margin (%) | 44.4% | 28.0% | 39.8% |
| PAT (₹ Cr) | 166.2 | 388.1 | 468.3 |
| PAT Margin (%) | 30.1% | 14.9% | 23.5% |
OBSERVATIONS & INSIGHTS
Revenue increased sharply from INR 551.6 Cr in FY23 to INR 2,570.3 Cr in FY24, before declining 23.5% to INR 1,990.2 Cr in FY25. The volatility largely reflects Jainam's sizeable securities-trading and fair-value-linked revenue rather than a conventional recurring operating-revenue profile
Despite the FY25 revenue decline, the derived EBITDA proxy increased from INR 720.5 Cr to INR 793.1 Cr, while EBITDA margin recovered from 28.0% to 39.8%. This indicates substantially better cost and earnings conversion in FY25, helped by a lower finance-cost burden and a more favourable trading/fair-value outcome
PAT increased consistently from INR 166.2 Cr in FY23 to INR 388.1 Cr in FY24 and INR 468.3 Cr in FY25. FY25 PAT grew 20.6% despite lower revenue, causing PAT margin to improve sharply from 14.9% to 23.5%
Balance Sheet
| Financial Metric | FY 2023 | FY 2024 | FY 2025 |
|---|---|---|---|
| EQUITY & LIABILITIES | ₹ 2,177.7 Cr | ₹ 5,866.1 Cr | ₹ 4,299.8 Cr |
| Net Worth | ₹ 572.2 Cr | ₹ 1,653.4 Cr | ₹ 1,760.2 Cr |
| Share Capital | ₹ 27.0 Cr | ₹ 44.7 Cr | ₹ 36.0 Cr |
| Reserves & Surplus | ₹ 545.2 Cr | ₹ 1,608.7 Cr | ₹ 1,724.2 Cr |
| Total Liabilities | ₹ 1,605.5 Cr | ₹ 4,212.7 Cr | ₹ 2,539.6 Cr |
| Current Liabilities | ₹ 1,603.8 Cr | ₹ 4,194.5 Cr | ₹ 2,533.1 Cr |
| Borrowings | ₹ 238.6 Cr | ₹ 1,789.3 Cr | ₹ 1,093.4 Cr |
| Trade Payables | ₹ 1,307.6 Cr | ₹ 2,067.0 Cr | ₹ 1,326.1 Cr |
| Other Current Liabilities | ₹ 57.6 Cr | ₹ 338.2 Cr | ₹ 113.6 Cr |
| Non-Current Liabilities | ₹ 1.7 Cr | ₹ 18.2 Cr | ₹ 6.5 Cr |
| Borrowings | ₹ 0.0 Cr | ₹ 0.0 Cr | ₹ 0.0 Cr |
| Other Non-Current Liabilities | ₹ 1.7 Cr | ₹ 18.2 Cr | ₹ 6.5 Cr |
| ASSETS | ₹ 2,177.7 Cr | ₹ 5,866.2 Cr | ₹ 4,299.8 Cr |
| Current Assets | ₹ 2,168.6 Cr | ₹ 5,822.5 Cr | ₹ 4,231.9 Cr |
| Trade Receivables | ₹ 86.5 Cr | ₹ 201.8 Cr | ₹ 165.4 Cr |
| Inventory | ₹ 0.0 Cr | ₹ 0.0 Cr | ₹ 0.0 Cr |
| Cash & Cash Equivalents | ₹ 1,812.2 Cr | ₹ 51.8 Cr | ₹ 31.3 Cr |
| Other Current Assets | ₹ 269.9 Cr | ₹ 5,568.9 Cr | ₹ 4,035.2 Cr |
| Non-Current Assets | ₹ 9.1 Cr | ₹ 43.7 Cr | ₹ 67.9 Cr |
| Fixed Assets | ₹ 8.7 Cr | ₹ 36.9 Cr | ₹ 40.1 Cr |
| Other Non-Current Assets | ₹ 0.4 Cr | ₹ 6.8 Cr | ₹ 27.8 Cr |
OBSERVATIONS & INSIGHTS
Total assets increased from INR 2,177.7 Cr in FY23 to INR 5,866.3 Cr in FY24, an increase of approximately 169.4%. The expansion was principally associated with a substantially larger securities-for-trade position, higher borrowings and higher trade payables, demonstrating that Jainam's balance sheet can expand rapidly with capital-market and trading activity
Total assets declined 26.7% YoY to INR 4,299.9 Cr in FY25. Securities for trade reduced sharply from approximately INR 3,603.2 Cr to INR 1,191.0 Cr, while borrowings declined from INR 1,789.3 Cr to INR 1,093.4 Cr, indicating a material reduction in trading-book and funding intensity
Net worth increased from INR 572.2 Cr in FY23 to INR 1,653.5 Cr in FY24 and INR 1,760.2 Cr in FY25. This materially strengthened the capital base even as FY25 borrowings reduced, supporting the improvement in debt/equity discussed earlier
FY25 current liabilities were INR 2,533.2 Cr versus total liabilities of INR 2,539.7 Cr, while non-current liabilities were only INR 6.5 Cr. This reflects the clearing, settlement and funding structure of the broking business and makes treasury, collateral and liquidity management particularly important
Cash Flow
| Financial Metric | FY 2023 | FY 2024 | FY 2025 |
|---|---|---|---|
CFO (₹ Cr) Cash generated from core business operations. | +482.2 Cr | -1,704.6 Cr | +912.2 Cr |
CFI (₹ Cr) Cash used for investments and long-term assets. | +209.7 Cr | -296.5 Cr | +278.2 Cr |
CFF (₹ Cr) Cash flow related to funding and borrowings. | +200.1 Cr | +2,045.4 Cr | -1,217.6 Cr |
Financial Ratios
Measures the company’s leverage relative to shareholder equity.
OBSERVATIONS & INSIGHTS
ROE remained high at 34.7% in FY23 and 34.9% in FY24, before declining to 27.4% in FY25. The moderation reflects the substantially larger equity base in FY25, even though absolute PAT continued to increase
Debt/equity increased sharply from 0.4x in FY23 to 1.1x in FY24 as borrowings were used to support the enlarged trading and financial-asset book. It subsequently declined to 0.6x in FY25, indicating meaningful balance-sheet deleveraging
Interest coverage fell from 12.4x in FY23 to 3.6x in FY24 as finance costs rose materially, before recovering to 4.9x in FY25 following the reduction in borrowings and finance costs
ROA stayed broadly stable at 9.8%, 9.6% and 9.2% across FY23-FY25 despite substantial changes in the size and composition of the balance sheet. This indicates relatively strong profitability against the asset base, although market-linked gains materially influence the result
ROCE reduced from 40.6% in FY23 to 33.7% in FY24 and 25.0% in FY25. The decline primarily reflects the rapid expansion of equity and funding employed in the business; for a brokerage and financial-services company
Industry Overview
Industry Drivers
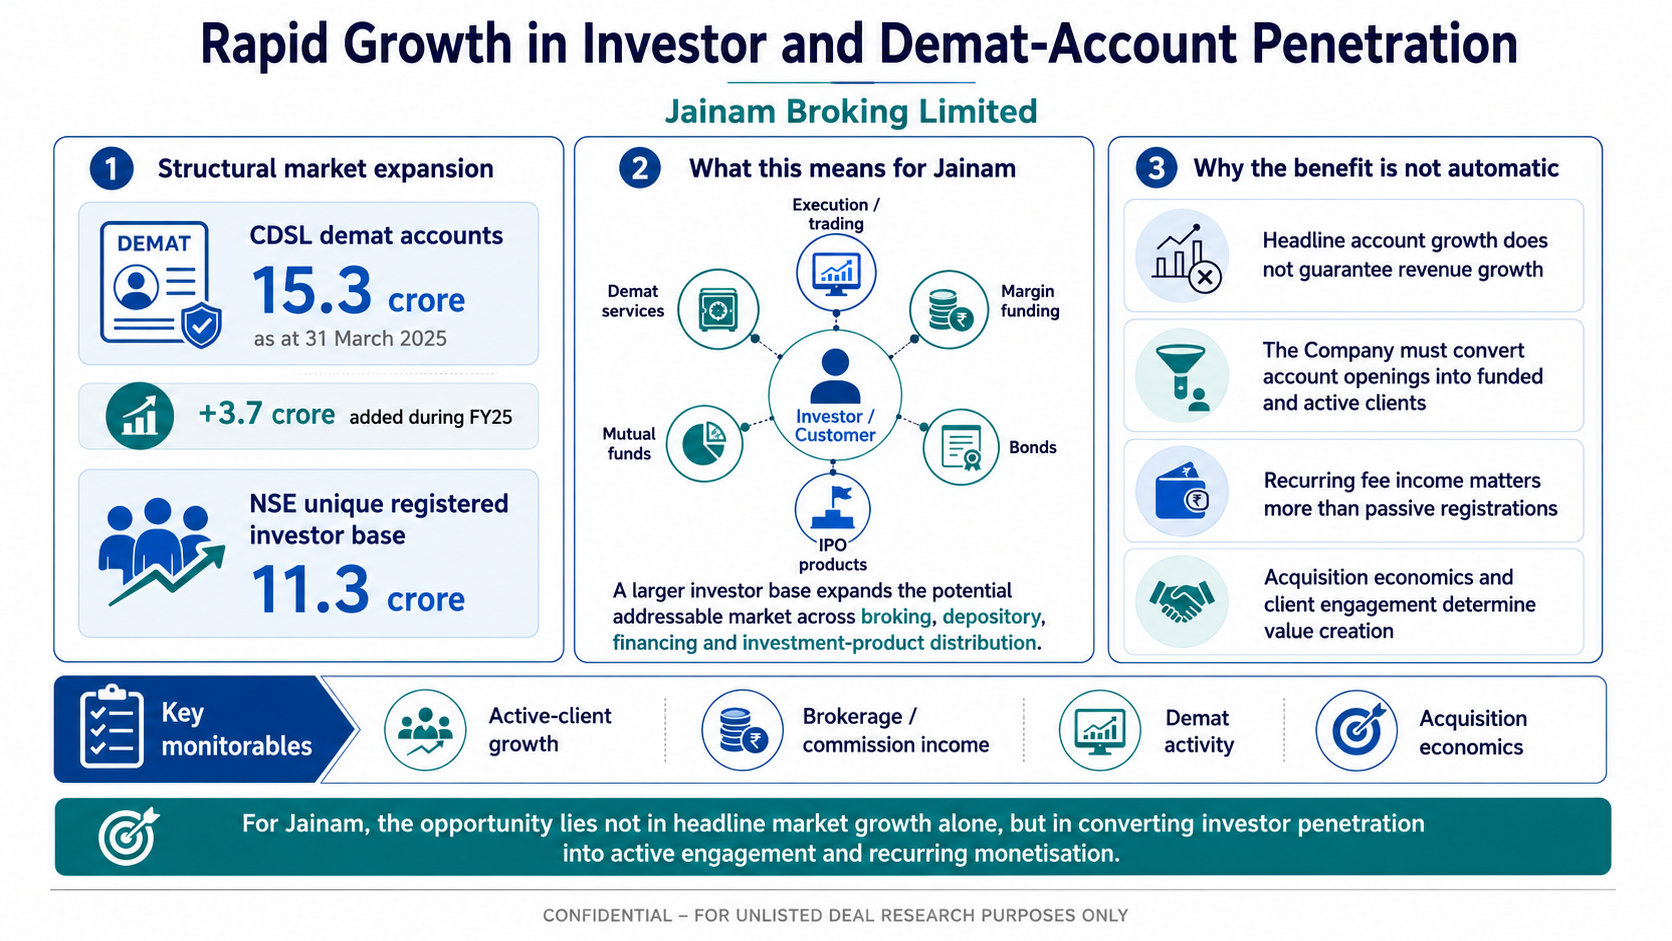
Rapid growth in investor and demat-account penetration
The most important structural driver is the continued expansion of the investor base. CDSL alone had 15.3 crore demat accounts at 31 March 2025 after adding 3.7 crore during FY25, while NSE’s unique registered investor base reached 11.3 crore
This creates a much larger pool of potential users for execution, demat, margin funding, mutual funds, bonds and IPO products
For Jainam, the benefit is not automatic, the Company must convert account growth into funded, active clients and recurring fee income. Monitor active-client growth, brokerage / commission income, demat activity and acquisition economics rather than only headline account openings
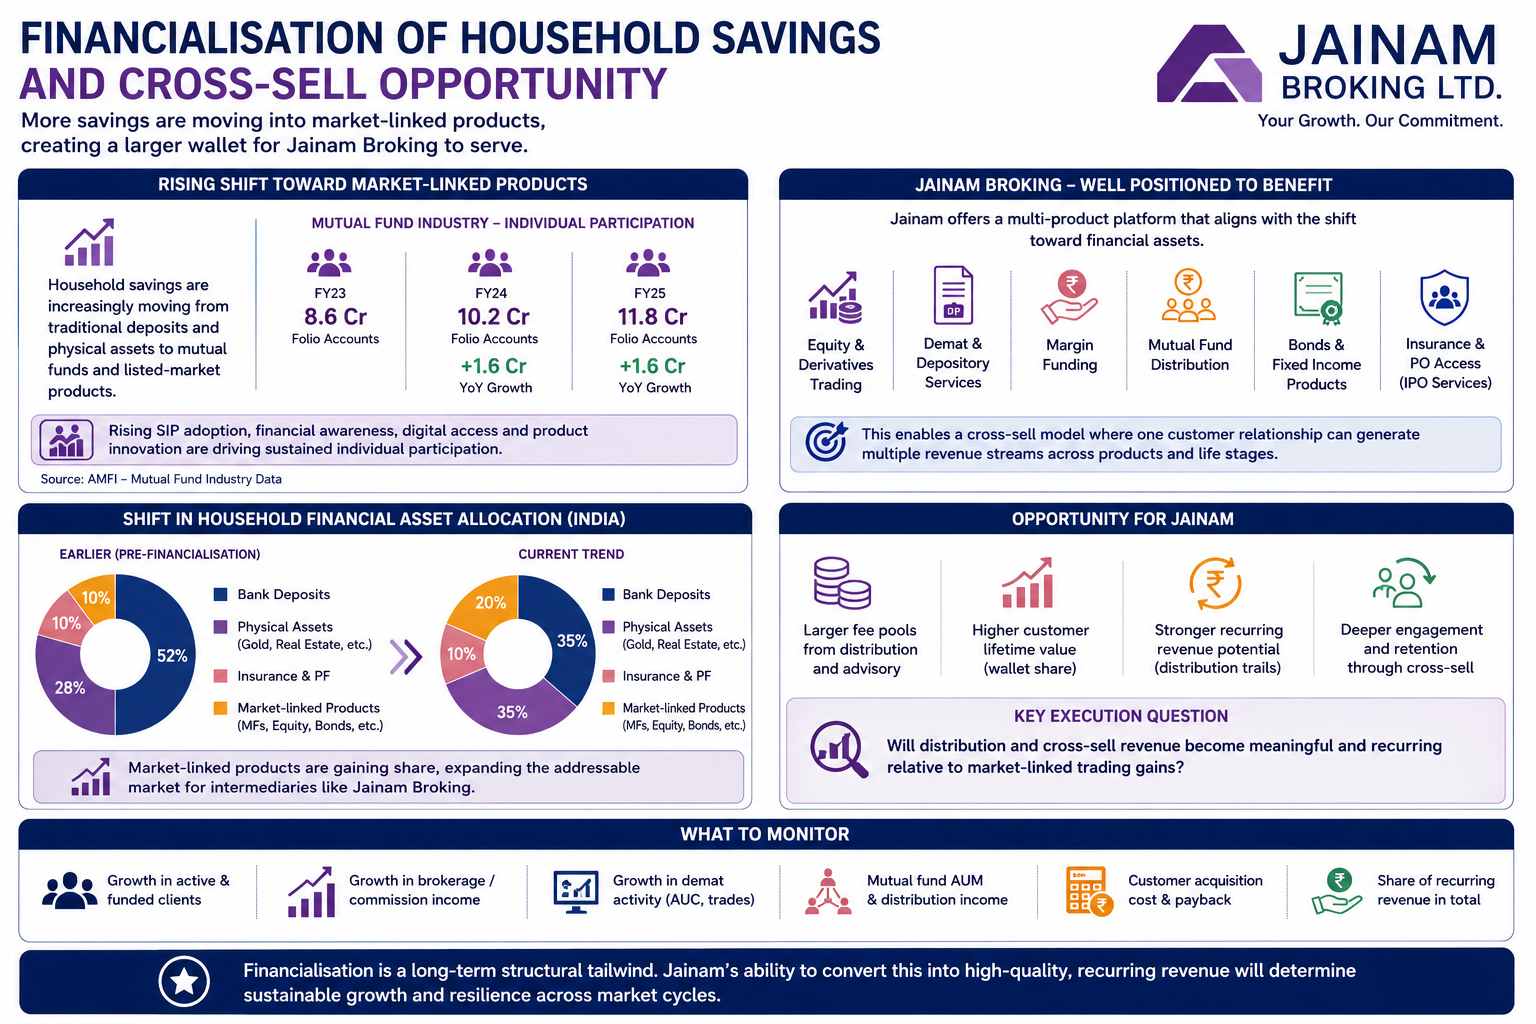
Financialisation of household savings and cross-sell opportunity
A growing share of household savings is moving toward mutual funds and listed-market products rather than remaining entirely in traditional deposits or physical assets
The FY25 mutual-fund data and broader industry disclosures show rising individual participation, supported by SIPs, financial awareness and digital access. Jainam already distributes mutual funds and offers bonds, insurance and IPO access, so this trend can expand fee pools and improve customer lifetime value
The key execution question is whether distribution revenue becomes meaningful and recurring relative to market-linked trading gains
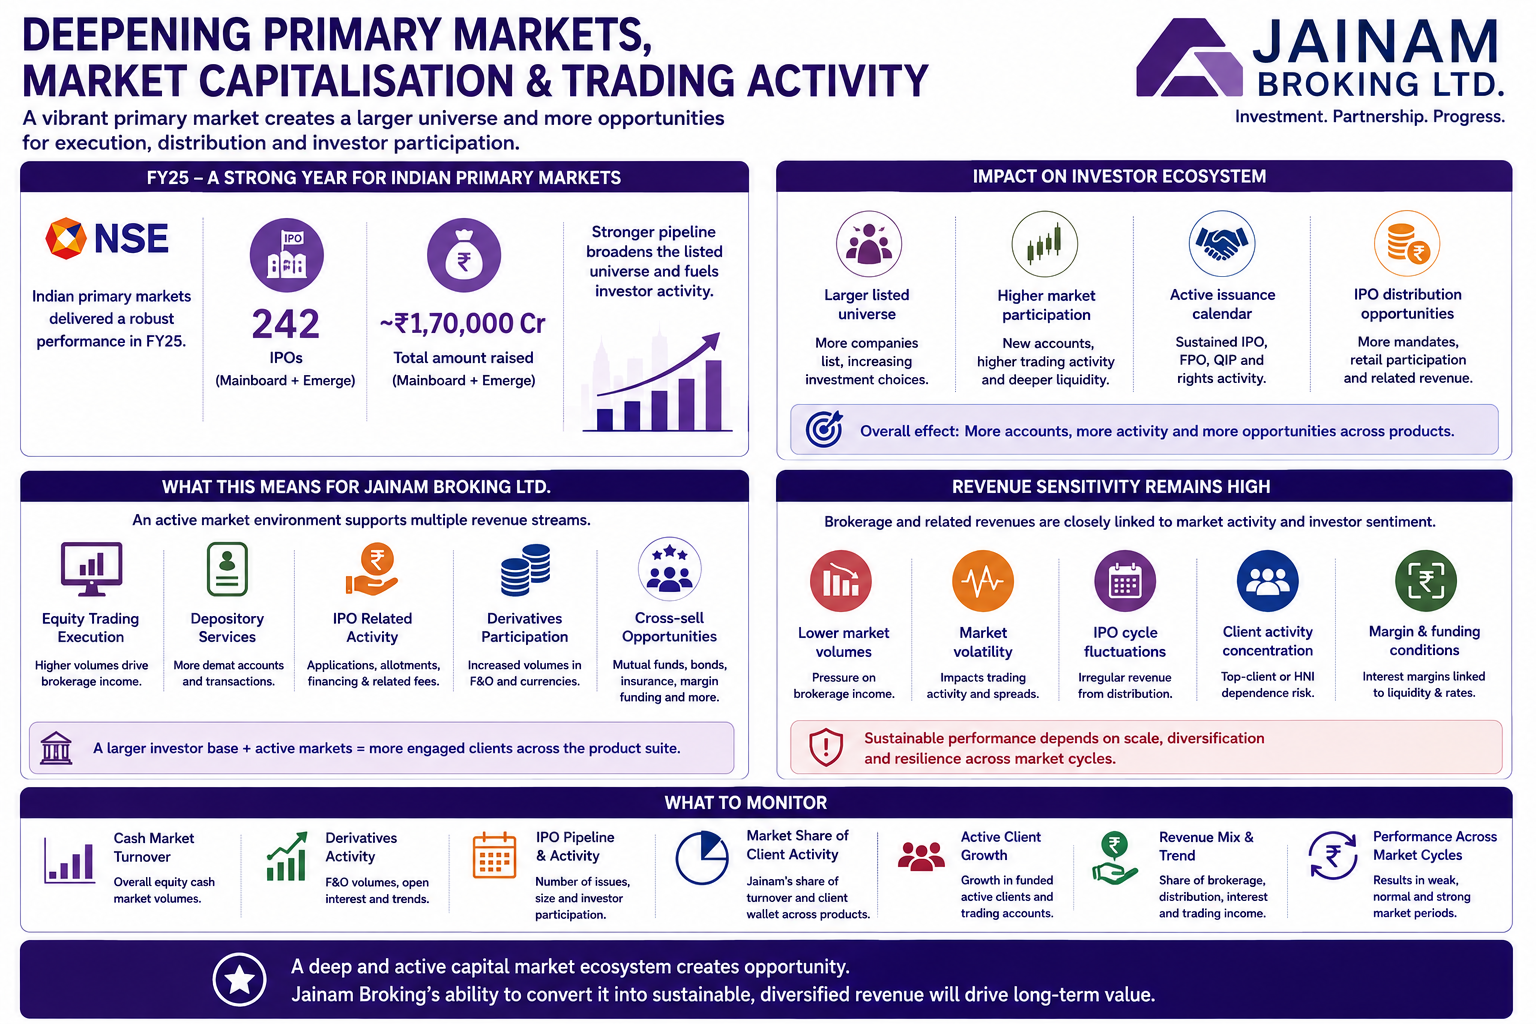
Deepening primary markets, market capitalisation and trading activity
FY25 was a strong year for Indian primary markets, with NSE reporting 242 IPOs and approximately INR 1,70,000.0 Cr raised across Mainboard and Emerge. A larger listed universe and active issuance calendar can create new trading accounts, higher secondary-market participation and IPO-distribution opportunities
For Jainam, this supports equity execution, depository and IPO-related activity, but revenue sensitivity to market volumes remains high
Monitor cash-market turnover, derivatives activity, IPO cycles and the Company’s share of client activity through weak as well as strong market periods
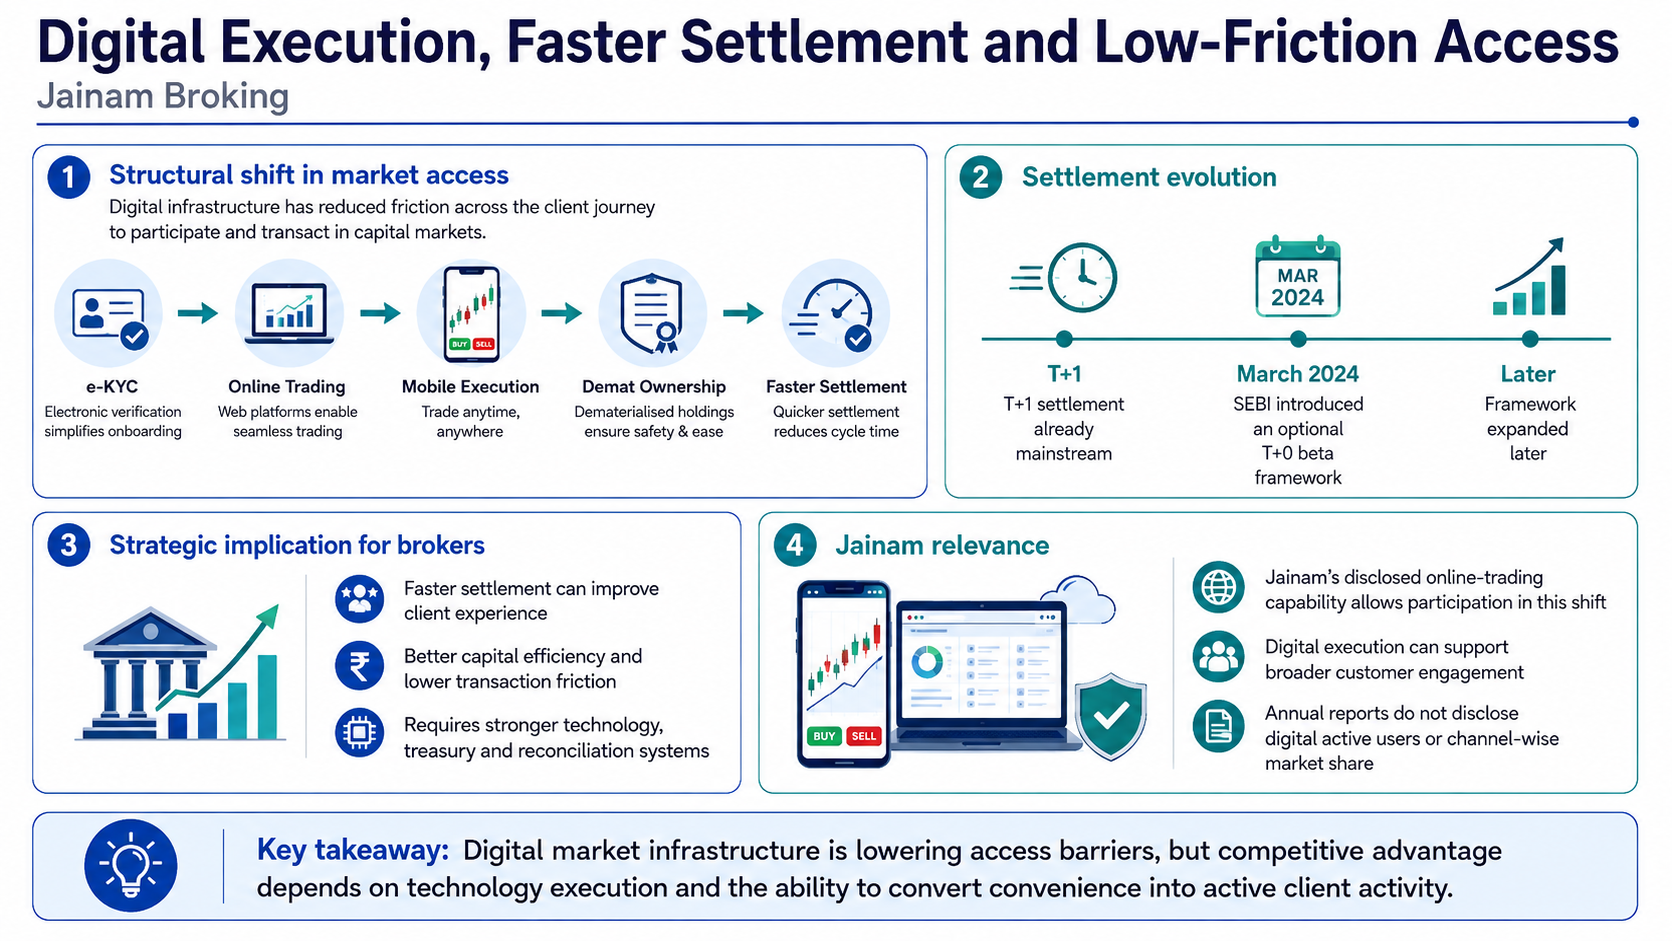
Digital execution, faster settlement and low-friction access
Electronic KYC, online trading, mobile execution, dematerialised ownership and progressively faster settlement have reduced the friction involved in entering and transacting in capital markets
SEBI introduced an optional T+0 beta framework in March 2024 in addition to T+1, and later expanded the framework. Faster settlement can improve capital efficiency and client experience, although it requires stronger technology, treasury and reconciliation systems at brokers. Jainam’s disclosed online-trading capability allows it to participate in this shift, but the annual reports do not disclose digital active users or channel-wise market share
Government Policy Support
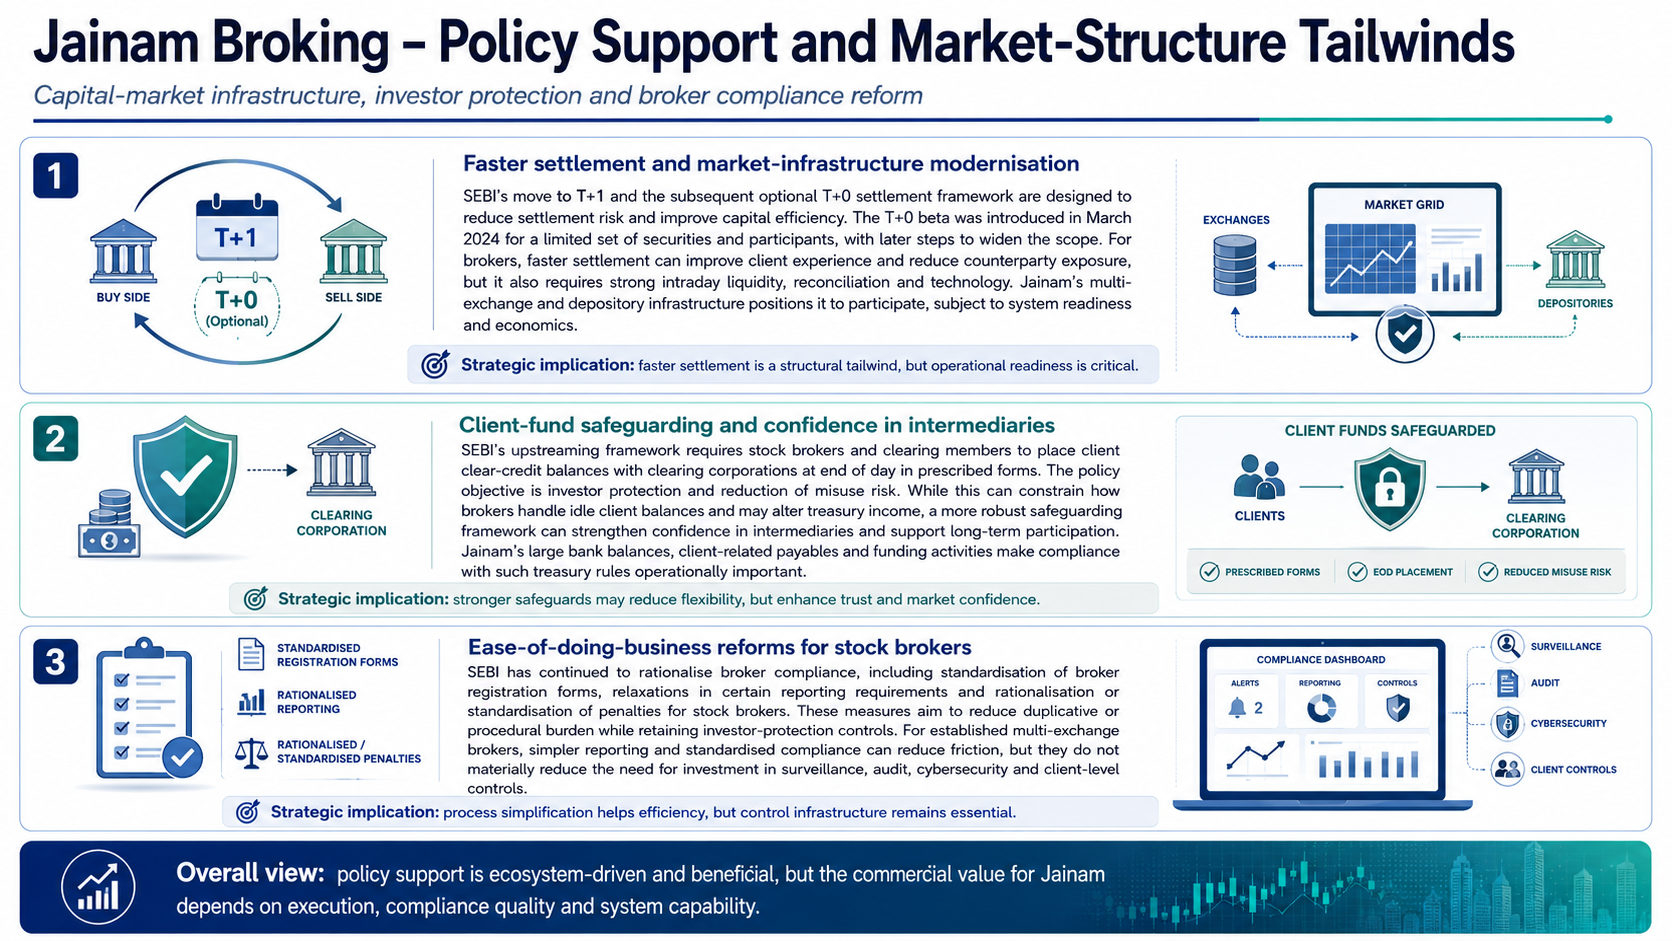
SEBI’s move to T+1 and the subsequent optional T+0 settlement framework are designed to reduce settlement risk and improve capital efficiency. The T+0 beta was introduced in March 2024 for a limited set of securities and participants, with later steps to widen the scope. For brokers, faster settlement can improve client experience and reduce counterparty exposure, but it also requires strong intraday liquidity, reconciliation and technology. Jainam’s multi-exchange and depository infrastructure positions it to participate, subject to system readiness and economics
SEBI’s upstreaming framework requires stock brokers and clearing members to place client clear-credit balances with clearing corporations at end of day in prescribed forms. The policy objective is investor protection and reduction of misuse risk. While this can constrain how brokers handle idle client balances and may alter treasury income, a more robust safeguarding framework can strengthen confidence in intermediaries and support long-term participation
SEBI has continued to rationalise broker compliance, including standardisation of broker registration forms, relaxations in certain reporting requirements and rationalisation / standardisation of penalties for stock brokers. These measures aim to reduce duplicative or procedural burden while retaining investor-protection controls. For established multi-exchange brokers, simpler reporting and standardised compliance can reduce friction, but they do not materially reduce the need for investment in surveillance, audit, cybersecurity and client-level controls
- Overview
- Business
- Financial Highlights
- Industry Overview
- Documentation
Get the Preqt App and keep in touch around the clock!
 Monitor your investments in real-time.
- Receive tailored deal suggestions.
- Get real-time updates and alerts.
