

Jio Platforms
Connecting India DigitallyBuilding Digital Ecosystems
IPO Summary (PrEqT)
Jio Platforms Limited is India's largest digital connectivity provider, with an extensive subscriber base, nationwide 5G infrastructure and an expanding digital services ecosystem. The company demonstrated strong financial performance, with FY26 revenue reaching INR 1,46,885.3 Cr, EBITDA of INR 76,255.4 Cr and PAT of INR 30,049.1 Cr, supported by tariff revisions, improving ARPU and increasing data consumption. Its EBITDA margin of 51.9% reflects strong operating profitability, while net leverage declined to 0.4x. However, the business remains highly capital-intensive, requiring sustained investment in network infrastructure, spectrum and technology.
Additionally, changes in asset depreciation assumptions contributed to reported profitability, warranting closer examination of earnings quality. At the upper price band of INR 1,119, the implied post-IPO valuation of approximately INR 10.3 lakh Cr translates into a P/E of 34.3x.
IPO Review Rating
Buy
MainboardConnecting Consumers and Businesses Through Integrated Digital Platforms
Jio Platforms presents a strong IPO proposition, supported by a combination of scale, market leadership, consistent double-digit revenue growth, EBITDA margins above 50%, strong operating cash generation and a low Debt/Equity ratio. Its 49.8% wireless broadband market share, more than 533 million customers, expanding fixed-broadband franchise and proprietary 5G and digital technology stack provide multiple long-term growth drivers beyond conventional mobile connectivity. The IPO structure is also favourable because it is entirely a fresh issue, with up to ₹27,500.0 Cr being used to reduce RJIL borrowings, while RIL does not sell any shares and retains approximately 64.5% ownership after the issue.
At the upper band, the valuation of approximately 34.3x FY26 earnings and 3.0x book value is not inexpensive, particularly given Jio's relatively modest 9.4% RoNW. However, the P/E is still at an approximately 18% discount to Bharti Airtel despite Jio's stronger broadband market share, higher EBITDA margins and lower leverage. The key risks are heavy telecom regulation, material dependence on Reliance Group entities, significant ongoing capital requirements and the very large post-issue market capitalisation, which may moderate the scope for rapid valuation re-rating. On balance, the company's business quality, financial profile, sector leadership, fresh-issue structure and reasonable relative valuation outweigh these concerns.
PARAMETER
WEIGHT
SCORE
KEY FACTORS
Financial Performance
40.0%
4.0/5
Jio demonstrates excellent financial quality, supported by double-digit revenue and earnings growth, 50% plus EBITDA margins, strong operating cash generation and low leverage. The principal financial limitation is relatively modest RoNW despite its improving trajectory
Show more
Detailed Analysis
Revenue increased from INR 1,09,558.1 Cr in FY24 to INR 1,28,218.4 Cr in FY25 and INR 1,46,885.3 Cr in FY26, representing a strong FY24-FY26 CAGR of approximately 15.8%. Q1 FY27 revenue also grew 11.8% YoY
EBITDA increased from INR 54,958.7 Cr in FY24 to INR 76,255.4 Cr in FY26, while EBITDA margin improved from 50.2% to 51.9%. Q1 FY27 margin expanded further to 53.3%, demonstrating strong operating leverage
PAT increased from INR 21,423.2 Cr in FY24 to INR 30,049.1 Cr in FY26, while PAT margin improved from 19.6% to 20.5%. Q1 FY27 PAT of ₹7,764.1 Cr indicates continued earnings growth
FY26 gross debt of INR 70,781.0 Cr against equity of INR 3,35,976.9 Cr implies a Debt/Equity ratio of approximately 0.2x
Return on Average Net Worth improved consistently from 8.0% in FY24 to 9.0% in FY25 and 9.4% in FY26. However, it remains considerably below Bharti Airtel's 20.3%, restricting a full score
Operating cash flow increased consistently from INR 57,661.6 Cr in FY24 to INR 68,155.7 Cr in FY25 and ₹77,556.3 Cr in FY26, providing strong cash support for capex, spectrum payments and debt servicing
Jio had 524.4 million customers at FY26-end and 533.3 million by June 2026, creating an exceptionally diversified consumer base. The business therefore does not face conventional single-customer revenue concentration risk
Industry
15.0%
3.0/5
Jio operates in a structurally attractive digital-connectivity ecosystem with strong mobile broadband, fixed broadband, 5G, cloud and AI growth opportunities. Its market leadership is exceptional, although regulation and predominantly domestic revenue exposure prevent a maximum score
Show more
Detailed Analysis
India's mobile-connectivity market is expected to increase from approximately INR 2.9 trillion in FY26 to INR 5.2 trillion by FY31, implying roughly 12.4% CAGR. Fixed broadband customers are projected to grow at an even stronger 18.9% CAGR
Traditional mobile connectivity is established, but 5G monetisation, fixed wireless access, home broadband, enterprise cloud, AI infrastructure and digital services remain structurally underpenetrated, providing multiple additional growth engines beyond conventional telecom services
Telecom remains heavily regulated through spectrum allocation, licensing, tariffs, net neutrality, cybersecurity, data protection and TRAI/DoT requirements. The strategic importance of connectivity also creates continuing policy and regulatory exposure
Management
15.0%
4.0/5
Governance is strong due to experienced leadership, 50% Board independence, substantial continuing RIL ownership and no OFS. The primary concern is Jio's significant operational and commercial dependence on related Reliance Group entities
Show more
Detailed Analysis
Jio benefits from the Reliance ecosystem and an experienced leadership team led by Mukesh Ambani, Akash Ambani, Mathew Oommen and other senior technology executives with extensive operating, digital infrastructure, telecom and capital-allocation experience
The Board comprises 10 directors, including five Independent Directors, representing 50.0% independent representation. This provides a strong formal governance structure alongside experienced non-executive and executive leadership
Jio Platforms itself has no disclosed criminal proceedings, regulatory actions or material civil litigation. However, various subsidiaries and promoter RIL are involved in regulatory, tax and other proceedings, requiring some deduction at group level
Related-party transactions are material because Jio relies on Reliance Group entities for infrastructure, distribution and other services. RPT expenses represented 9.3% of FY26 revenue, and Reliance Retail is the sole distributor for prepaid connectivity services
Valuation
20.0%
4.0/5
Jio's valuation is premium in absolute terms but attractive relative to Bharti Airtel, supported by superior scale, margins, growth and a strong balance sheet. Lower RoNW and the massive post-issue market capitalisation limit further valuation upside
Show more
Detailed Analysis
At the INR 1,119 upper price band, Jio Platforms is valued at approximately 34.3x FY26 earnings. This represents a 15.7% discount to Bharti Airtel’s 40.7x P/E, providing reasonable relative valuation comfort, although the absolute multiple remains premium
Jio Platforms is valued at approximately 13.5x FY26 EV/EBITDA, compared with 12.7x for Bharti Airtel and 15.0x for Vodafone Idea, implying a peer average of approximately 13.9x. Jio therefore trades at a modest 2.6% discount to the peer average, although it commands a 6.2% premium to Bharti Airtel and a 10.0% discount to Vodafone Idea
The upper price band implies approximately 3.0x FY26 NAV, reducing to roughly 2.8x on an illustrative post-issue basis before expenses. The multiple appears supportable given Jio's scale, profitability and infrastructure assets
FY26 Return on Average Net Worth was 9.4%, substantially below Bharti Airtel's 20.3%. Although Jio's return ratio is improving, it remains the most important weakness supporting a valuation deduction
Merchant Banker Track Record
10.0%
5.0/5
Jio has one of the strongest IPO banking syndicates possible in the Indian market, combining top domestic and global franchises with extensive institutional distribution capability. Historical aftermarket performance is broadly favourable, although not universally positive
Show more
Detailed Analysis
Historical RHP disclosures show generally favourable 30-day aftermarket outcomes across several major BRLMs, particularly Kotak, Morgan Stanley, Axis and Jefferies, although individual banker performance is not uniformly positive
A standardised banker-wise historical subscription dataset is not disclosed in a sufficiently comparable format in the RHP
The syndicate collectively has an exceptional record of executing large Mainboard IPOs, including several of India's largest and most institutionally distributed equity offerings
TOTAL
100%
4.0/5
Weighted Composite Score
Issue Price
₹1065.0 to ₹1119.0
As of 24 Oct 2026
GMP
₹221.0
As of 24 Oct 2026
Estimated Gain / Loss
+19.8%
Lot Size
12.0 Shares
Grey Market Premium (GMPs) are shared for knowledge purpose only. PrEqt doesn’t promote or execute the trades.
| Issue Size (in Cr) | |
|---|---|
| Overall | ₹30,213.0 Cr |
| Fresh Issue | ₹30,213.0 Cr |
| Offer for Sale | ₹0.0 Cr |
Minimum Investment
₹13,428.0 / 144 shares

Merchant Banker
Kotak Mahindra Capital Co.Ltd., Axis Capital, Jefferies, Goldman Sachs
Kotak Mahindra Capital Co.Ltd.
Axis Capital
Jefferies
Goldman Sachs
IPO Document
Offer Start Date
Offer End Date
Valuation
Revenue (FY'26)
PAT (FY'26)
Issue Size (in Cr)
Face Value
₹ 10.0Offer Price
₹ 1,119.0Lot Size
12.0 sharesSale Type
Fresh capital onlyPAT (FY'26)
₹ 30,049.1 CrPAT Margin (FY'26)
20.5 %P/E Multiple
34.3xEBITDA (FY'26)
₹ 76,255.4 CrCAGR Growth 2Y
15.8 %ROE (FY'26)
9.4 %ROCE (FY'26)
10.8 %Price to Book Value
2.8xDebt/Equity
0.2xCompany Website
www.jio.comExplore new deals
Overview
Fund Allocation
Total: ₹0 CrSource:Company DRHP
Timeline
IPO Open Date
To Be Announced
IPO Close Date
To Be Announced
Tentative Allotment
To Be Announced
Initiation of Refunds
To Be Announced
Credit of Shares to Demat
To Be Announced
Tentative Listing Date
To Be Announced
Business
Business Model
Geographical Presence
Sales Channel
Key Risk Factor
Financial Highlights
Income Statement
Revenue growth with EBITDA and PAT margins
| Financial Metric | FY 2024 | FY 2025 | FY 2026 |
|---|---|---|---|
| Revenue (₹ Cr) | 1,09,558.1 | 1,28,218.4 | 1,28,218.4 |
| Growth (%) | - | 17.0% | 14.6% |
| EBITDA (₹ Cr) | 54,958.7 | 64,170.0 | 76,255.4 |
| EBITDA Margin (%) | 50.2% | 50.0% | 51.9% |
| PAT (₹ Cr) | 21,423.2 | 26,109.0 | 30,049.1 |
| PAT Margin (%) | 19.6% | 20.4% | 20.5% |
OBSERVATIONS & INSIGHTS
Revenue increased 17.0% from INR 109,558.1 Cr in FY24 to INR 128,218.4 Cr in FY25 as an industry-wide tariff increase, increased customer engagement and higher data consumption lifted ARPU from INR 181.7 to INR 206.2 in the exit quarters. Revenue rose a further 14.6% to INR 146,885.3 Cr in FY26 due to customer growth from 488.2 million to 524.4 million and ARPU rising to INR 214.0, supported by greater 5G and broadband penetration
EBITDA increased from ₹54,958.7 Cr in FY24 to INR 64,170.0 Cr in FY25 and INR 76,255.4 Cr in FY26. The improvement reflected faster revenue growth than network operating costs, although other operating expenses, content and distribution costs rose. EBITDA margin moved from 50.2% to 50.1% and then 51.9%; FY25 margin was broadly stable because costs absorbed most of the growth, while FY26 benefited from better operating leverage
PAT rose from INR 21,423.2 Cr in FY24 to INR 26,109.0 Cr in FY25 as tariff-led revenue gains and operating profitability outweighed higher depreciation, finance and tax expenses. FY26 PAT increased to INR 30,049.1 Cr, as higher EBITDA and interest income offset a 76.4% increase in finance costs and higher depreciation. The FY26 gain also included the INR 1,840.5 Cr benefit to PBT from the revised useful lives of certain network assets relative to the RHP counterfactual
Balance Sheet
| Financial Metric | FY 2024 | FY 2025 | FY 2026 |
|---|---|---|---|
| Net Worth | ₹ 2,77,866.1 Cr | ₹ 3,04,022.4 Cr | ₹ 3,34,013.4 Cr |
| Total Assets | ₹ 5,39,580.4 Cr | ₹ 5,81,233.8 Cr | ₹ 6,15,594.0 Cr |
| Total Borrowing | ₹ 54,348.9 Cr | ₹ 73,060.3 Cr | ₹ 70,781.0 Cr |
OBSERVATIONS & INSIGHTS
Consolidated assets increased from INR 539,580.4 Cr in FY24 to INR 581,233.8 Cr in FY25 and INR 615,594.0 Cr in FY26. The additions were driven by network plant, the transfer of completed spectrum and other projects into service, software intangibles, and growing liquid investments
RHP-defined net worth, which excludes other comprehensive income, increased from INR 277,866.1 Cr to INR 304,022.4 Cr and INR 334,013.4 Cr, as accumulated profit was retained
Borrowings increased from INR 54,348.9 Cr in FY24 to INR 73,060.3 Cr in FY25, largely as current borrowings expanded. They decreased to INR 70,781.0 Cr in FY26 as current borrowings declined, partly offset by an increase in non-current borrowings
Cash Flow
| Financial Metric | FY 2024 | FY 2025 | FY 2026 |
|---|---|---|---|
CFO (₹ Cr) Cash generated from core business operations. | +57,661.6 Cr | +68,155.7 Cr | +77,556.3 Cr |
CFI (₹ Cr) Cash used for investments and long-term assets. | -56,587.6 Cr | -63,726.4 Cr | -43,590.9 Cr |
CFF (₹ Cr) Cash flow related to funding and borrowings. | +379.3 Cr | +1,093.3 Cr | -25,419.0 Cr |
Working Capital
| Efficiency Metric | FY 2023 | FY 2024 | FY 2025 |
|---|---|---|---|
Debtor Days Average number of days taken to collect customer payments. | - | - | - |
Creditor Days Average time taken to pay suppliers and vendors. | - | - | - |
Inventory Days Average number of days inventory remains unsold. | - | - | - |
CCC (Cash Conversion Cycle) (Debtor Days + Inventory Days - Creditor Days) | - | - | - |
Financial Ratios
Measures the company’s leverage relative to shareholder equity.
OBSERVATIONS & INSIGHTS
ROE improved from 8.0% in FY24 to 9.0% in FY25 and 9.4% in FY26 because profit attributable to shareholders increased faster than average RHP-defined net worth
Issuer-defined ROCE fell from 12.8% in FY24 to 12.5% in FY25 and 10.8% in FY26 despite higher operating earnings. The average deployed capital base rose substantially as assets moved into service, including spectrum and 5G infrastructure
The Debt/Equity ratio remained minimal at around 0.2x across the 3 presented years
Interest Coverage was 8.1x in FY24, 8.2x in FY25 and 5.7x in FY26. Coverage was stable in FY25 as EBIT grew broadly alongside finance expense, but declined in FY26 after higher interest recognition on 5G-related liabilities and leases outpaced EBIT growth
Current ratio improved from 0.5x in FY24 to 0.7x in FY25 and 1.1x in FY26. FY25 investment and cash balances rose while current liabilities also increased; in FY26 cash and current investments increased further and current borrowings decreased, improving coverage of current liabilities. The ratio remains sensitive to investments readily convertible into cash
ROA increased from 4.7% in FY25 to 5.0% in FY26 because profit growth was faster than growth in average consolidated assets. The FY24 value is not shown on the same average-balance basis, avoiding a non-comparable series
Industry Overview
Industry Drivers
Mobile Broadband Adoption, Usage and Higher Revenue per Customer
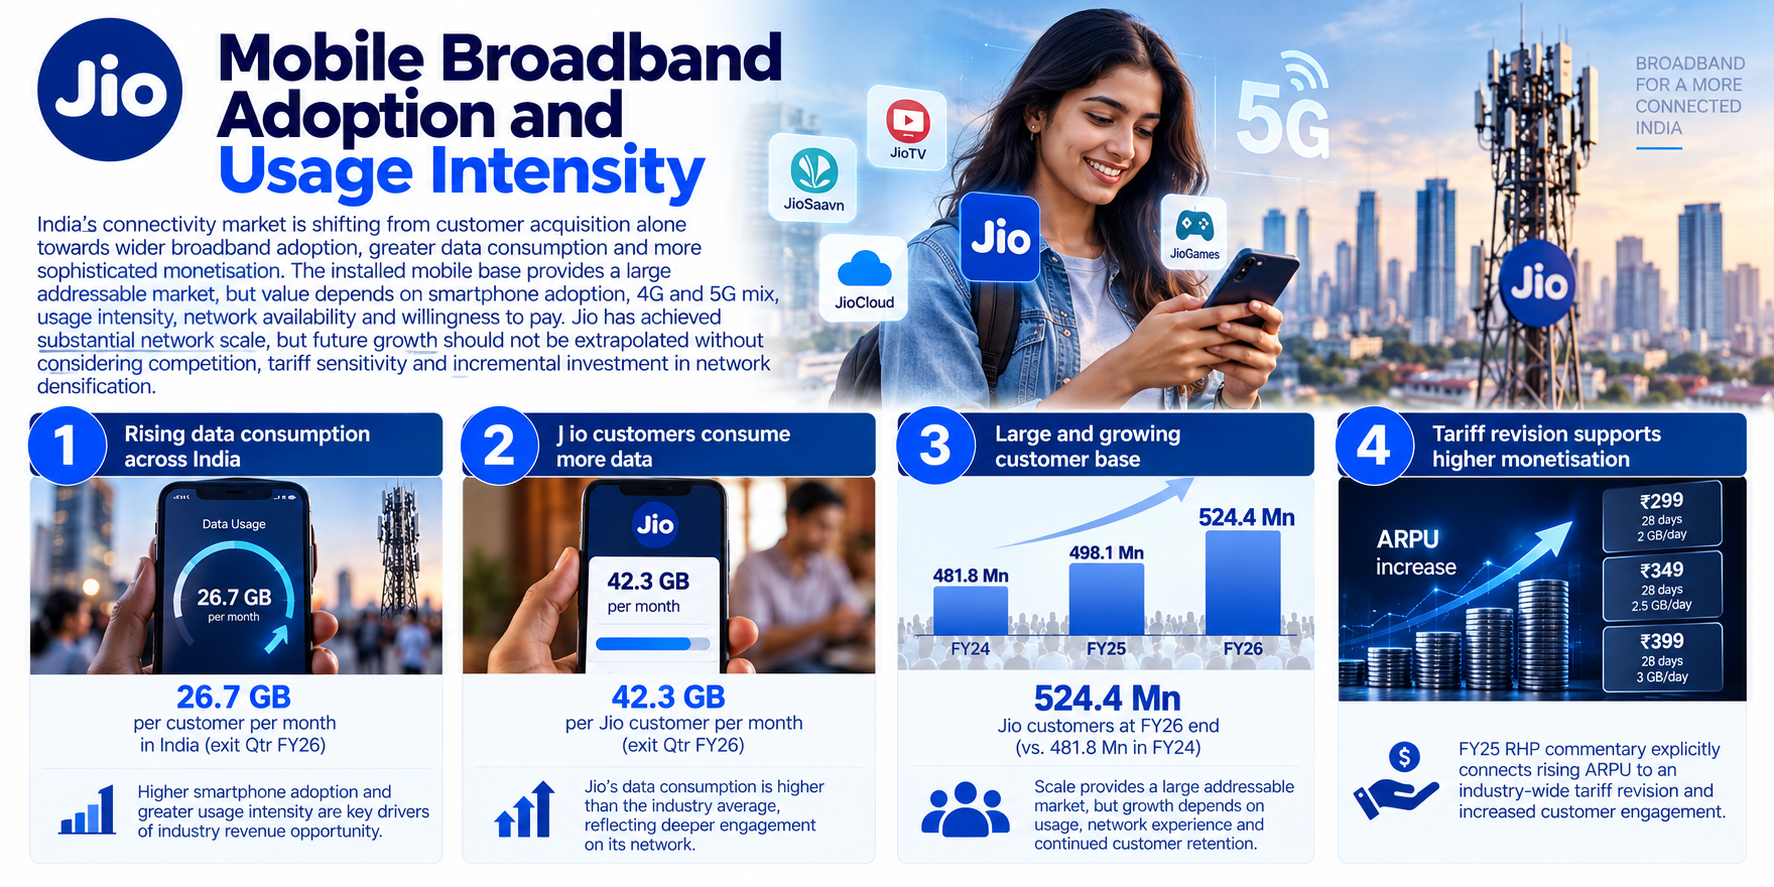
The mobile market is undergoing a structural shift from basic voice and legacy mobile connections towards 4G and 5G broadband access. The next stage of growth is expected to combine conversion of existing non-broadband customers, greater rural penetration, increased smartphone availability and rising monthly data usage. Industry economics are also moving beyond simply adding SIM connections towards average revenue per user, network quality and uptake of higher-value service plans. India remains a price-sensitive market, so the study does not imply that higher tariffs can always be passed through without churn. The expansion in digital payments, streaming, online learning and business communications increases the utility of reliable mobile data, while the availability of entry-level devices affects how rapidly underserved users can migrate. The resulting market opportunity should be assessed using subscriptions, utilisation and revenue per user together rather than assuming that data-traffic growth automatically produces equivalent revenue growth.
The key drivers are:
Market value: Analysys Mason estimates Indian mobile connectivity spending at INR 290,000.0 Cr in FY26 and projects INR 520,000.0 Cr by FY31. The mobile broadband component is projected to grow from INR 230,000.0 Cr to INR 510,000.0 Cr across the same period
Broadband conversion: India had 1,002.3 million mobile broadband customers in March 2026 and 1,021.4 million in June 2026. The study forecasts 1,339.4 million by FY31, while approximately 261.0 million customers still used non-broadband mobile connections in June 2026
Usage and monetisation: Monthly data consumption per wireless data subscriber was 26.7 GB in the FY26 exit quarter and is projected to reach 59.2 GB by FY31. Monthly mobile broadband ARPU is forecast to increase from INR 199.5 in FY26 to INR 326.4 by FY31
Access gap and devices: Urban mobile broadband penetration exceeded 110.0% in March 2026, compared with approximately 45.0% in rural India. Smartphone users accounted for approximately 80.0% to 85.0% of mobile customers by the first quarter of FY27, versus 20.0% to 25.0% in FY16
Household Fibre Broadband and Fixed Wireless Access Expansion
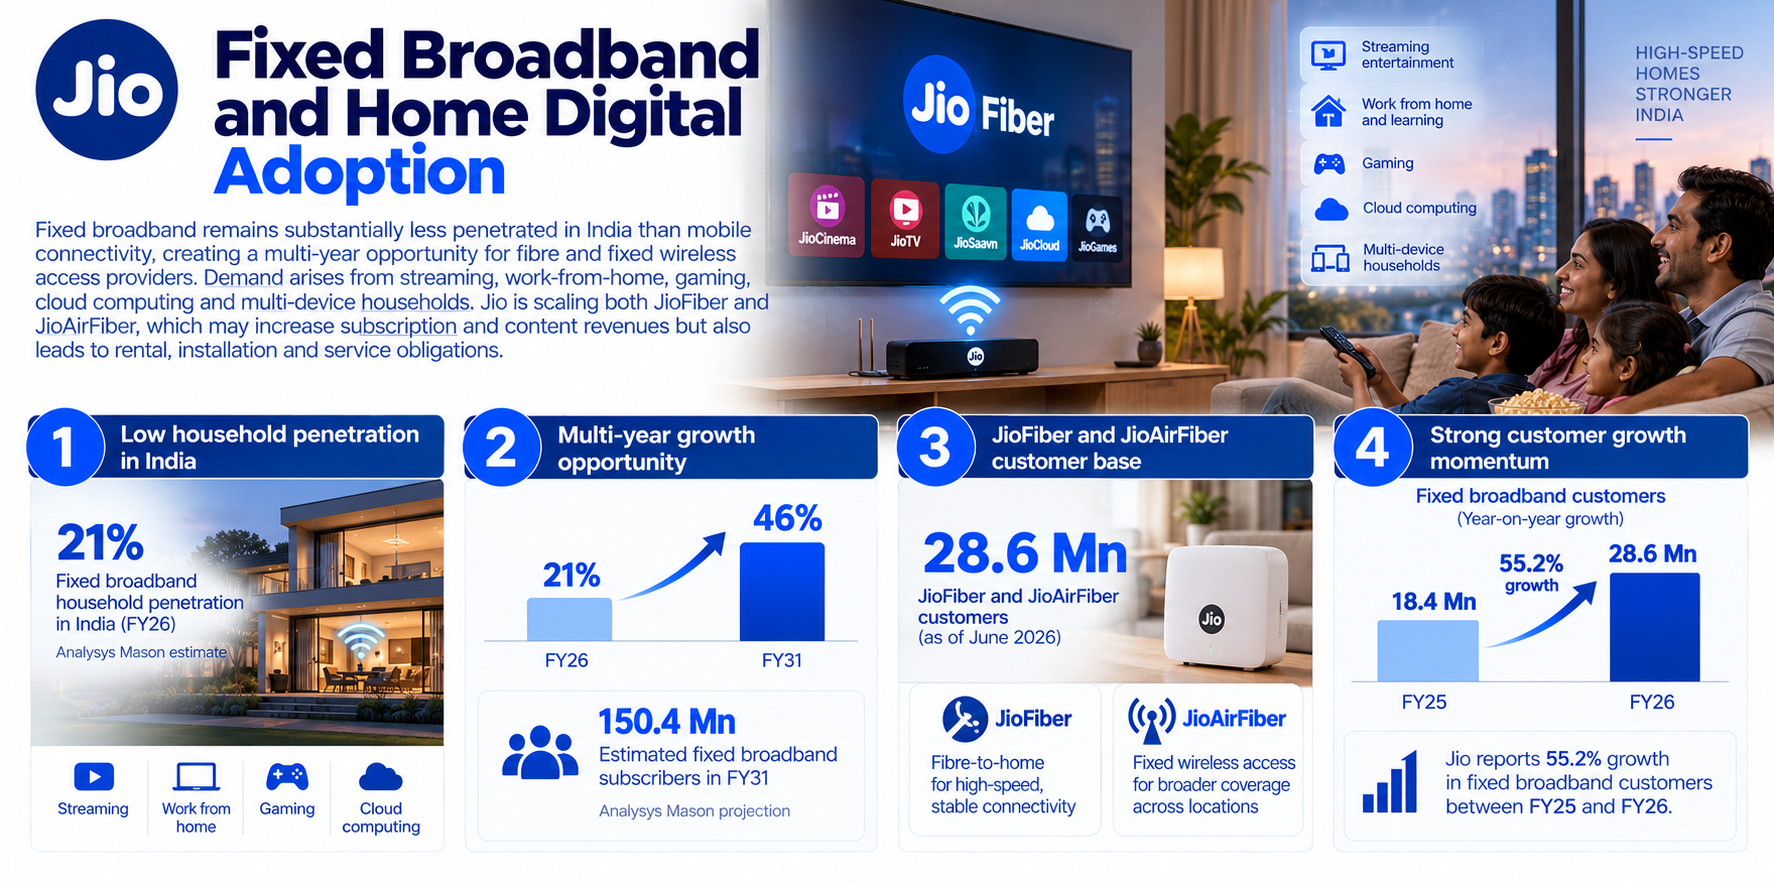
Fixed broadband remains materially underpenetrated compared with mobile data, leaving a large addressable market for high-speed household connectivity. Fibre networks support reliable, high-capacity connections in dense areas, while fixed wireless access can shorten the time required to reach locations where last-mile fibre construction is expensive or delayed. Growth in connected televisions, multiple-device households, streaming, remote work, cloud gaming and home security is increasing bandwidth requirements. However, access economics differ significantly between dense cities and dispersed rural communities because installation cost, network backhaul, customer equipment and household affordability are not uniform. Fixed wireless technology can reduce some deployment frictions but still depends on spectrum capacity, backhaul and sustainable subscriber revenue. Accordingly, the industry forecasts should be read alongside coverage limitations and the ability of service providers to deploy networks economically rather than as guaranteed demand.
The key drivers are:
Market size: The fixed broadband market is forecast to expand from between INR 34,000.0 Cr and INR 35,000.0 Cr in FY26 to between INR 92,000.0 Cr and INR 93,000.0 Cr by FY31, according to Analysys Mason
Subscription opportunity: Total fixed broadband subscriptions increased from 19.7 million in FY19 to 66.1 million in June 2026. The study projects 150.4 million by FY31, equivalent to an estimated 18.9% CAGR from the first quarter of FY27
Underpenetrated households: Overall household fixed broadband penetration was approximately 21.0% in the first quarter of FY27, with urban penetration near 43.0% and rural penetration near 7.0%. The number of households assessed as able to afford fixed broadband is forecast to increase from 137.0 million in FY26 to 201.0 million in FY31
Technology transition: Of 14.2 million fixed broadband net additions in FY26, 9.8 million used fixed wireless access. As of FY26, fibre-to-the-premises and related FTTx accounted for 69.1% of fixed broadband subscriptions, while 5G and unlicensed-band-radio fixed wireless access represented 26.1%
Enterprise Digitalisation, Business Software and IoT Adoption
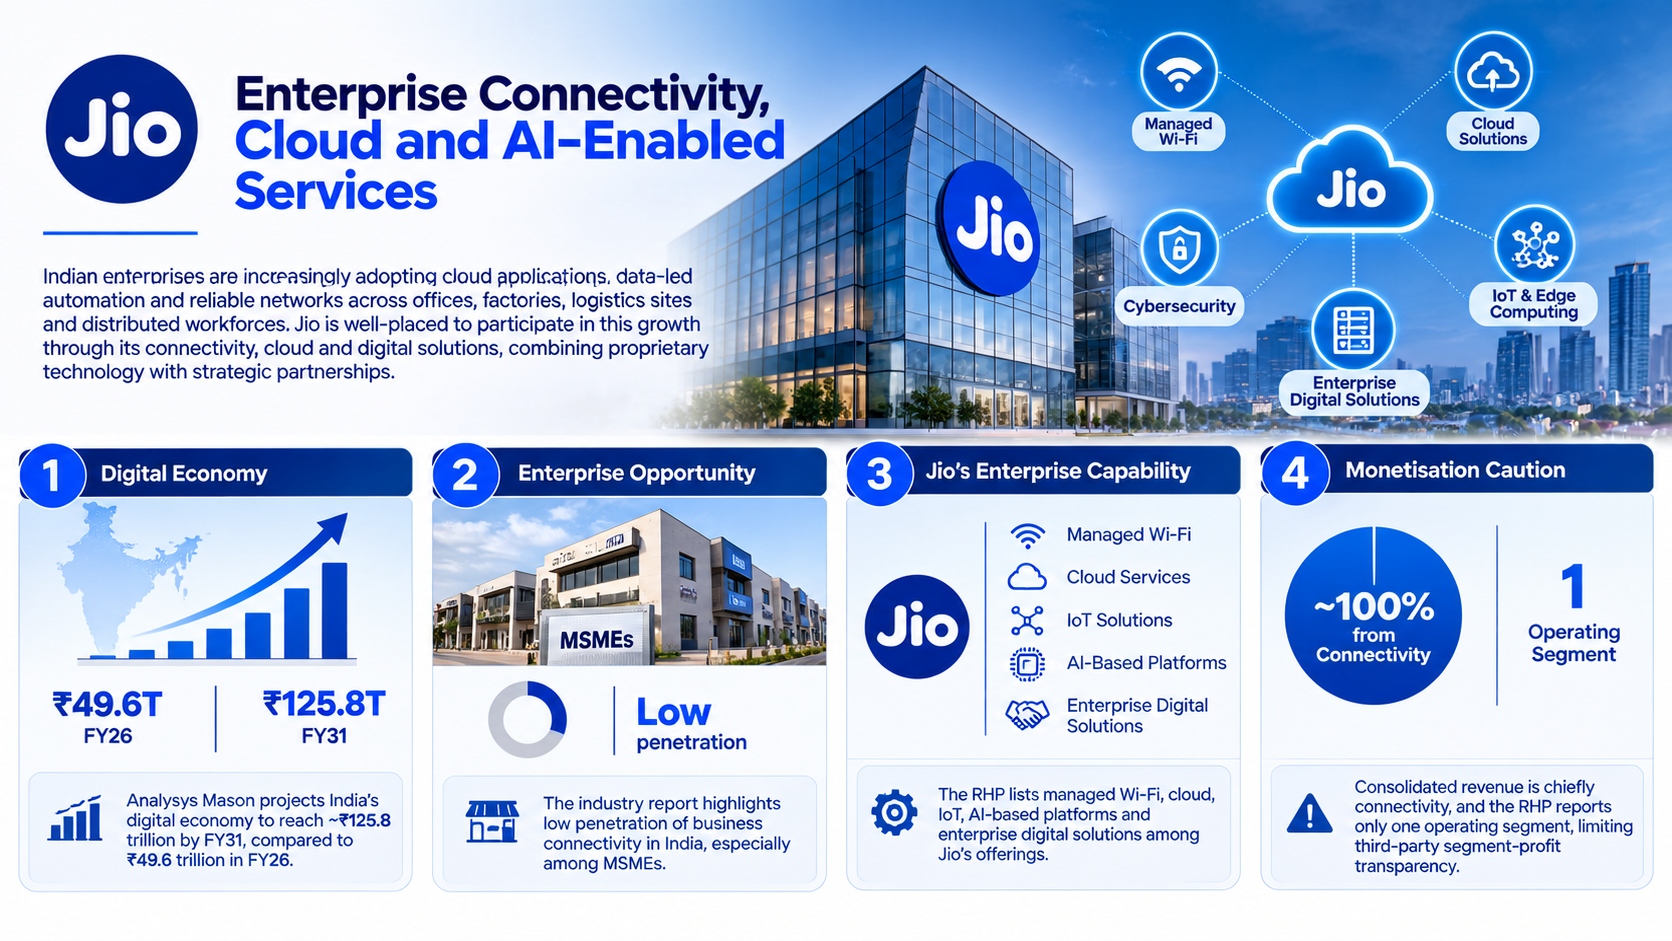
Enterprise technology spending represents a separate growth engine built on cloud infrastructure, business applications, unified communications, managed networks, cybersecurity and industrial connectivity. Large Indian enterprises have already digitised many core functions, but the small and medium-sized business market remains materially less penetrated. As organisations expand online customer acquisition, payments, compliance reporting and distributed operations, demand increases for reliable connectivity combined with integrated software and security. The study identifies business applications, enterprise communications and Internet of Things solutions among the faster-growing addressable segments. These services can carry higher functionality and pricing than basic connectivity, but the economics depend on product adoption, customer retention, implementation capability and the ability to compete with established software vendors. Market forecasts in these segments should therefore be treated as broad opportunities for the technology and communications ecosystem, not as a forecast of digital-platform margins or revenue at any particular listed company.
The key drivers are:
Enterprise addressable market: The study estimates relevant Indian enterprise digital-services spending at INR 512,000.0 Cr in FY26, or approximately 1.5% of GDP, compared with a stated 3.0% to 5.0% spending range in several more mature digital economies
Business applications and cybersecurity: The business applications and solutions market is projected to increase from INR 150,000.0 Cr in FY26 to INR 430,000.0 Cr in FY31, at an estimated 23.0% CAGR. The FY26 cybersecurity component is estimated at INR 30,700.0 Cr.
Enterprise communications: Industry revenue is forecast to grow from INR 54,200.0 Cr in FY26 to INR 122,000.0 Cr in FY31 at an estimated 18.0% CAGR, including customer messaging, communications platforms and integrated collaboration tools
IoT and SME penetration: Enterprise IoT solutions are forecast to rise from INR 22,500.0 Cr to INR 42,200.0 Cr from FY26 to FY31. The study estimates digital-service adoption at approximately 75.0% to 90.0% among large enterprises but below 3.0% among SMEs, highlighting uneven market maturity
Risks in the Industry
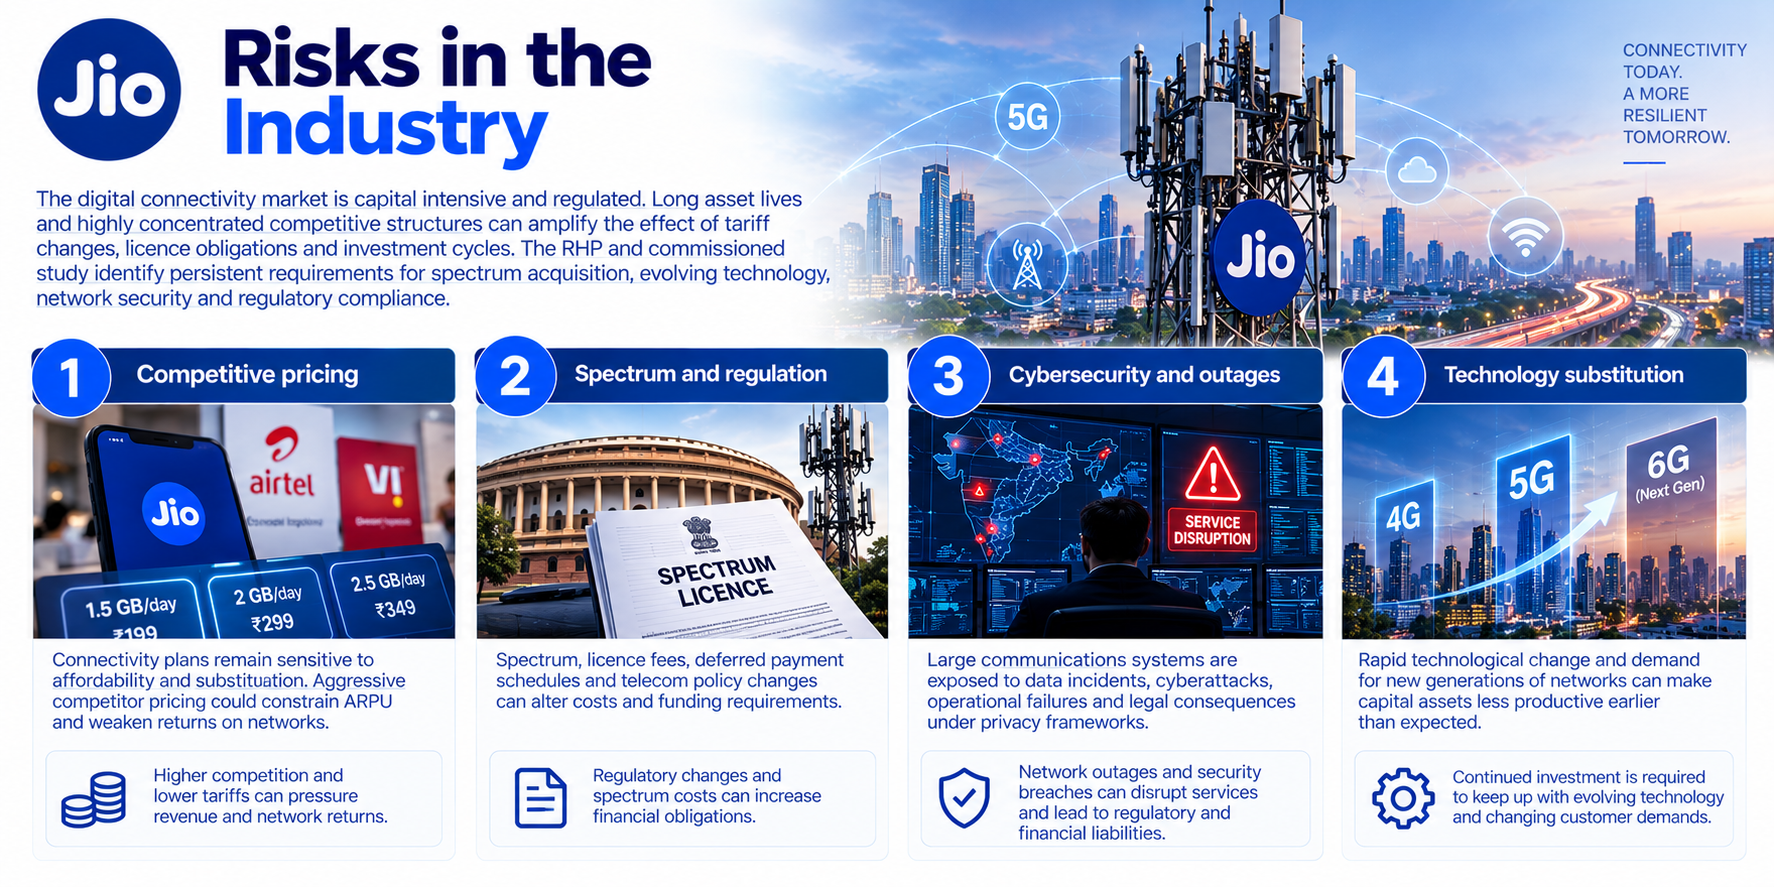
Despite expanding connectivity demand, the sector faces material industry-wide challenges from tariff sensitivity, network investment, aggressive competition, cybersecurity exposure and shifting regulation. High subscriber numbers and data usage alone do not guarantee attractive returns because operators must sustain service quality while funding spectrum, fibre, radio equipment, software and customer support. Digital services introduce different cost structures and competitors, including large global technology providers. Rising reliance on connected networks also broadens the consequences of outages or cybersecurity incidents. The four industry risks below are based on Analysys Mason’s threats and challenges assessment and the general regulatory risks described in the RHP. Their numerical illustrations describe the sector as a whole and do not assert that a specific operator incurred a loss, suffered a data breach or failed to comply with a regulation.
The key risks are:
Tariff sensitivity and pressure on monetisation: The industry’s revenue realisation was approximately INR 7.5 per GB in the FY26 exit quarter, compared with INR 33.4 per GB in China and INR 228.4 per GB in the United States, according to the study. The forecast increase in industry mobile broadband ARPU from INR 199.5 to INR 326.4 per month by FY31 assumes continued monetisation, but tariff increases can prompt churn, downgrades and reduced usage among price-sensitive customers
Capital intensity and rapid technology renewal: Monthly wireless data consumption is forecast to increase from 26.7 GB in FY26 to 59.2 GB by FY31, requiring additional spectrum capacity, radio equipment, fibre backhaul and network optimisation. Mobile download speeds rose from approximately 2.5 Mbps in January 2016 to more than 68.0 Mbps in December 2025, illustrating how quickly network performance requirements have changed. Operators may need to replace or upgrade equipment before the expected financial return on earlier investment has been fully realised
Concentrated competition and unequal access economics: India had four major mobile operators in June 2026, with the leading three representing more than 97.0% of mobile broadband subscriptions. Competition over service quality, retention and tariffs can still be severe within this concentrated structure. At the same time, rural mobile broadband penetration of approximately 45.0%, compared with more than 110.0% in urban areas, and rural fixed broadband penetration of approximately 7.0%, compared with 43.0% in urban areas, create risks that deployment costs may be recovered more slowly in underserved regions
Cybersecurity, privacy and regulatory compliance: The expansion of digital transactions from approximately 23.0 billion in FY19 to 282.0 billion in FY26 increases the volume of activity depending on secure and reliable digital networks. The study values the FY26 cybersecurity solutions market at INR 30,700.0 Cr, demonstrating the scale of business investment in protection, although this does not measure cyberattack losses. Telecom licensing, service quality, customer verification, privacy obligations and spectrum pricing changes can raise compliance expenditure and constrain service offerings across the sector
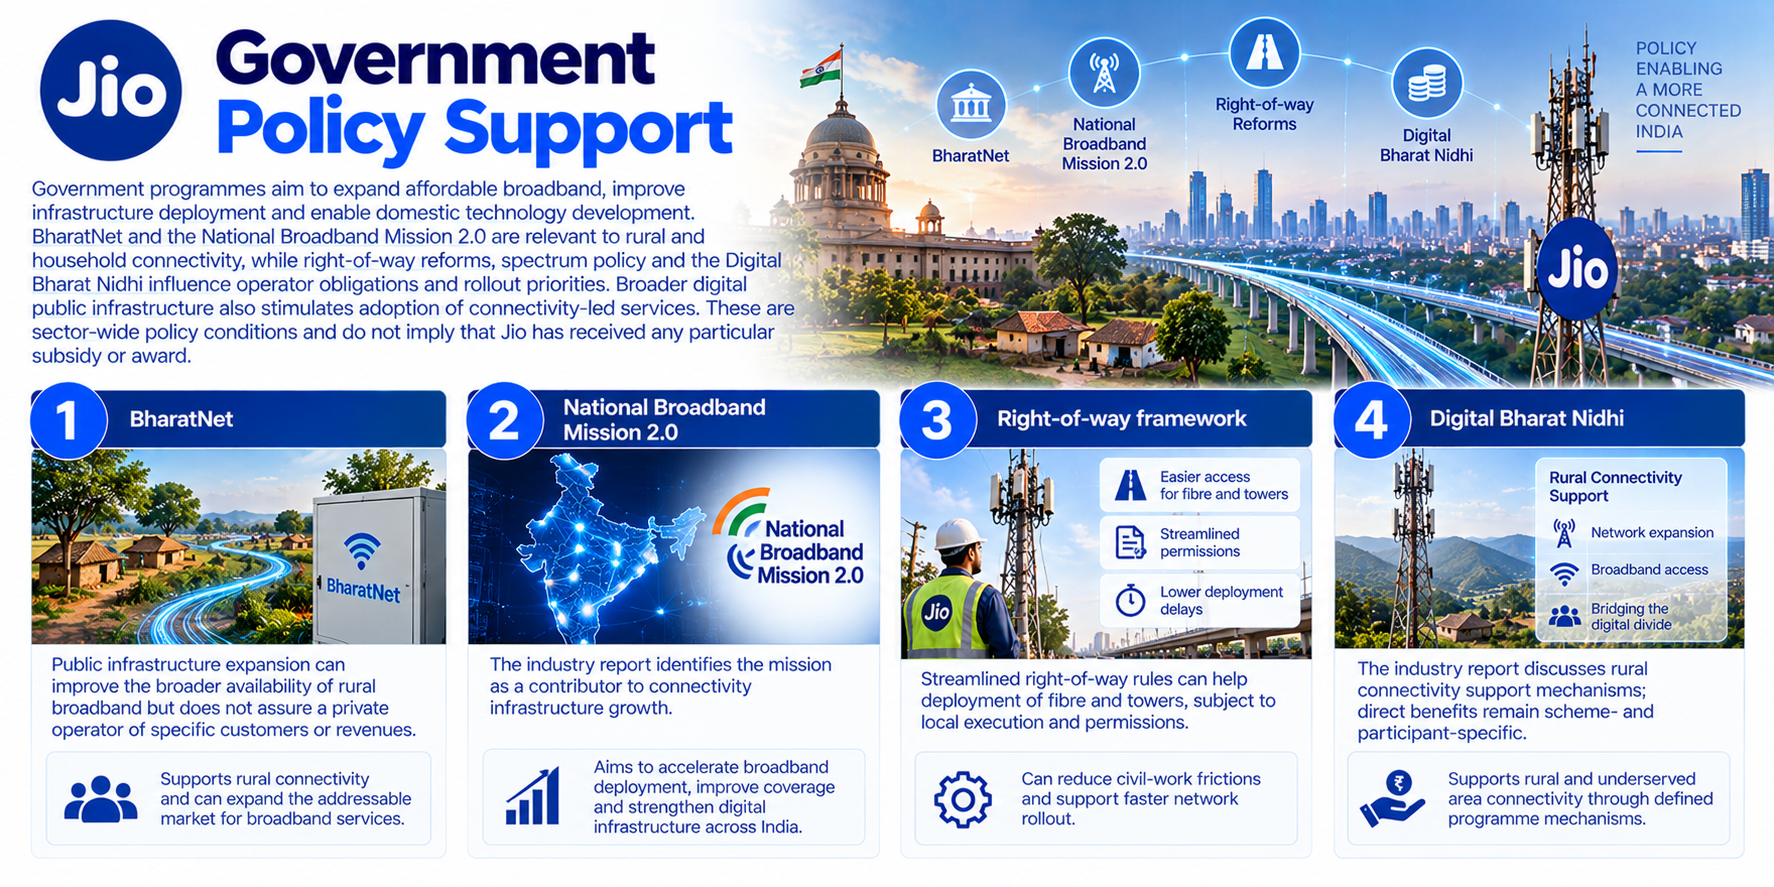
Government Policy Support
India’s policy framework seeks to deepen broadband coverage, strengthen infrastructure access, improve spectrum administration and support digital inclusion. These measures matter because market coverage remains uneven: rural mobile broadband penetration was approximately 45.0% in March 2026, and rural fixed broadband penetration was approximately 7.0% in the first quarter of FY27, according to the industry study. Government initiatives may reduce some barriers to fibre deployment and rural access, but they do not guarantee subscriber acquisition, operator-specific subsidies, spectrum availability or profitability. Policy support is also conditional on the applicable rules, licences, authorisations and implementation by central and local authorities. The four factors below identify the policy mechanism, the relevant industry gap and the documented legal or programme status, separating existing measures from future market forecasts.
The key policies are:
National Broadband Mission 2.0: The industry study identifies the mission as a policy framework for expanding broadband connectivity and addressing last-mile infrastructure constraints. Its relevance is illustrated by the approximately 21.0% overall fixed broadband household penetration in the first quarter of FY27 and an estimated 150.4 million fixed broadband subscriptions by FY31. The latter is an industry forecast rather than an official mission target or a guaranteed policy outcome
BharatNet and Digital Bharat Nidhi: BharatNet supports rural broadband infrastructure, while the Digital Bharat Nidhi provides a framework for eligible connectivity initiatives under the Telecommunications (Administration of Digital Bharat Nidhi) Rules, 2024. The policy challenge remains significant, with approximately 261.0 million mobile customers using non-broadband connections in June 2026 and rural mobile broadband penetration at approximately 45.0%. The cited documents do not establish a direct grant or subsidy amount payable to any particular listed operator
Telecommunications Act, 2023 and Right of Way Rules, 2024: The Telecom Act came into force in phases beginning in June 2024, and the Telecommunications (Right of Way) Rules, 2024 became effective on 1 January 2025. Under the RHP’s description, public entities must process qualifying right-of-way applications for underground telecom infrastructure within 45 days, subject to the statutory framework. Streamlined rights of way can support fibre and tower deployment, although permissions, property rights and local execution remain constraints
Spectrum administration, auction policy and licence economics: The industry report identifies structured spectrum auctions and qualifying spectrum usage charge reforms as policy elements intended to improve investment conditions for 4G and 5G networks. The Telecommunications Act, 2023 provides for auctions as the principal assignment mechanism and administrative assignment in specified cases. However, the RHP states that Sections 4 and 5 relating to spectrum assignment had not yet been notified as of the RHP date, so their full implementation should not be assumed. The mobile connectivity market forecast of INR 290,000.0 Cr in FY26 to INR 520,000.0 Cr in FY31 remains a sector estimate, not a policy revenue target
Fundraise/Future Plans
Shareholding
Pre-issue shareholding
Promoter Holding 0.0%
Post-Issue Shareholding
Promoter Holding 0.0%
Category
Pre-Issue%Post-Issue%
Promoters
Reliance Industries Ltd.
66.4%64.5%
Total Promoter Holding
66.4%64.5%
Additional Shareholders
Jaadhu Holdings LLC, Meta affiliate
10.0%9.7%
Google International LLC
7.7%7.5%
Omicron Asia Holdings II, KKR affiliate
2.3%2.2%
VEPF VII AIV I, Vista affiliate
2.3%2.2%
SLP Redwood Holdings, Silver Lake affiliate
1.9%1.8%
MIC Redwood 1 RSC, Mubadala affiliate
1.9%1.8%
General Atlantic Singapore JP
1.3%1.3%
Public Investment Fund
2.3%2.2%
Platinum Jasmine A 2018 Trust, ADIA affiliate
1.2%1.1%
Other Shareholers
2.7%5.7%
Total Additional Holding
33.6%35.5%
Total Shareholding
100.0%100.0%
- Overview
- Business
- Financial Highlights
- Industry Overview
- Fundraise/Future Plans
- Documentation
Get the Preqt App and keep in touch around the clock!
 Monitor your investments in real-time.
- Receive tailored deal suggestions.
- Get real-time updates and alerts.