


Kanohar Electricals
Powering Grid ReliabilityEngineering Energy Infrastructure
IPO Summary (PrEqT)
Kanohar Electricals Limited is a long-established power-equipment manufacturer with operations spanning power, traction and Scott-connected transformers, shunt reactors, high voltage gas-insulated switchgear (GIS) and turnkey transmission/substation EPC. The Company operates two owned manufacturing facilities in Meerut, had transformer capacity of 19,200 MVA in FY26 and is one of five Indian manufacturers with short-circuit certification for 500 MVA 400 kV transformers. FY26 order book reached INR 1,818.3 Cr, approximately 2.8x FY26 revenue, providing strong near-term execution visibility. Financial momentum is strong, but cash conversion and concentration require close monitoring. FY26 revenue grew 45.1% to INR 653.8 Cr, EBITDA margin expanded to 27.6% and PAT reached INR 129.7 Cr; ROE was 42.1%, ROCE 70.1% and gross D/E only 0.1x. However, FY26 CFO was INR 25.8 Cr versus PAT of INR 129.7 Cr, debtor days were 114 and net working-capital days 107. At INR 601-INR 632, P/E is 38.6x. The transaction is OFS-heavy at the cap: approximately 71.6% OFS and 28.4% fresh issue, although the INR 300.0 Cr fresh proceeds are intended mainly for incremental working capital and capacity/efficiency capex rather than balance-sheet repair.
IPO Review Rating
Strong Buy
MainboardBuilding High-Voltage Infrastructure with Engineering Precision and Reliability
Kanohar Electricals has demonstrated strong operating momentum, with Revenue increasing from INR 276.7 Cr in FY24 to INR 653.8 Cr in FY26, while EBITDA increased from INR 31.1 Cr to INR 180.4 Cr and PAT increased from INR 17.8 Cr to INR 129.7 Cr over the same period. The balance sheet remains comfortable, with FY26 D/E of approximately 0.1x, while ROE of 42.1% and ROCE of 70.1% indicate strong capital efficiency. The Company also has an order book of approximately INR 1,818.3 Cr, equivalent to nearly 2.8x FY26 Revenue, providing healthy medium-term revenue visibility across power transmission, railway and other electrical infrastructure projects. The principal operating risk is customer concentration, with the Top-10 customers contributing approximately 93.2% of FY26 Revenue and the largest customer alone contributing 31.3%. Government-awarded tenders also account for approximately 85.4% of FY26 Revenue, creating dependence on public-sector ordering cycles and tender execution. At the upper price band of INR 632.0, the Company is valued at approximately P/E of 38.6x. Overall, Kanohar Electricals presents a strong combination of high earnings growth, expanding margins, low leverage, specialised technical capabilities and a sizeable order book.
PARAMETER
WEIGHT
SCORE
KEY FACTORS
Financial Performance
40.0%
5.0/5
Strong growth, margins, returns and low leverage; cash flow remains positive, while customer concentration is the key financial monitorable.
Show more
Detailed Analysis
FY24–FY26 revenue CAGR is 53.7%
FY26 EBITDA margin is 27.6%
FY26 PAT margin is 19.6%
FY26 D/E is 0.1x, indicating very low leverage
FY26 ROE is 42.1%
Operating cash flow was positive in both FY25 and FY26 at INR 79.4 Cr and INR 25.8 Cr, respectively
Largest customer contributed 31.3% of FY26 revenue
Industry
15.0%
3.0/5
Moderate headline industry growth but strong structural demand drivers, high technical entry barriers and favourable long-term power-infrastructure spending.
Show more
Detailed Analysis
Indian power-transformer market is projected to grow at 8.4% CAGR from CY25 to CY30
Transformer demand is in a growth phase, supported by transmission expansion, renewables and railway electrification
Policy environment is favourable, while mandatory testing and vendor approvals create entry barriers for new manufacturers
Management
15.0%
4.0/5
Highly experienced promoter group, clean pledge position and low latest-year RPTs; large promoter OFS is the principal concern.
Show more
Detailed Analysis
Promoter leadership has 40+ years of transformer-industry experience along with prior listed-company board experience
4 of 8 directors are independent, representing 50.0% of the Board
Promoter shares are unpledged and no material litigation is disclosed against the Promoters
FY26 related-party transactions were INR 18.1 Cr, equivalent to 2.8% of revenue
OFS represents 71.6% of the IPO, indicating heavy promoter monetisation
Valuation
20.0%
4.0/5
Large discount to expensive peer averages and strong RoNW; P/B above 12x and a predominantly OFS issue remain key valuation concerns.
Show more
Detailed Analysis
At INR 632.0, FY26 P/E is 38.6x versus peer average of 107.1x, representing a 63.9% discount
Estimated FY26 EV/EBITDA is ~28.0x versus peer average of 82.6x; peer/company multiple ratio is ~3.0x
Cap price divided by FY26 NAV of INR 50.1 gives a P/B of 12.6x
FY26 RoNW is 34.8%
Merchant Banker Track Record
10.0%
4.0/5
Strong institutional BRLM franchise and subscription track record; recent listing outcomes have been positive but not consistently exceptional.
Show more
Detailed Analysis
Recent disclosed BRLM IPO cohort generated an average listing return of approximately 6.9%
Recent representative IPOs handled by the BRLMs recorded average subscription of approximately 53.0x
Approximately 55.0% of the reviewed recent IPO cohort recorded positive listing performance
Nuvama Wealth Management and IIFL Capital Services are established Tier-1 mainboard BRLMs
TOTAL
100%
4.3/5
Weighted Composite Score
Issue Price
₹601.0 to ₹632.0
As of 4 Sep 2026
GMP
₹205.0
As of 4 Sep 2026
Estimated Gain / Loss
+32.4%
Lot Size
23.0 Shares
Grey Market Premium (GMPs) are shared for knowledge purpose only. PrEqt doesn’t promote or execute the trades.
| Issue size | |
|---|---|
| Overall | ₹1,056.0 Cr |
| Fresh Issue | ₹300.0 Cr |
| Offer for Sale | ₹756.0 Cr |
Minimum Investment
₹14,536.0 / 529 shares

Merchant Banker
Nuvama Wealth Management Ltd.; IIFL Capital Service
IPO Document
RHP / Anchor Document
Offer Start Date
8th Sept 2026
Offer End Date
10th Sept 2026
Valuation
₹5,004.6 Cr
Revenue (FY'26)
₹662.9 Cr
PAT (FY'26)
₹129.7 Cr
Issue Size
₹1,056.0 Cr
Face Value
₹ 2.0Offer Price
₹ 632.0Lot Size
23.0 sharesSale Type
Fresh capital cum OFSPAT (FY'26)
₹ 129.7 CrPAT Margin (FY'26)
19.6 %P/E Multiple
38.6xEBITDA (FY'26)
₹ 180.4 CrCAGR Growth 2Y
53.7 %ROE (FY'26)
42.1 %ROCE (FY'26)
70.1 %Price to Book Value
12.6xDebt/Equity
0.1xCompany Website
www.kanohar.comExplore new deals
Overview
Fund Allocation
Total: ₹0 CrSource:Company DRHP
Timeline
IPO Open Date
To Be Announced
IPO Close Date
To Be Announced
Tentative Allotment
To Be Announced
Initiation of Refunds
To Be Announced
Credit of Shares to Demat
To Be Announced
Tentative Listing Date
To Be Announced
Business
Business Model
Geographical Presence
Sales Channel
Clients
Key Risk Factor
Financial Highlights
Income Statement
Revenue growth with EBITDA and PAT margins
| Financial Metric | FY 2024 | FY 2025 | FY 2026 |
|---|---|---|---|
| Revenue (₹ Cr) | 281.1 | 457.3 | 662.9 |
| Growth (%) | -8.9% | 62.9% | 45.1% |
| EBITDA (₹ Cr) | 31.1 | 93.4 | 180.4 |
| EBITDA Margin (%) | 11.2% | 20.7% | 27.6% |
| PAT (₹ Cr) | 17.8 | 65.1 | 129.7 |
| PAT Margin (%) | 6.3% | 14.2% | 19.6% |
OBSERVATIONS & INSIGHTS
Revenue increased from INR 276.7 Cr in FY24 to INR 653.8 Cr in FY26, a two-year CAGR of approximately 53.7%, as higher-rated power and Scott-transformer execution accelerated
EBITDA increased almost six-fold from INR 31.1 Cr in FY24 to INR 180.4 Cr in FY26, materially outpacing revenue growth. EBITDA increased almost six-fold from INR 31.1 Cr in FY24 to INR 180.4 Cr in FY26, materially outpacing revenue growth
PAT nearly doubled to INR 129.7 Cr in FY26 from INR 65.1 Cr in FY25, supported by operating leverage and richer product mix
Balance Sheet
| Financial Metric | FY 2024 | FY 2025 | FY 2026 |
|---|---|---|---|
| Net Worth | ₹ 178.1 Cr | ₹ 243.1 Cr | ₹ 372.8 Cr |
| Total Assets | ₹ 322.9 Cr | ₹ 432.1 Cr | ₹ 613.9 Cr |
| Total Borrowing | ₹ 42.1 Cr | ₹ 32.3 Cr | ₹ 39.0 Cr |
| Reserves & Surplus | ₹ 174.1 Cr | ₹ 239.1 Cr | ₹ 358.0 Cr |
OBSERVATIONS & INSIGHTS
Total equity more than doubled to INR 372.8 Cr, supporting low leverage even as working-capital assets increased
Current borrowings declined from INR 41.5 Cr in FY24 to INR 24.6 Cr in FY26 despite revenue growth, indicating reduced dependence on funded short term debt
Long-term borrowings increased to INR 14.4 Cr in FY26 but remain modest relative to equity and annual EBITDA
Receivables increased to INR 210.8 Cr and are the largest current asset, making milestone collection the principal asset-quality monitorable
Cash Flow
| Financial Metric | FY 2024 | FY 2025 | FY 2026 |
|---|---|---|---|
CFO in Cr Cash generated from core business operations. | -16.3 Cr | +79.4 Cr | +25.8 Cr |
CFI in Cr Cash used in / generated from investing activities. | -13.0 Cr | -61.5 Cr | -21.9 Cr |
CFF in Cr Cash from / used in financing activities. | +12.1 Cr | -17.7 Cr | -4.1 Cr |
Working Capital
| Efficiency Metric | FY 2023 | FY 2024 | FY 2025 |
|---|---|---|---|
Debtor Days Average number of days taken to collect customer payments. | - | - | - |
Creditor Days Average time taken to pay suppliers and vendors. | - | - | - |
Inventory Days Average number of days inventory remains unsold. | - | - | - |
CCC (Cash Conversion Cycle) (Debtor Days + Inventory Days - Creditor Days) | - | - | - |
Financial Ratios
Measures the company’s leverage relative to shareholder equity.
OBSERVATIONS & INSIGHTS
ROE rose to 42.1% in FY26 from 30.9% in FY25 and 10.5% in FY24 as PAT scaled faster than average equity
ROCE increased to 70.1% in FY26 from 47.6% in FY25, reflecting stronger EBIT generation relative to average capital employed after cash/bank balances
D/E declined from 0.2x in FY24 to 0.1x in FY26, leaving the Company lightly leveraged despite rapid revenue growth
Current Ratio improved from approximately 1.74x in FY24 to 2.50x in FY26, supported by receivables, inventories and bank balances exceeding current liabilities
Interest Coverage Ratio improved from roughly 4.3x in FY24 to 13.8x in FY26, although finance costs increased in absolute terms in FY26
Industry Overview
Industry Drivers
National Transmission Build-out and Grid Investment
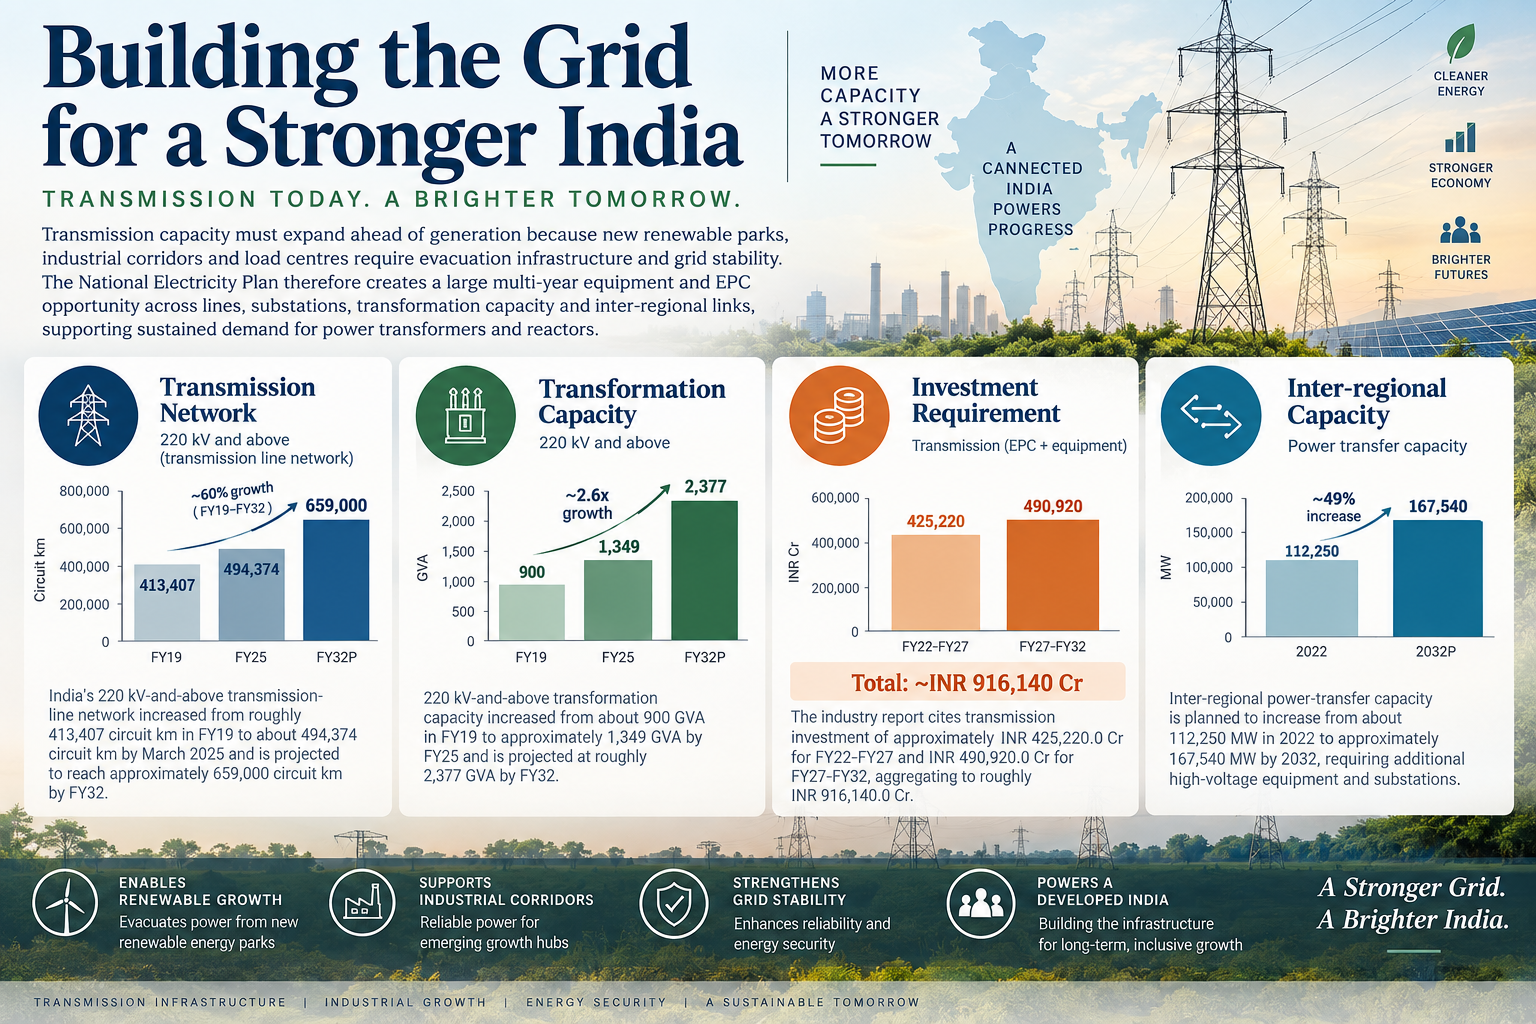
Transmission capacity must expand ahead of generation because new renewable parks, industrial corridors and load centres require evacuation infrastructure and grid stability. The National Electricity Plan therefore creates a large multi-year equipment and EPC opportunity across lines, substations, transformation capacity and inter-regional links, supporting sustained demand for power transformers and reactors.
The key drivers are:
Transmission network: India's 220 kV-and-above transmission-line network increased from roughly 413,407 circuit km in FY19 to about 494,374 circuit km by March 2025 and is projected to reach approximately 659,000 circuit km by FY32
Transformation capacity: 220 kV-and-above transformation capacity increased from about 900 GVA in FY19 to approximately 1,349 GVA in FY25 and is projected at roughly 2,377 GVA by FY32
Investment requirement: The industry report cites transmission investment of approximately INR 425,220.0 Cr for FY22-FY27 and INR 490,920.0 Cr for FY27-FY32, aggregating to roughly INR 916,140.0 Cr.
Inter-regional capacity: Inter-regional power-transfer capacity is planned to increase from about 112,250 MW in 2022 to approximately 167,540 MW by 2032, requiring additional high-voltage equipment and substations
Renewable Integration, Storage and Green Energy Corridors
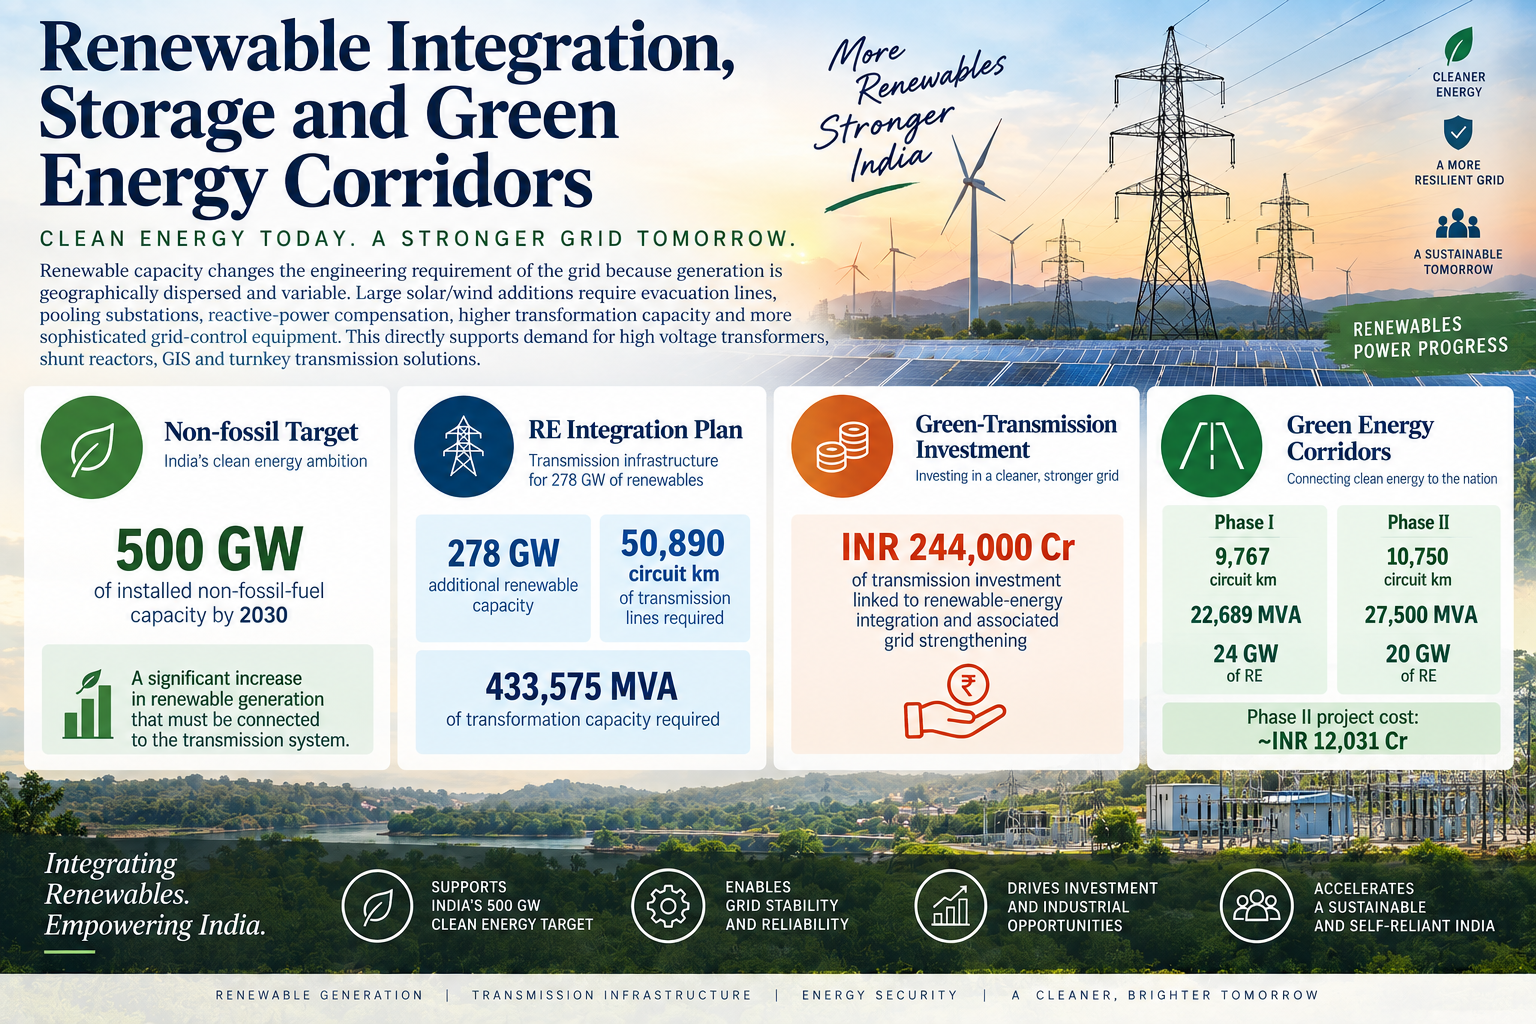
Renewable capacity changes the engineering requirement of the grid because generation is geographically dispersed and variable. Large solar/wind additions require evacuation lines, pooling substations, reactive-power compensation, higher transformation capacity and more sophisticated grid-control equipment. This directly supports demand for high voltage transformers, shunt reactors, GIS and turnkey transmission solutions.
The key drivers are:
Non-fossil target: India is targeting 500 GW of installed non-fossil-fuel capacity by 2030, materially increasing the volume of new generation that must be connected to the transmission system
RE integration plan: The transmission plan incorporates approximately 278 GW of additional renewable capacity and requires around 50,890 circuit km of lines and 433,575 MVA of transformation capacity
Green-transmission investment: CareEdge cites approximately INR 244,000.0 Cr of transmission investment linked to renewable-energy integration and associated grid strengthening
Green Energy Corridors: Phase I covers about 9,767 circuit km and 22,689 MVA for 24 GW of RE, while Phase II targets roughly 10,750 circuit km and 27,500 MVA for 20 GW, with Phase II project cost around INR 12,031.0 Cr.
Transformer Market Growth and Shift Toward EHV Equipment
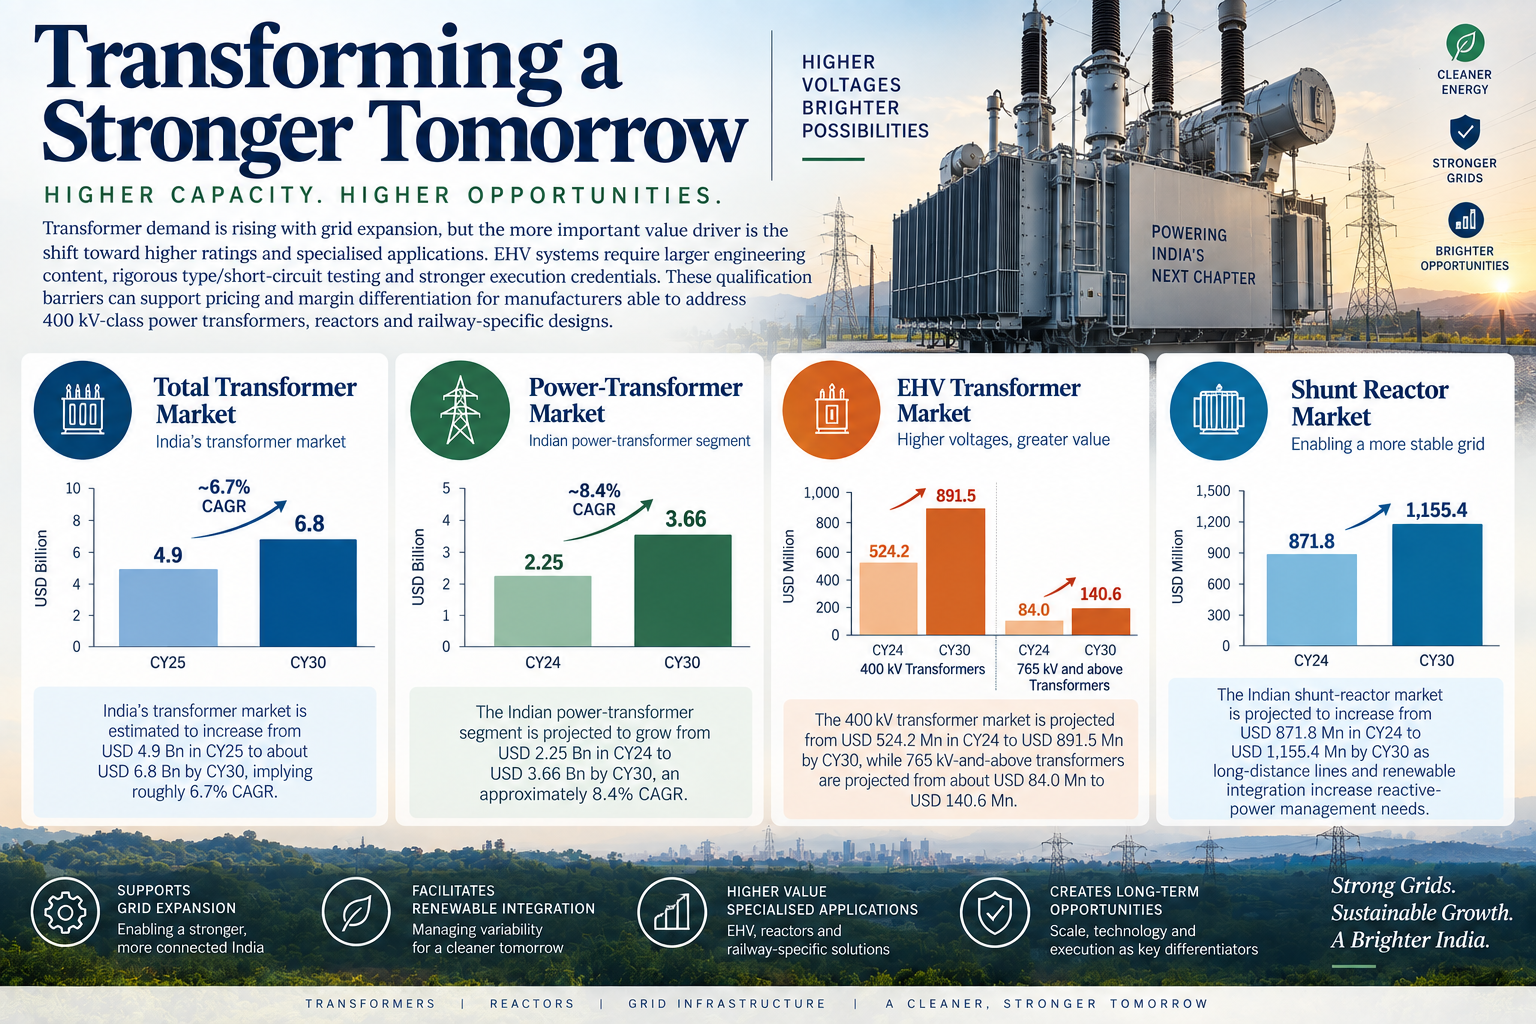
Transformer demand is rising with grid expansion, but the more important value driver is the shift toward higher ratings and specialised applications. EHV systems require larger engineering content, rigorous type/short-circuit testing and stronger execution credentials. These qualification barriers can support pricing and margin differentiation for manufacturers able to address 400 kV-class power transformers, reactors and railway-specific designs.
The key drivers are:
Total transformer market: India's transformer market is estimated to increase from approximately USD 4.9 Bn in CY25 to about USD 6.8 Bn by CY30, implying roughly 6.7% CAGR
Power-transformer market: The Indian power-transformer segment is projected to grow from approximately USD 2.25 Bn in CY24 to USD 3.66 Bn by CY30, an approximately 8.4% CAGR
EHV mix: The 400 kV transformer market is projected from roughly USD 524.2 Mn in CY24 to USD 891.5 Mn by CY30, while 765 kV-and-above transformers are projected from about USD 84.0 Mn to USD 140.6 Mn
Shunt reactors: The Indian shunt-reactor market is projected to increase from approximately USD 871.8 Mn in CY24 to USD 1,155.4 Mn by CY30 as long-distance lines and renewable integration increase reactive-power management needs
Risks in the Industry
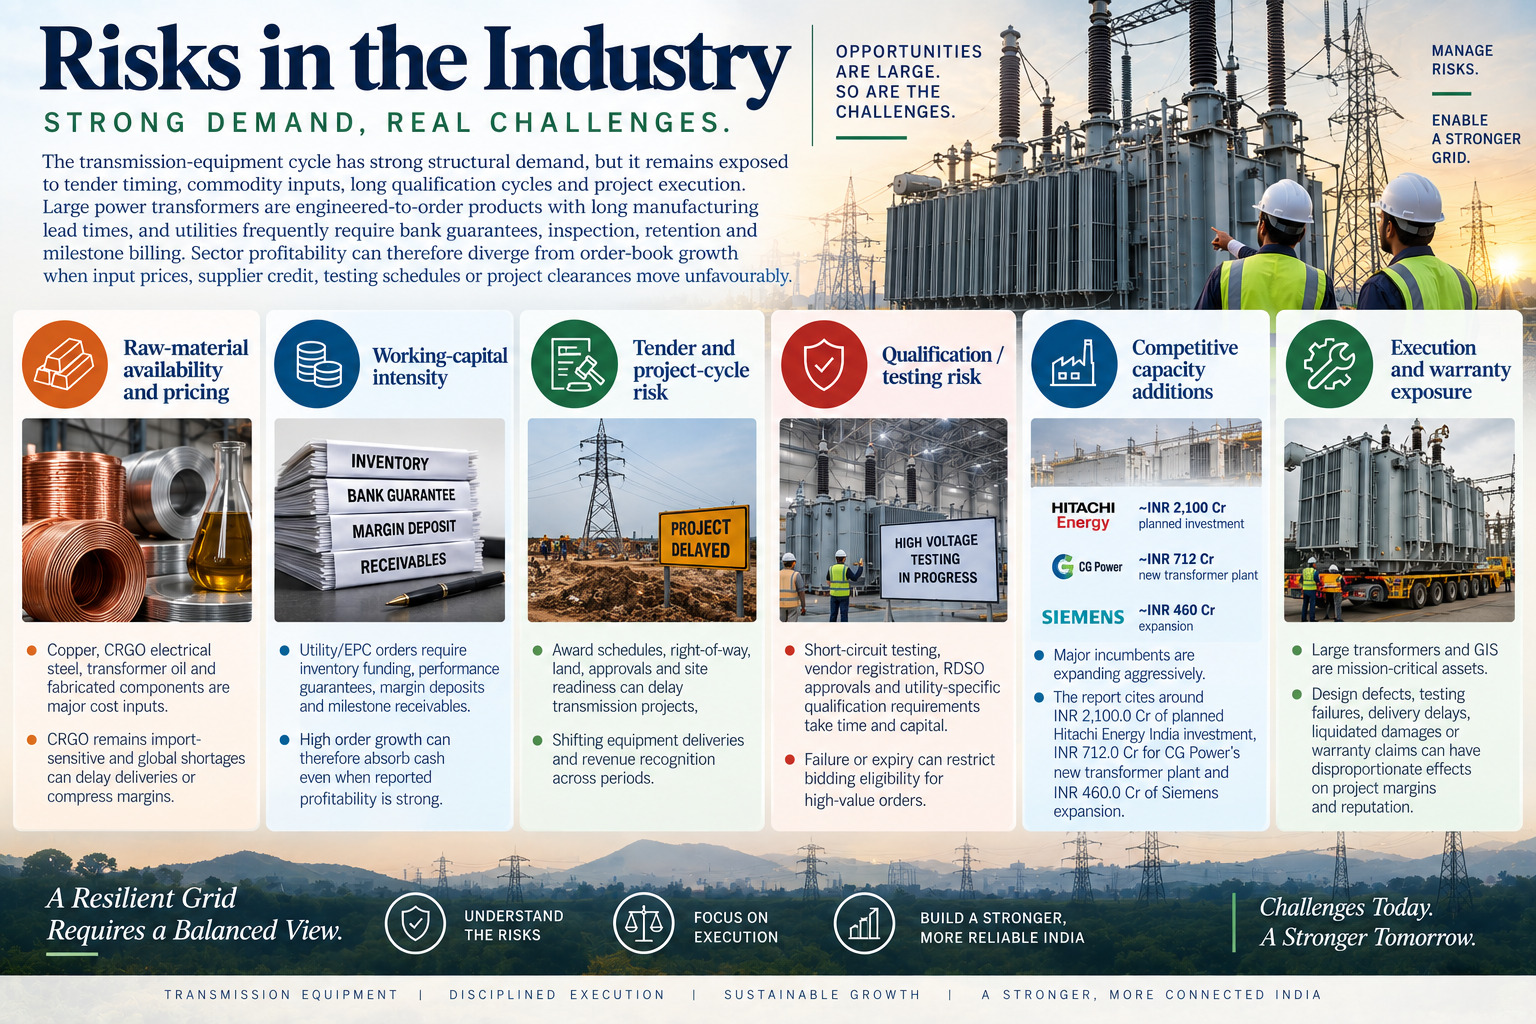
The transmission-equipment cycle has strong structural demand, but it remains exposed to tender timing, commodity inputs, long qualification cycles and project execution. Large power transformers are engineered-to-order products with long manufacturing lead times, and utilities frequently require bank guarantees, inspection, retention and milestone billing. Sector profitability can therefore diverge from order-book growth when copper/CRGO prices, supplier credit, testing schedules or project clearances move unfavourably.
The key risks are:
Raw-material availability and pricing: Copper, CRGO electrical steel, transformer oil and fabricated components are major cost inputs; CRGO remains import-sensitive and global shortages can delay deliveries or compress margins
Working-capital intensity: Utility/EPC orders require inventory funding, performance guarantees, margin deposits and milestone receivables; high order growth can therefore absorb cash even when reported profitability is strong
Tender and project-cycle risk: Award schedules, right-of-way, land, approvals and site readiness can delay transmission projects, shifting equipment deliveries and revenue recognition across periods
Qualification / testing risk: Short-circuit testing, vendor registration, RDSO approvals and utility-specific qualification requirements take time and capital; failure or expiry can restrict bidding eligibility for high-value orders
Competitive capacity additions: Major incumbents are expanding aggressively; the report cites around INR 2,100.0 Cr of planned Hitachi Energy India investment, INR 712.0 Cr for CG Power's new transformer plant and INR 460.0 Cr of Siemens expansion
Execution and warranty exposure: Large transformers and GIS are mission-critical assets. Design defects, testing failures, delivery delays, liquidated damages or warranty claims can have disproportionate effects on project margins and reputation
Government Policy Support
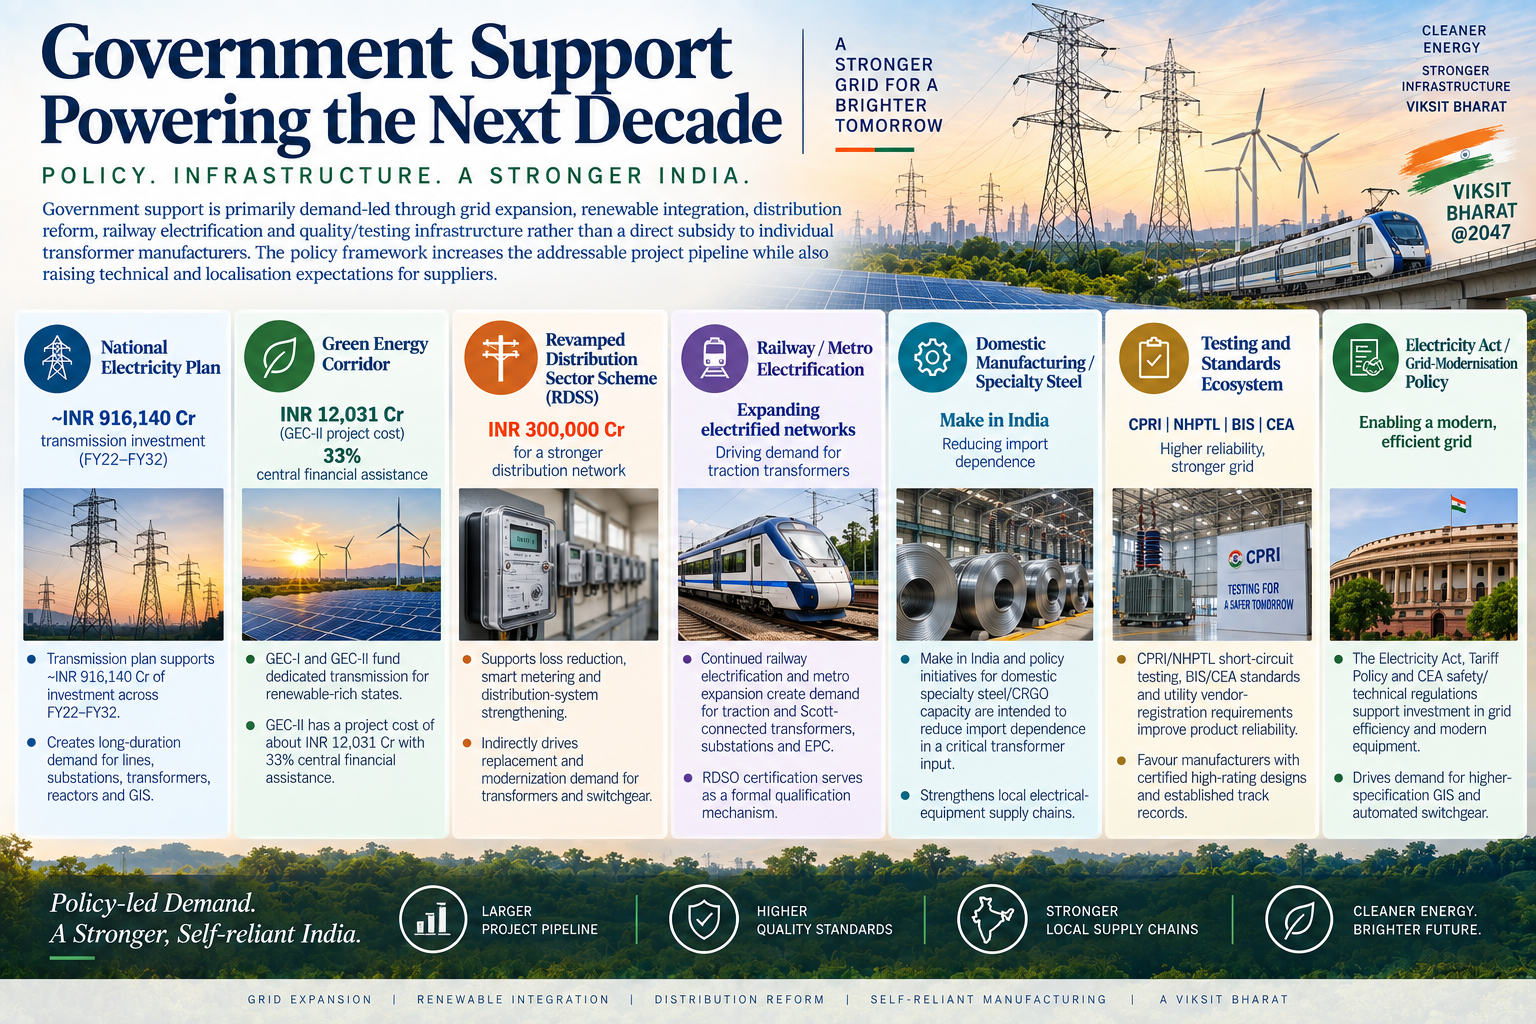
Government support is primarily demand-led through grid expansion, renewable integration, distribution reform, railway electrification and quality/testing infrastructure rather than a direct subsidy to individual transformer manufacturers. The policy framework increases the addressable project pipeline while also raising technical and localisation expectations for suppliers.
The key policies are:
National Electricity Plan: The transmission plan supports approximately INR 916,140.0 Cr of investment across FY22-FY32, creating long-duration demand for lines, substations, transformers, reactors and GIS
Green Energy Corridor: GEC-I and GEC-II fund dedicated transmission for renewable-rich states; GEC-II has a project cost of about INR 12,031.0 Cr with 33% central financial assistance
Revamped Distribution Sector Scheme (RDSS): The INR 300,000.0 Cr scheme supports loss reduction, smart metering and distribution-system strengthening, indirectly driving replacement and modernization demand for transformers and switchgear
Railway / metro electrification: Continued railway electrification and metro expansion create demand for traction and Scott-connected transformers, substations and associated EPC; RDSO certification serves as a formal qualification mechanism
Domestic manufacturing / specialty steel: Make in India and policy initiatives for domestic specialty steel/CRGO capacity are intended to reduce import dependence in a critical transformer input and strengthen local electrical-equipment supply chains
Testing and standards ecosystem: CPRI/NHPTL short-circuit testing, BIS/CEA standards and utility vendor-registration requirements improve product reliability while favouring manufacturers with certified high-rating designs and established track records
Electricity Act / grid-modernisation policy: The Electricity Act, Tariff Policy and CEA safety/technical regulations support investment in grid efficiency and modern equipment, including higher-specification GIS and automated switchgear
Fundraise/Future Plans
Shareholding
Pre-issue shareholding
Promoter Holding 0.0%
Post-Issue Shareholding
Promoter Holding 0.0%
Category
Pre-Issue%Post-Issue%
Promoters
K Sons Family Trust
97.0%76.1%
Kanohar International Pvt Ltd
2.7%2.6%
Total Promoter Holding
99.7%78.7%
Additional Shareholders
0.0%0.0%
Total Additional Holding
0.0%0.0%
Total Shareholding
99.7%78.7%
- Overview
- Business
- Financial Highlights
- Industry Overview
- Fundraise/Future Plans
- Documentation
Get the Preqt App and keep in touch around the clock!
 Monitor your investments in real-time.
- Receive tailored deal suggestions.
- Get real-time updates and alerts.
