


Karamtara Engineering
Engineering Energy InfrastructurePowering Renewable Progress
IPO Summary (PrEqT)
Karamtara Engineering Limited is an integrated engineering and manufacturing company focused on structural products for solar, wind and power-transmission infrastructure. The Company operated 13 manufacturing facilities as of March 31, 2026 and had aggregate installed capacity of 889,200 MTPA, excluding galvanizing, with 492,000 MTPA dedicated to solar mounting structures and tracker components. FY26 revenue increased 36.5% to INR 4,312.0 Cr, EBITDA rose to INR 498.1 Cr and PAT to INR 228.8 Cr; ROE was 20.8% and ROCE 23.3%. Cash generation strengthened materially, with FY26 operating cash flow of INR 675.1 Cr, although net debt remained INR 881.3 Cr and Debt/Equity was 0.8x ahead of the IPO. The INR 875.0 Cr IPO comprises INR 675.0 Cr fresh issue and INR 200.0 Cr OFS, with INR 600.0 Cr of fresh proceeds proposed for repayment/prepayment of borrowings and acceptances. At INR 241.0-INR 254.0, the IPO implies FY26 P/E of 35.7x, making valuation discipline, capacity ramp-up and tariff-adjusted earnings quality the key underwriting questions.
IPO Review Rating
Above Avg
MainboardBuilding Critical Infrastructure for Solar and Power Transmission Networks
Karamtara has delivered strong financial growth, with Revenue increasing from INR 2,425.2 Cr in FY24 to INR 4,312.0 Cr in FY26, representing a 33.3% CAGR. EBITDA increased from INR 262.9 Cr to INR 498.1 Cr, while PAT more than doubled from INR 102.7 Cr to INR 228.8 Cr, reflecting improving operating scale and profitability. The Company has a meaningful competitive position in renewable-energy structures, with 82.1% of FY26 Revenue from renewable products, large integrated manufacturing capacity and a strong solar-components franchise. International operations are a key differentiator, with INR 1,747.5 Cr of FY26 export Revenue / 40.5% of total Revenue, supported by a footprint across more than 50 countries. Management brings approximately 30 years of manufacturing experience, while promoters remain strongly invested post IPO; however, the outstanding criminal, tax and civil proceedings involving the Company and Promoters remain important governance monitorables. The 77.1% Fresh Issue is constructive, with up to INR 600.0 Cr earmarked for debt/acceptance repayment, which should materially strengthen the balance sheet. Karamtara presents a strong growth, renewable-infrastructure and export-led business proposition, but the investment case requires continued earnings growth and execution strength to justify the premium valuation.
PARAMETER
WEIGHT
SCORE
KEY FACTORS
Financial Performance
40.0%
4.0/5
Karamtara has demonstrated strong and consistent scale-up, with Revenue growing at 33.3% CAGR and PAT more than doubling from INR 102.7 Cr in FY24 to INR 228.8 Cr in FY26.
Show more
Detailed Analysis
Revenue increased from INR 2,425.2 Cr in FY24 to INR 3,158.4 Cr in FY25 and INR 4,312.0 Cr in FY26, representing a strong FY24–FY26 CAGR of 33.3%
EBITDA increased from INR 262.9 Cr in FY24 to INR 346.8 Cr in FY25 and INR 498.1 Cr in FY26, while EBITDA Margin improved from 10.8% to 11.0% and 11.6%, respectively
PAT increased from INR 102.7 Cr in FY24 to INR 139.3 Cr in FY25 and INR 228.8 Cr in FY26, while PAT Margin expanded from 4.2% to 4.4% and 5.3%
D/E improved from 0.9x in FY24 to 0.6x in FY25, before increasing to 0.8x in FY26 as the Company expanded capacity; FY26 D/E stood at 0.7x
ROE remained healthy at 20.5% in FY24, 18.1% in FY25 and 20.8% in FY26, despite substantial expansion in the capital baseOCF remained positive and increased from INR 40.0 Cr in FY24 to INR 102.5 Cr in FY25 and INR 675.1 Cr in FY26, significantly exceeding FY26 PAT
Largest-customer contribution reduced from 18.9% in FY24 to 6.2% in FY25 and 8.0% in FY26; Top-10 concentration also improved from 63.5% in FY24 to 48.6% in FY26
Industry
15.0%
4.0/5
Karamtara is positioned in a high-growth renewable-energy infrastructure ecosystem, particularly solar trackers and mounting structures, where Indian demand is expected to expand rapidly.
Show more
Detailed Analysis
India's solar tracking and mounting-products market is projected to increase from USD 810.0 Mn in FY24 to USD 3,429.0 Mn by FY29E, representing a strong 33.5% CAGR
India's broader solar-tracker market is projected to grow from USD 3,463.0 Mn in FY24 to USD 13,660.0 Mn by FY29E, while tracker penetration is expected to reach approximately 62.0%
India's renewable-energy target of 500 GW by 2030, domestic-manufacturing policies and solar deployment support demand, while CBAM, overseas tariffs and product-compliance requirements create export-related risks
Management
15.0%
4.0/5
Karamtara benefits from a deeply experienced promoter-led management team, balanced Board composition, zero promoter pledge and limited recurring related-party exposure.
Show more
Detailed Analysis
Promoter Directors Tanveer Singh and Rajiv Singh have approximately 30 years of manufacturing experience each, supported by a senior management team with substantial industry experience
The Board comprises 8 Directors, including 4 Independent Directors, resulting in 50.0% independent representation, including one woman Independent Director
No promoter shares are pledged, although the Company and Promoters are involved in several pending criminal, tax and civil proceedings
Recurring disclosed operating/KMP RPTs were approximately INR 19.5 Cr / 0.5% of FY26 Revenue
The IPO comprises 77.1% Fresh Issue and 22.9% OFS; the entire INR 200.0 Cr OFS is being sold by Tanveer Singh and Rajiv Singh, while promoter holding is estimated to remain approximately 82.0% post issue
Valuation
20.0%
2.0/5
The IPO is valued at 35.7x FY26 PAT, compared with a peer average of 19.2x, implying an approximately 86.3% premium.
Show more
Detailed Analysis
Karamtara's 35.7x P/E represents an 86.3% premium to the 19.2x disclosed peer average
Current EV/EBITDA multiples across the same broader peer basket average approximately 13.8x, compared with Karamtara's indicative 18.2x, placing Karamtara at roughly a 31.6% premium on EV/EBITDA as well
FY26 RoNW of 20.8%
Merchant Banker Track Record
10.0%
4.0/5
Karamtara is backed by a well-established institutional BRLM syndicate comprising JM Financial, ICICI Securities and IIFL Capital. The three bankers have substantial recent Mainboard transaction depth.
Show more
Detailed Analysis
Across the latest 10 disclosed IPOs for each BRLM, average listing-day opening return was approximately 24.9% for JM Financial, 21.6% for ICICI Securities and 8.3% for IIFL, producing a combined average of approximately 18.2%
22 of 30 recent issue-level observations, or approximately 73.3%, opened above their respective issue prices
A representative recent IPO sample including Lumino, Tempsens, Augmont, Gaja and Horizon averaged approximately 89.2x subscription, although demand ranged widely from 1.5x to 184.1x
Across the disclosed FY25–FY27 review period, JM Financial handled 52 IPOs, ICICI Securities 53 IPOs and IIFL Capital 52 IPOs, indicating substantial Mainboard execution depth
TOTAL
100%
3.6/5
Weighted Composite Score
Issue Price
₹241.0 to ₹254.0
As of 4 Sep 2026
GMP
₹20.0
As of 4 Sep 2026
Estimated Gain / Loss
+7.9%
Lot Size
59.0 Shares
Grey Market Premium (GMPs) are shared for knowledge purpose only. PrEqt doesn’t promote or execute the trades.
| Issue size | |
|---|---|
| Overall | ₹875.0 Cr |
| Fresh Issue | ₹675.0 Cr |
| Offer for Sale | ₹200.0 Cr |
Minimum Investment
₹14,986.0 / 3,481 shares

Merchant Banker
JM Financial Ltd.; ICICI Securities; IIFL Capital Services
IPO Document
RHP / Anchor Document
Offer Start Date
9th Sept 2026
Offer End Date
11th Sept 2026
Valuation
₹8,174.3 Cr
Revenue (FY'26)
₹4,316.4 Cr
PAT (FY'26)
₹228.8 Cr
Issue Size
₹875.0 Cr
Face Value
₹ 10.0Offer Price
₹ 254.0Lot Size
59.0 sharesSale Type
Fresh capital cum OFSPAT (FY'26)
₹ 228.8 CrPAT Margin (FY'26)
5.3 %P/E Multiple
35.7xEBITDA (FY'26)
₹ 498.1 CrCAGR Growth 2Y
33.3 %ROE (FY'26)
20.8 %ROCE (FY'26)
23.3 %Price to Book Value
6.1xDebt/Equity
0.8xCompany Website
karamtara.comExplore new deals
Overview
Fund Allocation
Total: ₹0 CrSource:Company DRHP
Timeline
IPO Open Date
To Be Announced
IPO Close Date
To Be Announced
Tentative Allotment
To Be Announced
Initiation of Refunds
To Be Announced
Credit of Shares to Demat
To Be Announced
Tentative Listing Date
To Be Announced
Business
Business Model
Geographical Presence
Sales Channel
Clients
Key Risk Factor
Financial Highlights
Income Statement
Revenue growth with EBITDA and PAT margins
| Financial Metric | FY 2024 | FY 2025 | FY 2026 |
|---|---|---|---|
| Revenue (₹ Cr) | 2,427.1 | 3,165.4 | 4,316.4 |
| Growth (%) | 51.5% | 30.2% | 36.5% |
| EBITDA (₹ Cr) | 262.9 | 346.8 | 498.1 |
| EBITDA Margin (%) | 10.8% | 11.0% | 11.6% |
| PAT (₹ Cr) | 102.7 | 139.3 | 228.8 |
| PAT Margin (%) | 4.2% | 4.4% | 5.3% |
OBSERVATIONS & INSIGHTS
Revenue increased from INR 2,425.2 Cr in FY24 to INR 4,312.0 Cr in FY26, a two-year CAGR of 33.3%; FY26 growth reflected stronger domestic sales across solar and lattice-tower categories
Reported EBITDA margin expanded gradually to 11.6%; the tariff recovery / expense mechanism suppresses revenue-based margins relative to underlying sales economics
PAT margin improved to 5.3% from 4.4%, reflecting higher operating earnings despite finance cost of INR 140.5 Cr in FY26
Balance Sheet
| Financial Metric | FY 2024 | FY 2025 | FY 2026 |
|---|---|---|---|
| Net Worth | ₹ 553.4 Cr | ₹ 983.2 Cr | ₹ 1,219.9 Cr |
| Total Assets | ₹ 1,844.6 Cr | ₹ 2,762.6 Cr | ₹ 4,142.2 Cr |
| Total Borrowing | ₹ 508.5 Cr | ₹ 556.3 Cr | ₹ 1,030.1 Cr |
| Reserves & Surplus | ₹ 547.5 Cr | ₹ 690.5 Cr | ₹ 927.6 Cr |
OBSERVATIONS & INSIGHTS
Total equity increased to INR 1,219.9 Cr from INR 983.2 Cr as retained earnings strengthened the capital base after the prior equity issuance
Non-current plus current borrowings rose to INR 1,030.1 Cr from INR 556.3 Cr, reflecting debt-funded manufacturing and international expansion
Total Assets expanded 49.9% in FY26 to INR 4,142.2 Cr as manufacturing assets, CWIP, receivables and other current/non-current assets increased
Cash Flow
| Financial Metric | FY 2024 | FY 2025 | FY 2026 |
|---|---|---|---|
CFO in Cr Cash generated from core business operations. | +40 Cr | +102.5 Cr | +675.1 Cr |
CFI in Cr Cash used in / generated from investing activities. | -123.8 Cr | -276.4 Cr | -959.5 Cr |
CFF in Cr Cash from / used in financing activities. | +88.1 Cr | +194.9 Cr | +328.3 Cr |
Working Capital
| Efficiency Metric | FY 2023 | FY 2024 | FY 2025 |
|---|---|---|---|
Debtor Days Average number of days taken to collect customer payments. | - | - | - |
Creditor Days Average time taken to pay suppliers and vendors. | - | - | - |
Inventory Days Average number of days inventory remains unsold. | - | - | - |
CCC (Cash Conversion Cycle) (Debtor Days + Inventory Days - Creditor Days) | - | - | - |
Financial Ratios
Measures the company’s leverage relative to shareholder equity.
OBSERVATIONS & INSIGHTS
ROE recovered to 20.8% in FY26 from 18.1% as PAT grew faster than average equity, while remaining broadly in line with FY24
ROCE held near 23.3% despite large capacity additions, indicating that operating profit broadly kept pace with the expanded capital base
Interest Coverage Ratio improved to 3.2x because PBT increased strongly while finance cost rose more moderately
Current Ratio reduced to about 1.1x from 1.2x as current liabilities increased alongside the larger operating scale
ROA was 5.5% in FY26 versus 5.0% in FY25 as PAT growth broadly matched the expansion in the closing asset base
Industry Overview
Industry Drivers
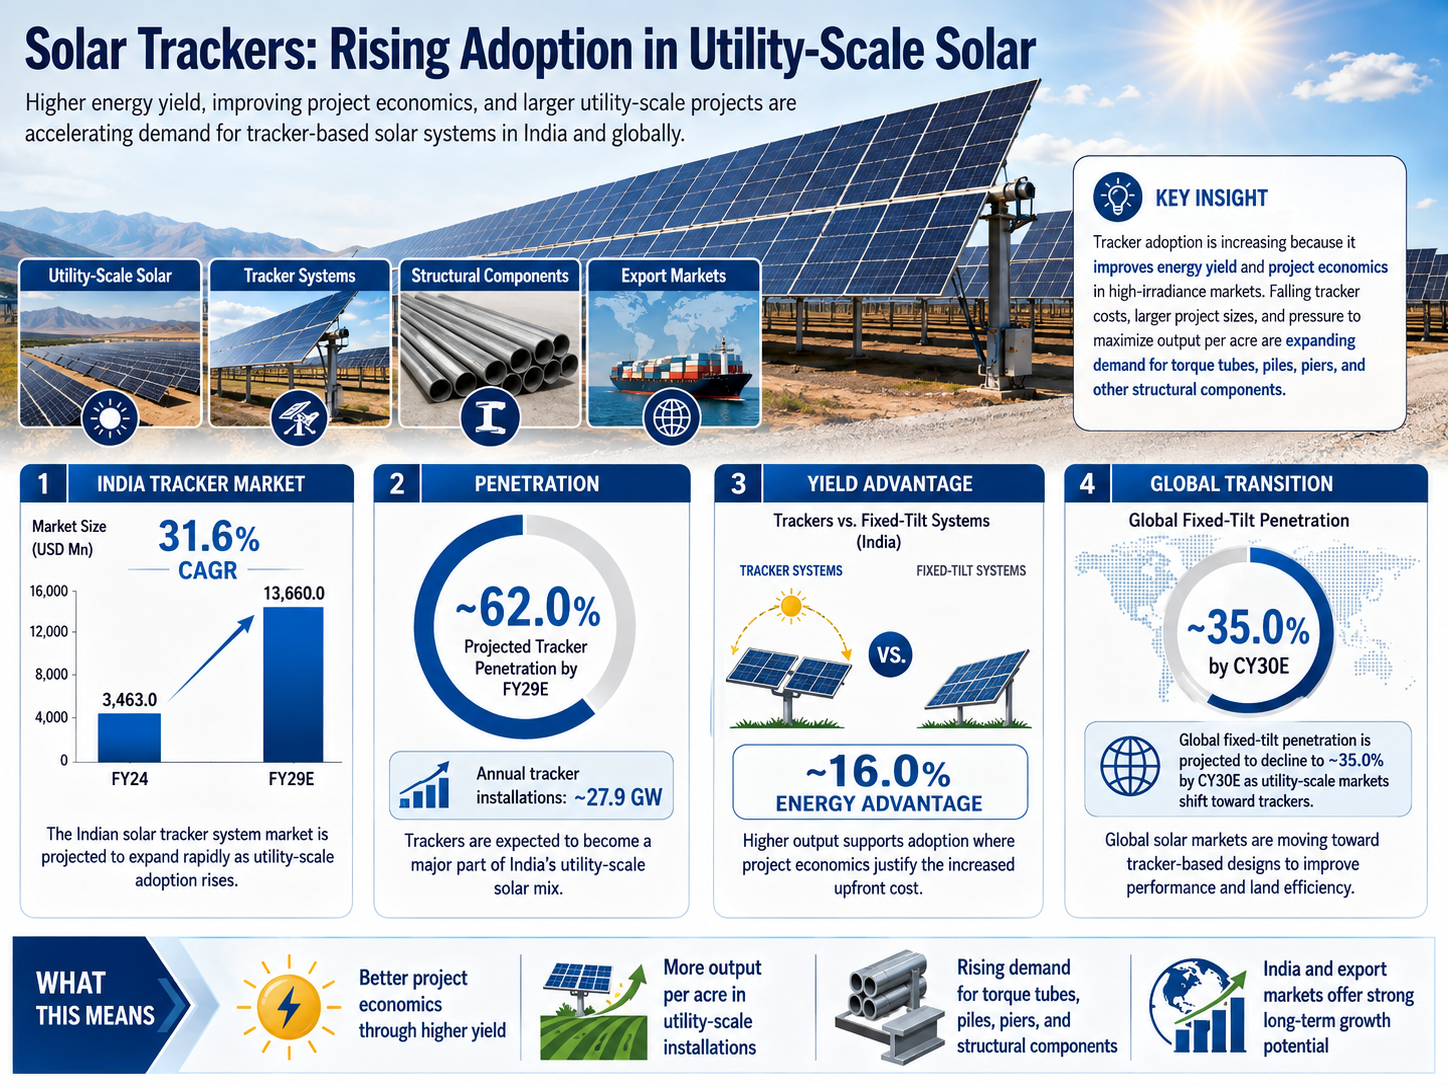
Solar Capacity Expansion and Rising Tracker Penetration
Utility-scale solar installations are increasingly adopting tracker systems because tracking improves energy yield and project economics in high-irradiance markets. Falling tracker costs, larger project sizes and pressure to maximize output per acre are accelerating adoption in India and export markets, expanding demand for torque tubes, piles, piers and other structural components.
The key drivers are:
India tracker market: The Indian solar tracker system market was approximately USD 3,463.0 Mn in FY24 and is projected to reach USD 13,660.0 Mn by FY29E, a 31.6% CAGR
Penetration: India tracker penetration is projected to reach nearly 62.0% by FY29E, with annual tracker installations of about 27.9 GW
Yield advantage: Trackers can provide roughly 16.0% energy advantage over fixed-tilt systems in India, supporting adoption where project economics justify the higher initial cost
Global transition: Global fixed-tilt penetration is projected to decline to about 35.0% by CY30E as utility-scale markets shift toward tracker-based designs
Growth in Solar Tracking and Mounting Components
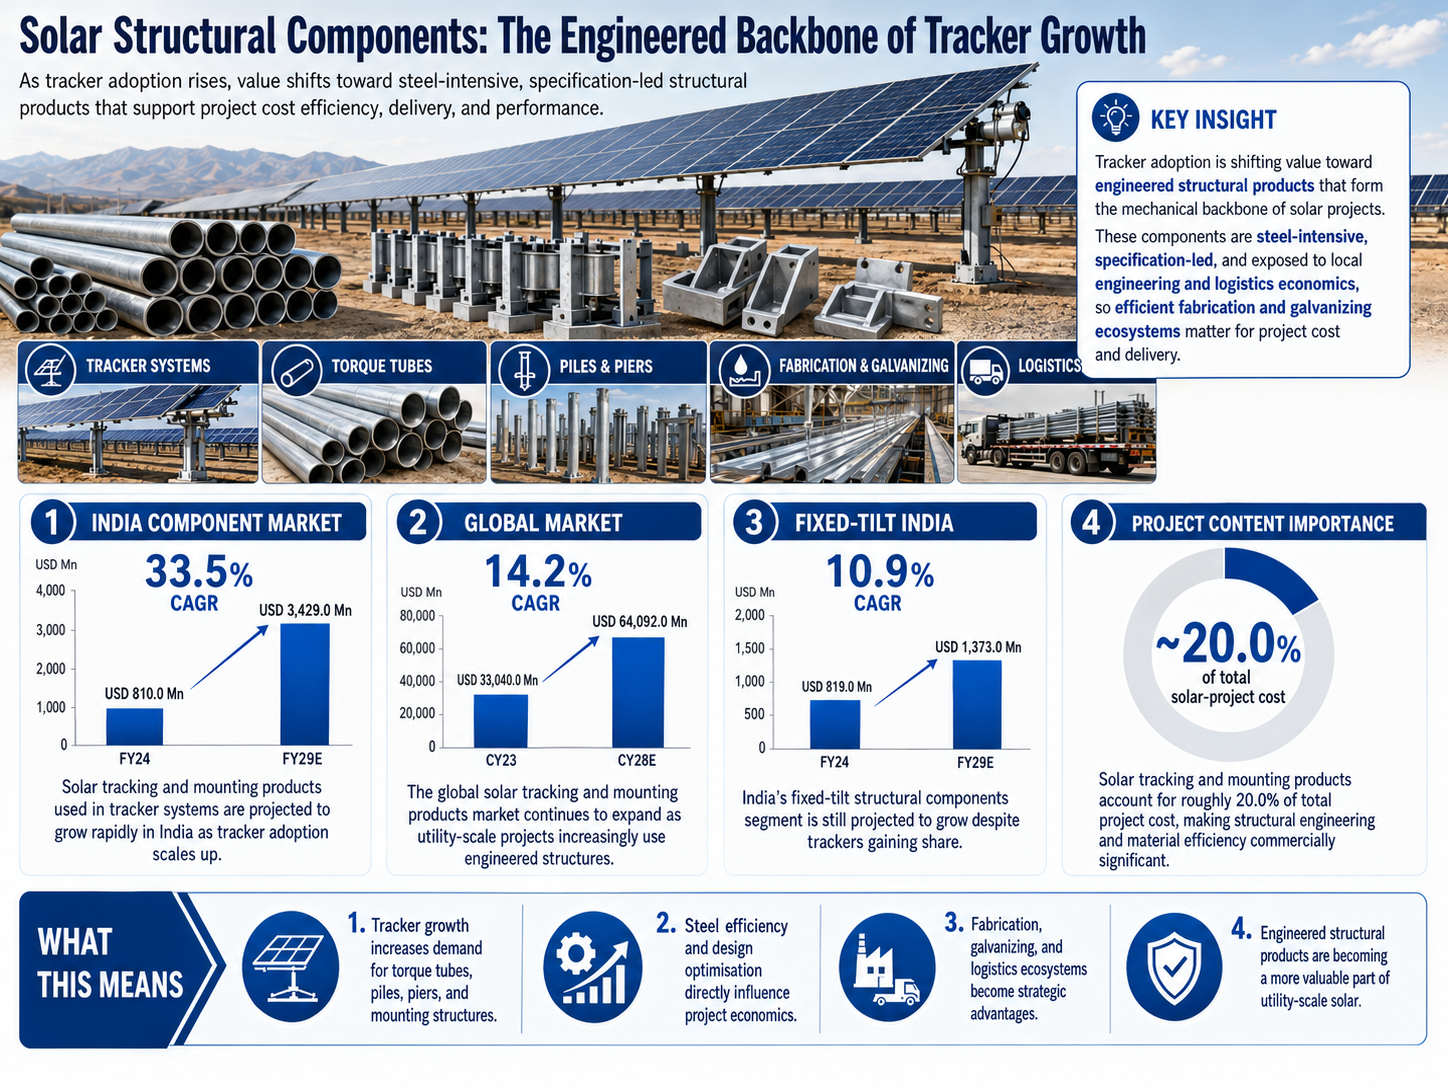
As tracker adoption rises, value shifts toward engineered structural products that form the mechanical backbone of solar projects. These components are steel-intensive, specification-led and exposed to local engineering and logistics economics, giving efficient fabrication and galvanizing ecosystems an important role in project cost and delivery.
The key drivers are:
India component market: Solar tracking and mounting products used in tracker systems are projected to grow from USD 810.0 Mn in FY24 to USD 3,429.0 Mn by FY29E, a 33.5% CAGR
Global market: The global solar tracking and mounting products market is projected to increase from USD 33,040.0 Mn in CY23 to USD 64,092.0 Mn by CY28E, a 14.2% CAGR
Fixed-tilt India: India fixed-tilt structural components are projected to grow from USD 819.0 Mn in FY24 to USD 1,373.0 Mn by FY29E, a 10.9% CAGR despite trackers gaining share
Project content: Solar tracking and mounting products account for roughly 20.0% of total solar-project cost, making structural engineering and material efficiency commercially significan
Wind Energy and Transmission Infrastructure Build-out
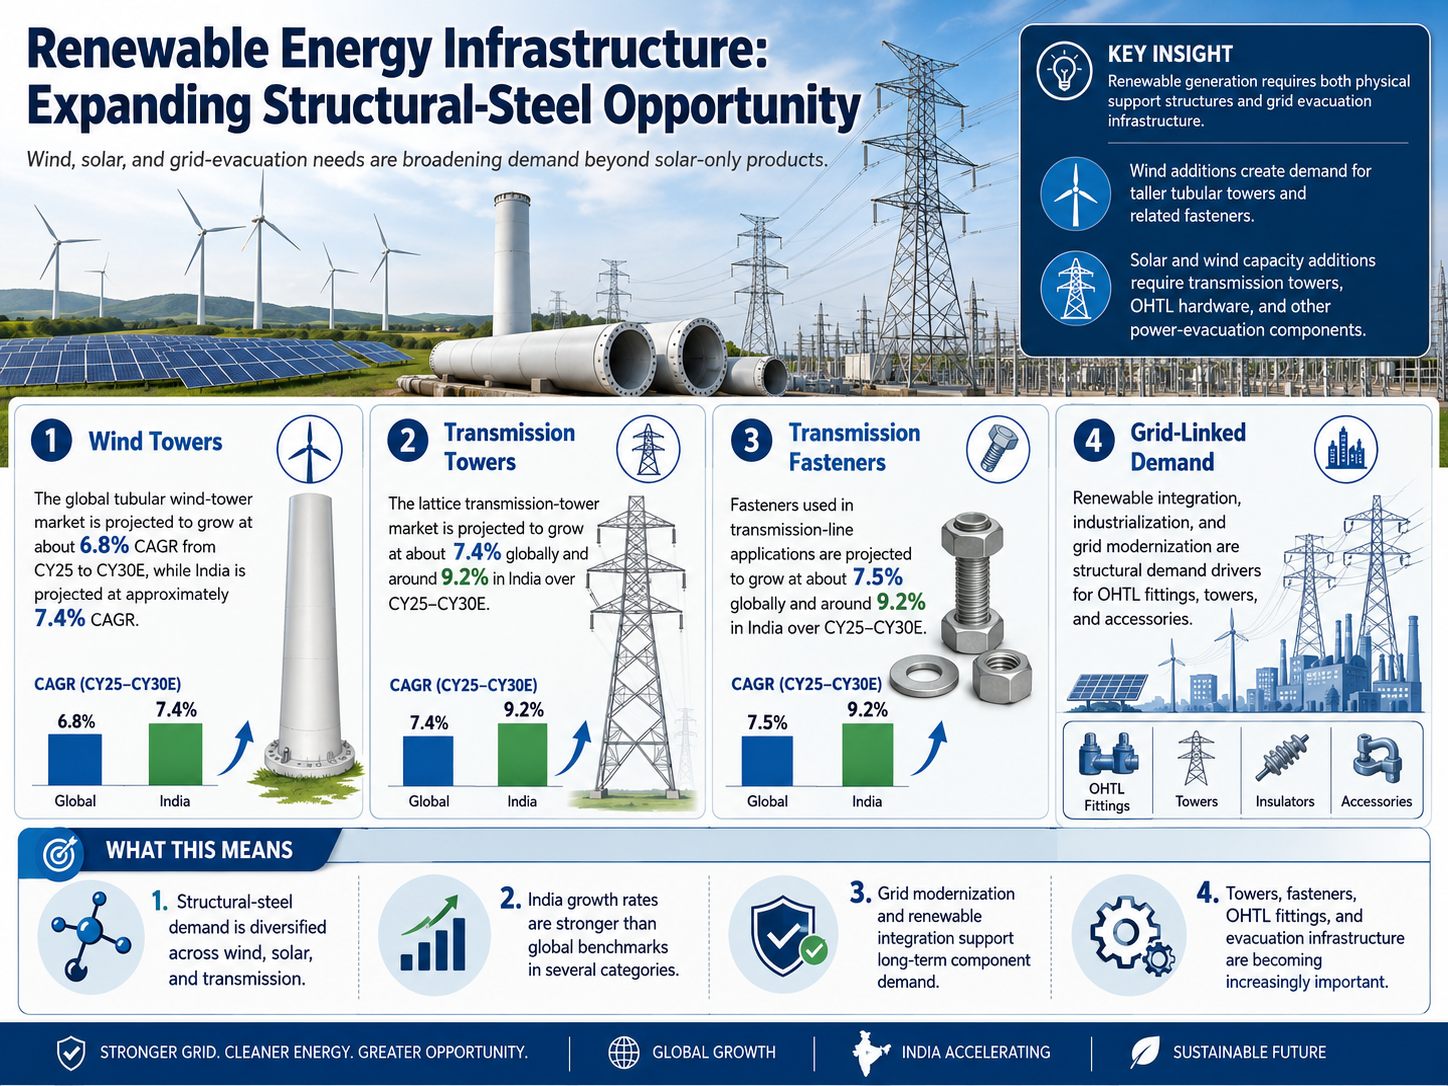
Renewable generation requires both physical support structures and grid evacuation infrastructure. Wind additions create demand for taller tubular towers and related fasteners, while solar and wind capacity additions require transmission towers, OHTL hardware and other power-evacuation components. This broadens the structural-steel opportunity beyond solar-only products.
The key drivers are:
Wind towers: The global tubular wind-tower market is projected to grow at about 6.8% CAGR from CY25 to CY30E, while India is projected at approximately 7.4% CAGR
Transmission towers: The lattice transmission-tower market is projected to grow at about 7.4% globally and around 9.2% in India over CY25-CY30E
Transmission fasteners: Fasteners used in transmission-line applications are projected to grow at about 7.5% globally and around 9.2% in India over CY25-CY30E
Grid-linked demand: Renewable integration, industrialization and grid modernization are identified as structural demand drivers for OHTL fittings, towers and accessories
Risks in the Industry
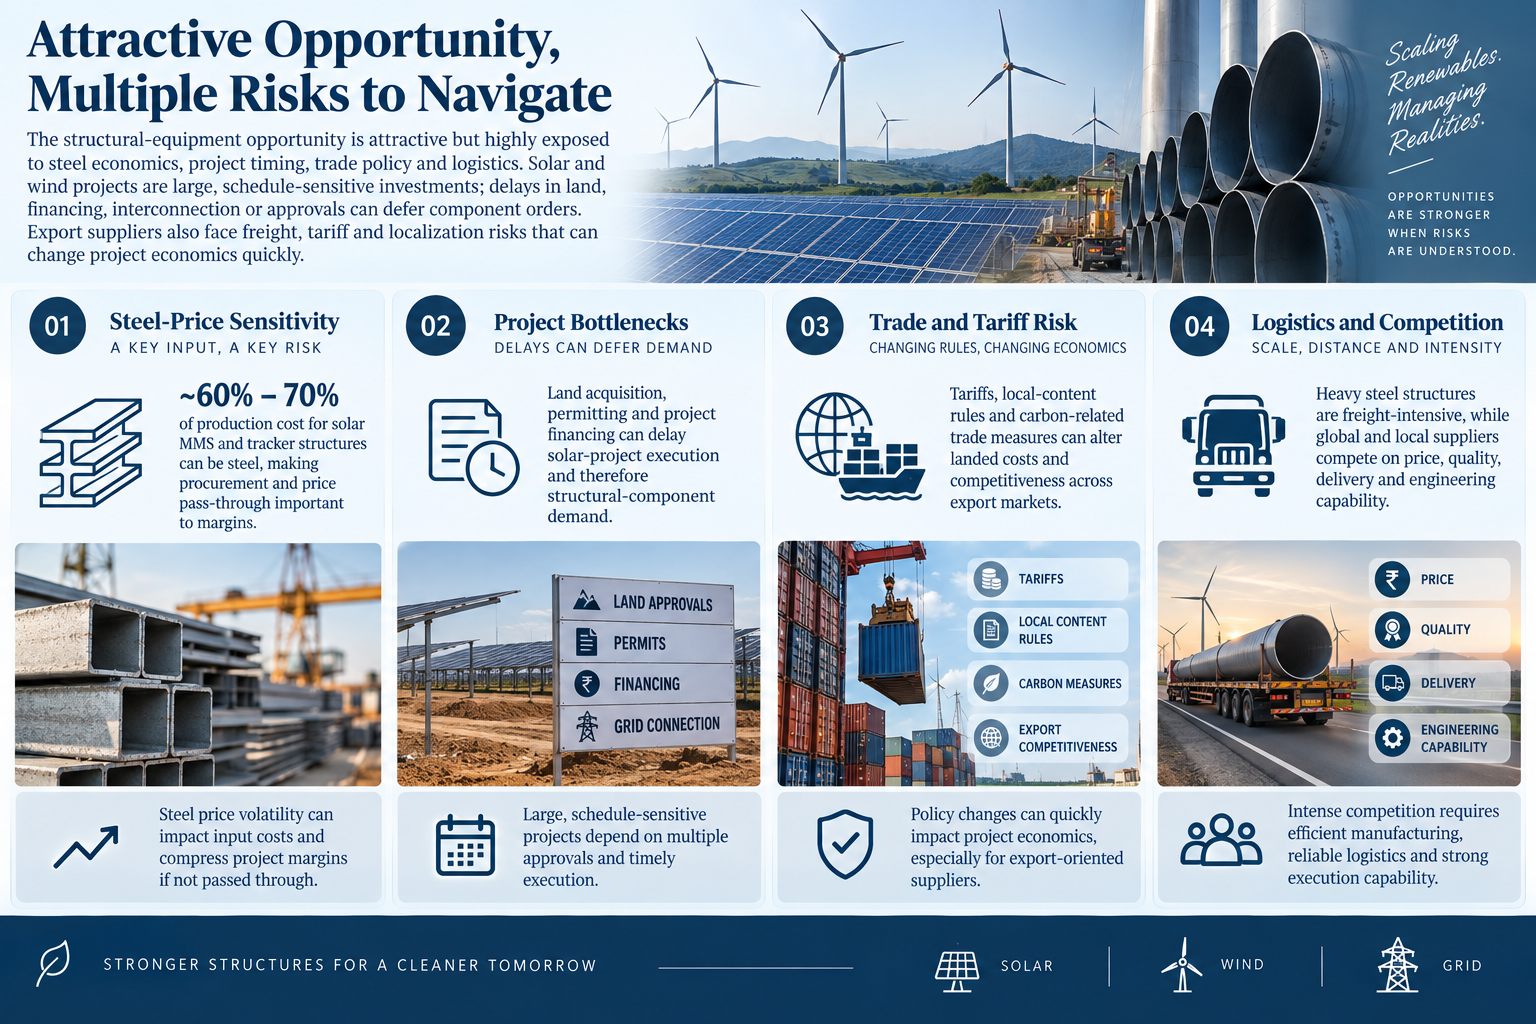
The structural-equipment opportunity is attractive but highly exposed to steel economics, project timing, trade policy and logistics. Solar and wind projects are large, schedule-sensitive investments; delays in land, financing, interconnection or approvals can defer component orders. Export suppliers also face freight, tariff and localization risks that can change project economics quickly.
The key risks are:
Steel-price sensitivity: Steel can represent roughly 60%-70% of production cost for solar MMS and tracker structures, making procurement and price pass-through important to margins
Project bottlenecks: Land acquisition, permitting and project financing can delay solar-project execution and therefore structural-component demand
Trade and tariff risk: Tariffs, local-content rules and carbon-related trade measures can alter landed costs and competitiveness across export markets
Logistics and competition: Heavy steel structures are freight-intensive, while global and local suppliers compete on price, quality, delivery and engineering capability
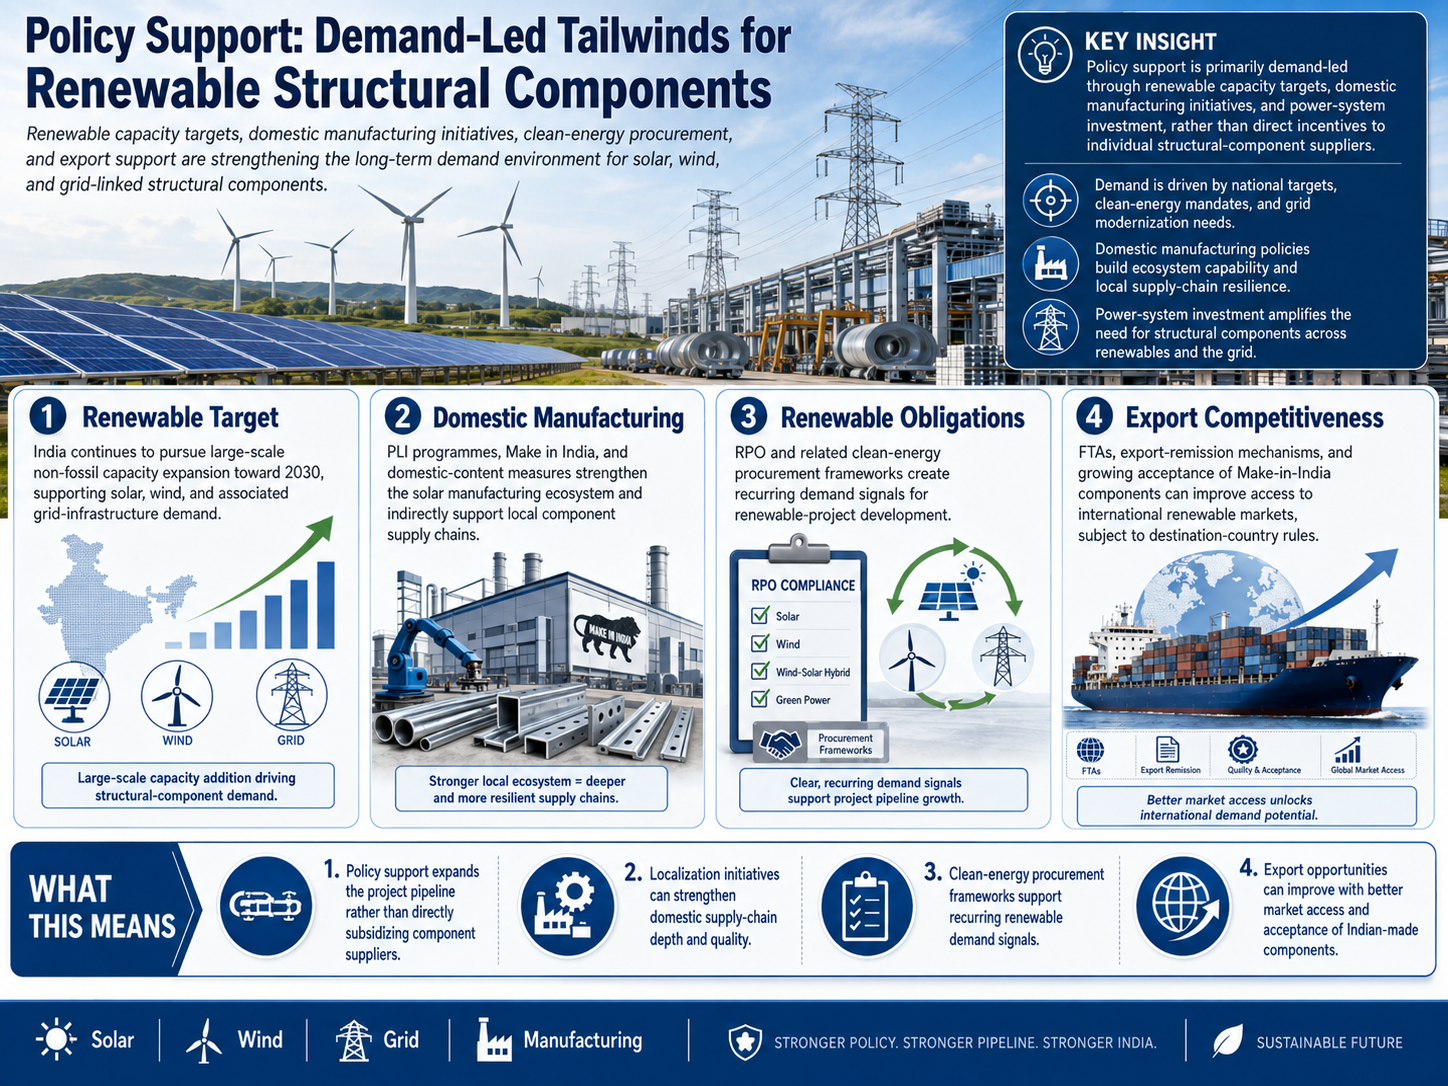
Government Policy Support
Policy support is primarily demand-led through renewable capacity targets, domestic manufacturing initiatives and power-system investment rather than direct incentives to individual structural-component suppliers. The framework supports larger solar and wind project pipelines while encouraging localization, quality standards and domestic supply-chain development.
The key policies are:
Renewable target: India continues to pursue large-scale non-fossil capacity expansion toward 2030, supporting solar, wind and associated grid infrastructure demand
Domestic manufacturing: PLI programmes, Make in India and domestic-content measures strengthen the solar manufacturing ecosystem and indirectly support local component supply chains
Renewable obligations: RPO and related clean-energy procurement frameworks create recurring demand signals for renewable project development
Export competitiveness: FTAs, export-remission mechanisms and growing acceptance of Make-in-India components can improve access to international renewable markets, subject to destination-country rules
Fundraise/Future Plans
Shareholding
Pre-issue shareholding
Promoter Holding 0.0%
Post-Issue Shareholding
Promoter Holding 0.0%
Category
Pre-Issue%Post-Issue%
Promoters
Tanveer Singh
22.2%19.1%
Rajiv Singh
22.1%19.1%
Inderjeet Singh
0.5%0.4%
Inderjeet Tanveer Singh Trust
23.7%21.7%
Inderjeet Rajiv Singh Trust
23.7%21.7%
Total Promoter Holding
92.2%82.0%
Additional Shareholders
0.0%0.0%
Total Additional Holding
0.0%0.0%
Total Shareholding
92.2%82.0%
- Overview
- Business
- Financial Highlights
- Industry Overview
- Fundraise/Future Plans
- Documentation
Get the Preqt App and keep in touch around the clock!
 Monitor your investments in real-time.
- Receive tailored deal suggestions.
- Get real-time updates and alerts.
