

Lalithaa Jewellery Mart
Jewellery for GenerationsTrust in Every Ornament
IPO Summary (Pre-QT)
Lalithaa Jewellery Mart Limited is a South India-focused, company-operated jewellery retailer with 61 stores across 51 cities and a mass-market, value-conscious positioning centred on high-purity gold jewellery. FY26 revenue from operations rose 48.1% YoY to INR 25,023.9 Cr, Operating EBITDA margin expanded to 6.7%, and PAT increased to INR 1,009.8 Cr, while FY24-FY26 revenue and PAT CAGR were 22.1% and 67.5%, respectively. At the cap price of INR 201, the IPO implies a post-issue market capitalisation of approximately INR 11,250.2 Cr and FY26 P/E of 10.0x. The investment case combines high revenue productivity per store, customer-advance-led repeat purchases and 10-store expansion, offset by 92.3% gold-revenue concentration, rising inventory intensity, negative FY26 operating cash flow and supplier/region concentration.
IPO Review Rating
Above Avg
MainboardCelebrating Life’s Moments Through Timeless Jewellery and Trusted Craftsmanship
Lalithaa combines 22.1% 2 year revenue CAGR, INR 1,009.8 Cr FY26 PAT, 41.6% ROE and an attractive 10.0x P/E versus 29.7x for peers. The major concern is FY26 operating cash flow was INR -397.8 Cr despite INR 1,009.8 Cr PAT, while working-capital days increased and inventory intensity remains high. Governance also requires monitoring because of promoter/subsidiary litigation and tax matters. The 70.6% fresh-issue component is favourable and relative valuation provides a significant cushion.
PARAMETER
WEIGHT
SCORE
KEY FACTORS
Financial Performance
40.0%
3.0/5
Revenue grew at 22.1% CAGR and FY26 PAT reached INR 1,009.8 Cr, with ROE of 41.6%. However, FY26 operating cash flow fell to INR -397.8 Cr, making cash conversion the key financial concern.
Show more
Detailed Analysis
Revenue increased from INR 16,788.1 Cr in FY24 to INR 25,023.9 Cr in FY26, representing a 22.1% CAGR, driven primarily by a sharp 48.1% YoY increase in FY26
EBITDA increased to INR 1,673.5 Cr in FY26, while margin improved from 4.1% in FY24 to 6.7% in FY26, indicating better operating efficiency despite relatively thin retail margins
PAT increased from INR 359.8 Cr in FY24 to INR 1,009.8 Cr in FY26, with PAT margin improving from 2.1% to 4.0%, reflecting substantial profitability improvement
Debt-to-equity increased moderately from 0.5x in FY24 to 0.5x in FY26, indicating manageable but gradually rising leverage
ROE increased from 26.0% in FY24 to 41.6% in FY26, supported by the sharp increase in profitability and efficient utilisation of shareholder capital
Operating cash flow deteriorated from INR 288.7 Cr in FY25 to INR -397.8 Cr in FY26, despite FY26 PAT of INR 1,009.8 Cr, indicating weak cash conversion and higher working-capital absorption
Industry
15.0%
3.0/5
The core South Indian market is expected to grow at 6–7% CAGR, while organised chains continue gaining market share. Lalithaa benefits from formalisation but remains exposed to gold-price volatility, regulation and regional concentration.
Show more
Detailed Analysis
The South Indian gems and jewellery market is expected to increase from approximately INR 5,02,600.0 Cr in FY26 to INR 6,20,000.0–6,60,000.0 Cr by FY30, representing 6–7% CAGR
Jewellery chains already account for approximately 54–59% of the South Indian market in FY26, with their share expected to rise further by FY30, indicating continuing formalisation from standalone to organised retailers
Lalithaa held approximately 5.2% of India's organised jewellery market and 5.0% of the South Indian market in FY26
Mandatory hallmarking and HUID support organised jewellers, but the effective gold import duty increased from 6.0% to 15.0% in May 2026, increasing gold-price, affordability and working-capital risks
Management
15.0%
4.0/5
The promoter has more than 27 years of operating experience, Board independence is 50.0%, and RPTs are only around 1.7% of revenue. The primary governance concern is outstanding promoter/subsidiary litigation and tax proceedings.
Show more
Detailed Analysis
M. Kiran Kumar Jain has been associated with the Company since 1999, providing more than 27 years of direct operating experience across marketing, strategy, finance and store operations
The Board comprises 6 directors, including 3 independent directors, resulting in 50.0% independent representation and a reasonably balanced governance structure
No promoter shares are pledged, but the promoter is involved in a pending criminal proceeding and promoter tax claims aggregate approximately INR 27.0 Cr, reducing governance comfort
FY26 operating/P&L-related RPTs are estimated at approximately INR 419.3 Cr, equivalent to only 1.7% of revenue, keeping transaction intensity within a relatively low range
Valuation
20.0%
5.0/5
Valuation is highly attractive at approximately 10.0x P/E versus 29.7x for peers, while RoNW stands at 39.9%. The 70.6% fresh-issue component further supports the valuation case.
Show more
Detailed Analysis
At INR 201.0 per share, Lalithaa is valued at approximately 10.0x FY26 earnings versus the peer average of 29.7x, representing a substantial 66.5% discount
Lalithaa's estimated EV/EBITDA is approximately 6.7x versus around 20.2x for the reconstructed peer average, indicating a material relative valuation discount
At INR 201.0, the Company is valued at approximately 3.4x FY26 NAV of INR 58.6 per share, which is moderate relative to its high RoNW
RoNW increased from 24.2% in FY24 to 39.9% in FY26, demonstrating strong capital efficiency and supporting a premium to book value
Merchant Banker Track Record
10.0%
4.0/5
The selected BRLM sample generated approximately 12.2% average listing returns, 42.4x subscription and an 83.3% positive-listing rate. The banker consortium is therefore a supportive, though not decisive, factor.
Show more
Detailed Analysis
The representative recent IPO sample of Anand Rathi Advisors and Equirus Capital generated an average listing return of approximately 12.2%, indicating a reasonably positive recent execution record
The selected recent IPO mandates recorded average subscription of approximately 42.4x, suggesting historically strong investor demand across the representative sample
Approximately 5 of the 6 selected IPOs listed positively, resulting in an estimated success rate of 83.3%
The IPO is managed by 2 established domestic BRLMs — Anand Rathi Advisors and Equirus Capital, with meaningful mainboard transaction experience
TOTAL
100%
3.6/5
Weighted Composite Score
Issue Price
₹190.0 to ₹201.0
As of 29 Aug 2026
GMP
₹41.5
As of 29 Aug 2026
Estimated Gain / Loss
+20.6%
Lot Size
74.0 Shares
Grey Market Premium (GMPs) are shared for knowledge purpose only. PrEqt doesn’t promote or execute the trades.
| Issue size | |
|---|---|
| Overall | ₹1,700.0 Cr |
| Fresh Issue | ₹1,200.0 Cr |
| Offer for Sale | ₹500.0 Cr |
Minimum Investment
₹14,874.0 / 5,476 shares

Merchant Banker
Anand Rathi Advisors Ltd.; Equirus Capital
IPO Document
RHP / Anchor Document
Offer Start Date
17th Aug 2026
Offer End Date
19th Aug 2026
Valuation
₹11,250.2 Cr
Revenue FY'26
₹25,039.8 Cr
PAT (FY'26)
₹1,009.8 Cr
Issue Size
₹1,700.0 Cr
Face Value
₹ 5.0Offer Price
₹ 201.0Lot Size
74.0 sharesSale Type
Fresh capital cum OFSPAT (FY'26)
₹ 1,009.8 CrPAT Margin (FY'26)
4.0 %P/E Multiple
10.0xEBITDA (FY'26)
₹ 1,673.5 CrCAGR Growth 3Y
22.1 %ROE (FY'26)
41.6 %ROCE (FY'26)
42.6 %Price to Book Value
3.4xDebt/Equity
0.5xCompany Website
www.lalithaajewellery.comExplore new deals
Overview
Fund Allocation
Total: ₹0 CrSource:Company DRHP
Timeline
IPO Open Date
To Be Announced
IPO Close Date
To Be Announced
Tentative Allotment
To Be Announced
Initiation of Refunds
To Be Announced
Credit of Shares to Demat
To Be Announced
Tentative Listing Date
To Be Announced
Business
Products
Business Model
Geographical Presence
Sales Channel
Financial Highlights
Income Statement
Revenue growth with EBITDA and PAT margins
| Financial Metric | FY 2024 | FY 2025 | FY 2026 |
|---|---|---|---|
| Revenue (₹ Cr) | 16,800.6 | 16,907.9 | 25,039.8 |
| Growth (%) | 26.2% | 0.7% | 48.1% |
| EBITDA (₹ Cr) | 680.2 | 740.4 | 1,673.5 |
| EBITDA Margin (%) | 4.1% | 4.4% | 6.7% |
| PAT (₹ Cr) | 359.8 | 364.7 | 1,009.8 |
| PAT Margin (%) | 2.1% | 2.2% | 4.0% |
OBSERVATIONS & INSIGHTS
Revenue grew 26.2% in FY24, only 0.7% in FY25, and 48.1% in FY26. Store count rose only from 60 to 61 in FY26, so the acceleration reflects stronger revenue/store, customer demand and the higher rupee value of gold inventory/sales rather than network expansion alone
EBITDA increased from INR 680.2 Cr in FY24 to INR 1,673.5 Cr in FY26 and margin expanded from 4.1% to 6.7%. Higher scale and store productivity more than offset higher employee, manufacturing and financing costs
PAT increased from INR 359.8 Cr in FY24 to INR 1,009.8 Cr in FY26, taking PAT margin to 4.0% from 2.1%. FY24-FY26 PAT CAGR of 67.5% indicates strong operating leverage but also makes FY26 a high base for future comparison
Balance Sheet
| Financial Metric | FY 2024 | FY 2025 | FY 2026 |
|---|---|---|---|
| Net Worth | ₹ 1,564.4 Cr | ₹ 1,925.4 Cr | ₹ 2,929.7 Cr |
| Total Assets | ₹ 5,182.3 Cr | ₹ 6,929.7 Cr | ₹ 10,945.1 Cr |
| Total Borrowing | ₹ 824.2 Cr | ₹ 949.3 Cr | ₹ 1,604.1 Cr |
| Reserves & Surplus | ₹ 1,552.5 Cr | ₹ 1,675.4 Cr | ₹ 2,679.7 Cr |
OBSERVATIONS & INSIGHTS
Total assets more than doubled from FY24 to FY26, primarily because inventory increased by INR 5,524.2 Cr
Equity increased to INR 2,929.7 Cr through retained earnings, partially containing leverage even as borrowings rose
Cash Flow
| Financial Metric | FY 2023 | FY 2024 | FY 2025 |
|---|---|---|---|
CFO (₹ Cr) Cash generated from core business operations. | -18.0 Cr | +288.7 Cr | -397.8 Cr |
CFI (₹ Cr) Cash used for investments and long-term assets. | -112.3 Cr | -215.1 Cr | -66.2 Cr |
CFF (₹ Cr) Cash flow related to funding and borrowings. | +135 Cr | -44.1 Cr | +427.7 Cr |
Working Capital
| Efficiency Metric | FY 2023 | FY 2024 | FY 2025 |
|---|---|---|---|
Debtor Days Average number of days taken to collect customer payments. | - | - | - |
Creditor Days Average time taken to pay suppliers and vendors. | - | - | - |
Inventory Days Average number of days inventory remains unsold. | - | - | - |
CCC (Cash Conversion Cycle) (Debtor Days + Inventory Days - Creditor Days) | - | - | - |
Financial Ratios
Measures the company’s leverage relative to shareholder equity.
OBSERVATIONS & INSIGHTS
Current Ratio remained stable around 1.34x-1.39x even as inventory expanded; the current-asset base is dominated by jewellery inventory
Interest coverage improved sharply in FY26 to 7.85x as EBIT growth outpaced finance-cost growth
ROA nearly doubled in FY26 to 11.3% despite substantial balance-sheet growth, indicating strong earnings productivity on the enlarged asset base
FY26 ROE of 41.6% and ROCE of 42.6% were the highest among the FY26 peers highlighted by CRISIL, reflecting strong earnings relative to the capital base
Industry Overview
Industry Drivers
Industry Tailwind: Formalisation and Scale-Up of Organised Jewellery Retail
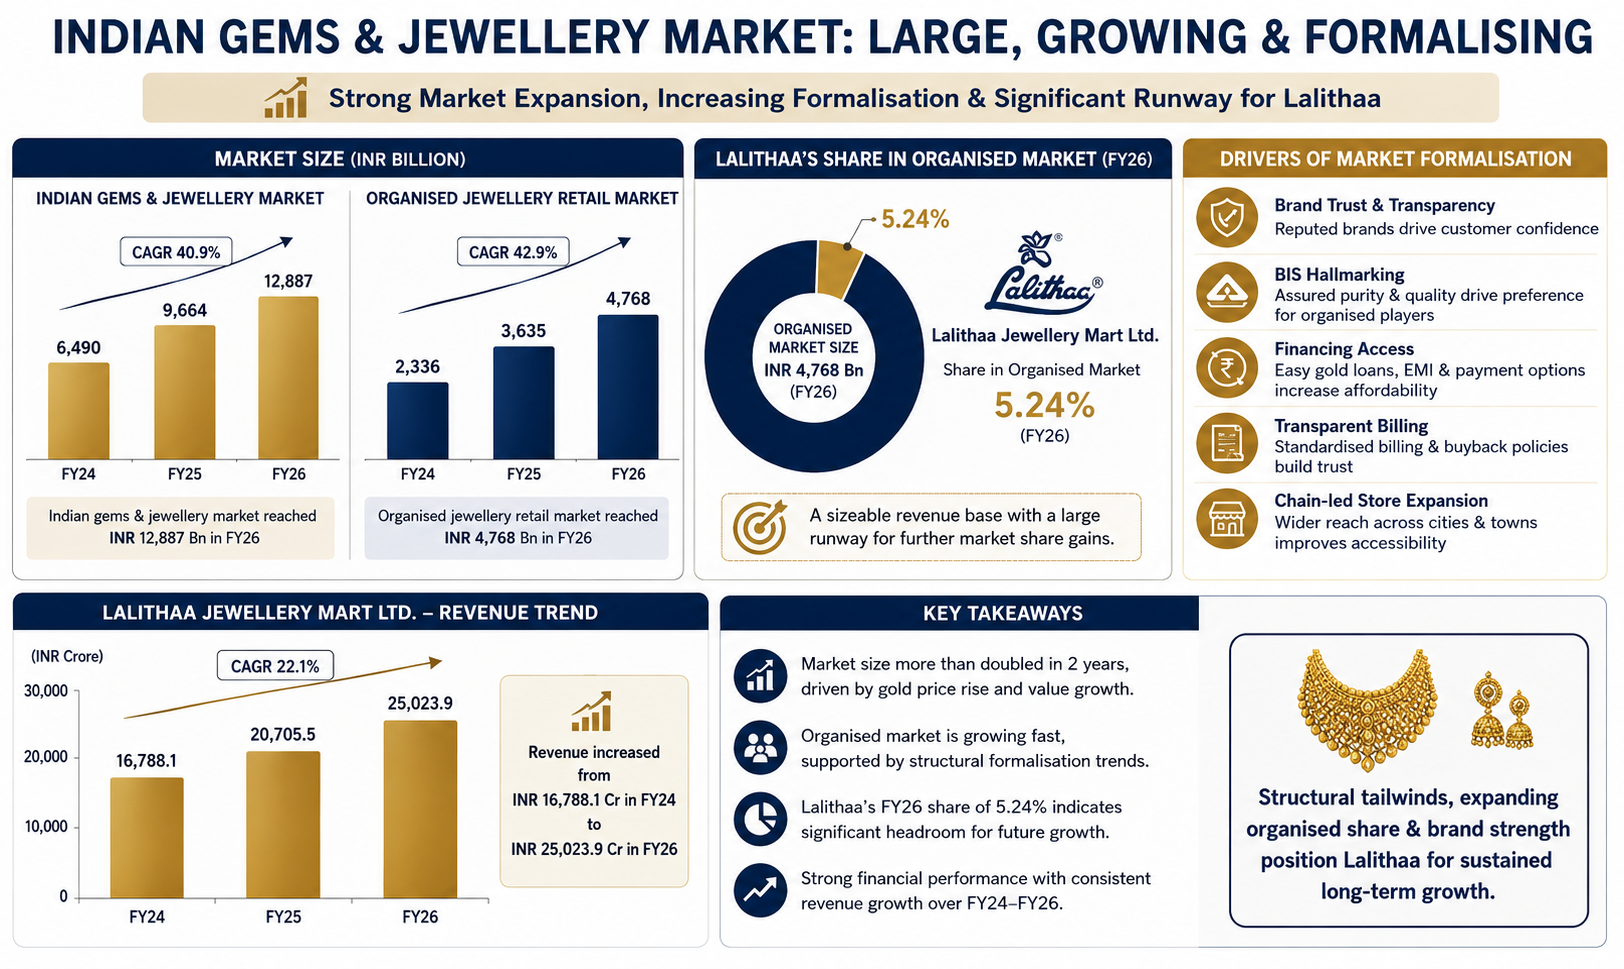
India’s gems and jewellery market reached approximately INR 12,887 Bn in FY26, while organised jewellery retail was approximately INR 4,768 Bn. Formalisation is supported by brand trust, hallmarking, financing access, transparent billing and chain-led store expansion. Lalithaa’s FY26 share was approximately 5.24% of the organised market, leaving a large runway despite its already sizeable revenue base.
The key tailwinds are:
Indian gems and jewellery market expanded from INR 6,490 Bn in FY24 to INR 12,887 Bn in FY26, partly reflecting higher gold prices and value growth
Organised market expanded from INR 2,336 Bn in FY24 to INR 4,768 Bn in FY26
Lalithaa revenue increased from INR 16,788.1 Cr in FY24 to INR 25,023.9 Cr in FY26
South India Depth and Tier-II / Tier-III Consumption
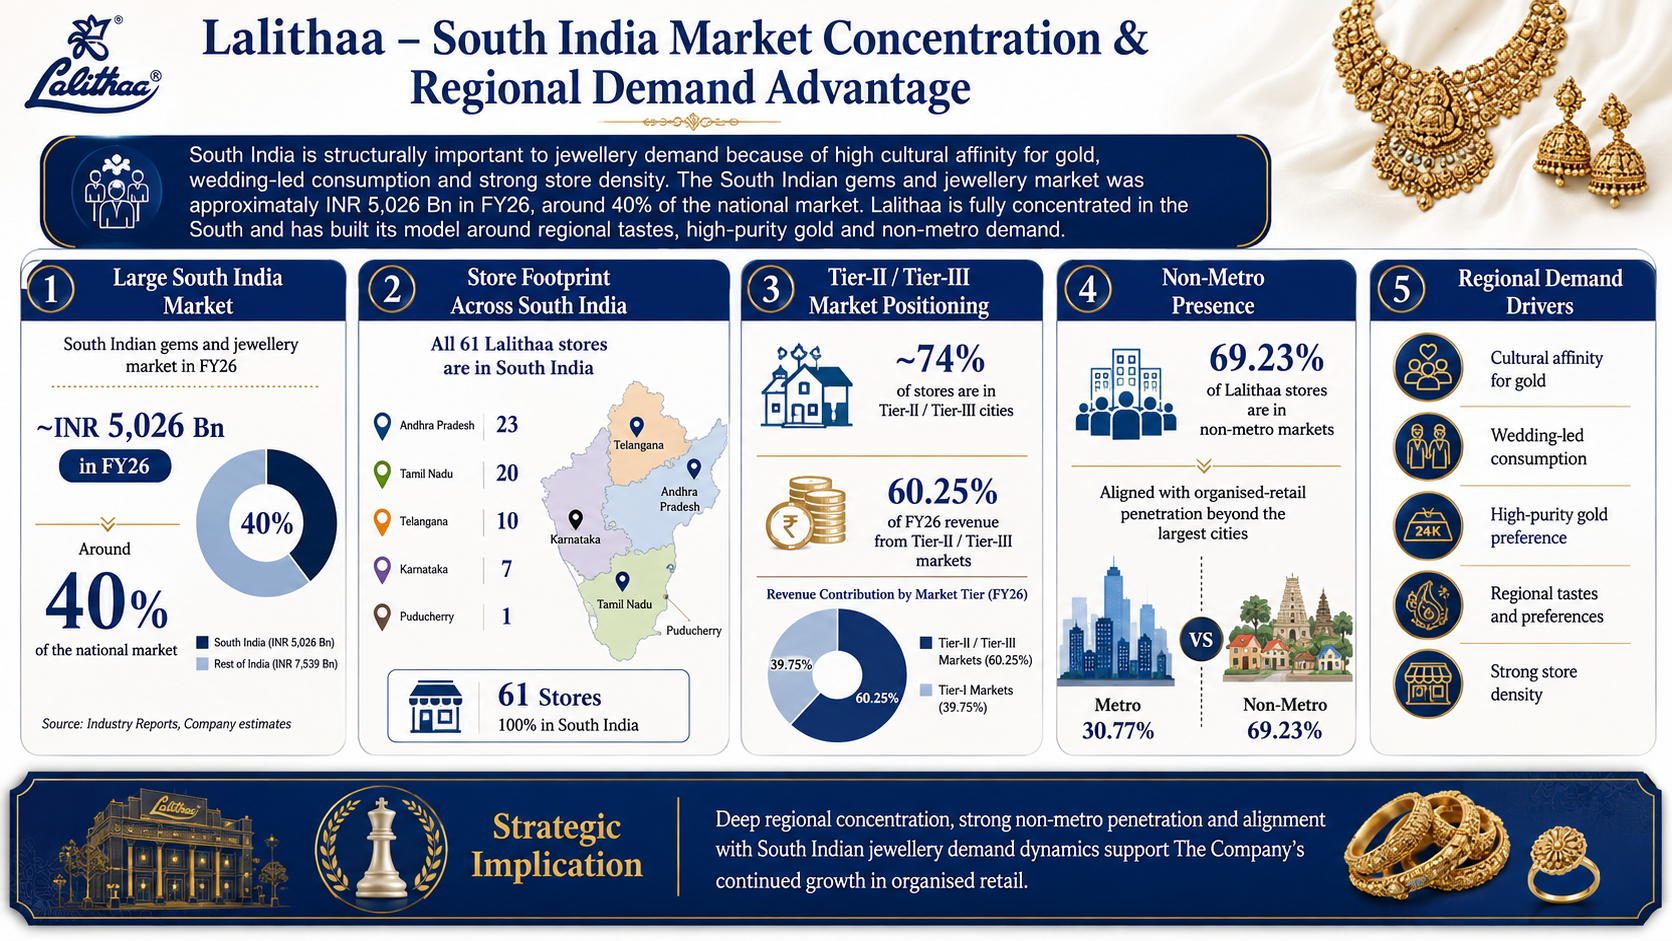
South India is structurally important to jewellery demand because of high cultural affinity for gold, wedding-led consumption and strong store density. The South Indian gems and jewellery market was approximately INR 5,026 Bn in FY26, around 40% of the national market. Lalithaa is fully concentrated in the South and has built its model around regional tastes, high-purity gold and non-metro demand.
The key details are
All 61 Lalithaa stores are in South India: Andhra Pradesh 23, Tamil Nadu 20, Telangana 10, Karnataka 7 and Puducherry 1
Approximately 74% of stores are in Tier-II/Tier-III cities and these markets contributed 60.25% of FY26 revenue
69.23% of Lalithaa stores are in non-metro markets, consistent with organised-retail penetration beyond the largest cities
Tamil Nadu remains the largest state, contributing 53.98% of FY26 revenue
Weddings, Festivals, Savings Behaviour and Customer Purchase Schemes
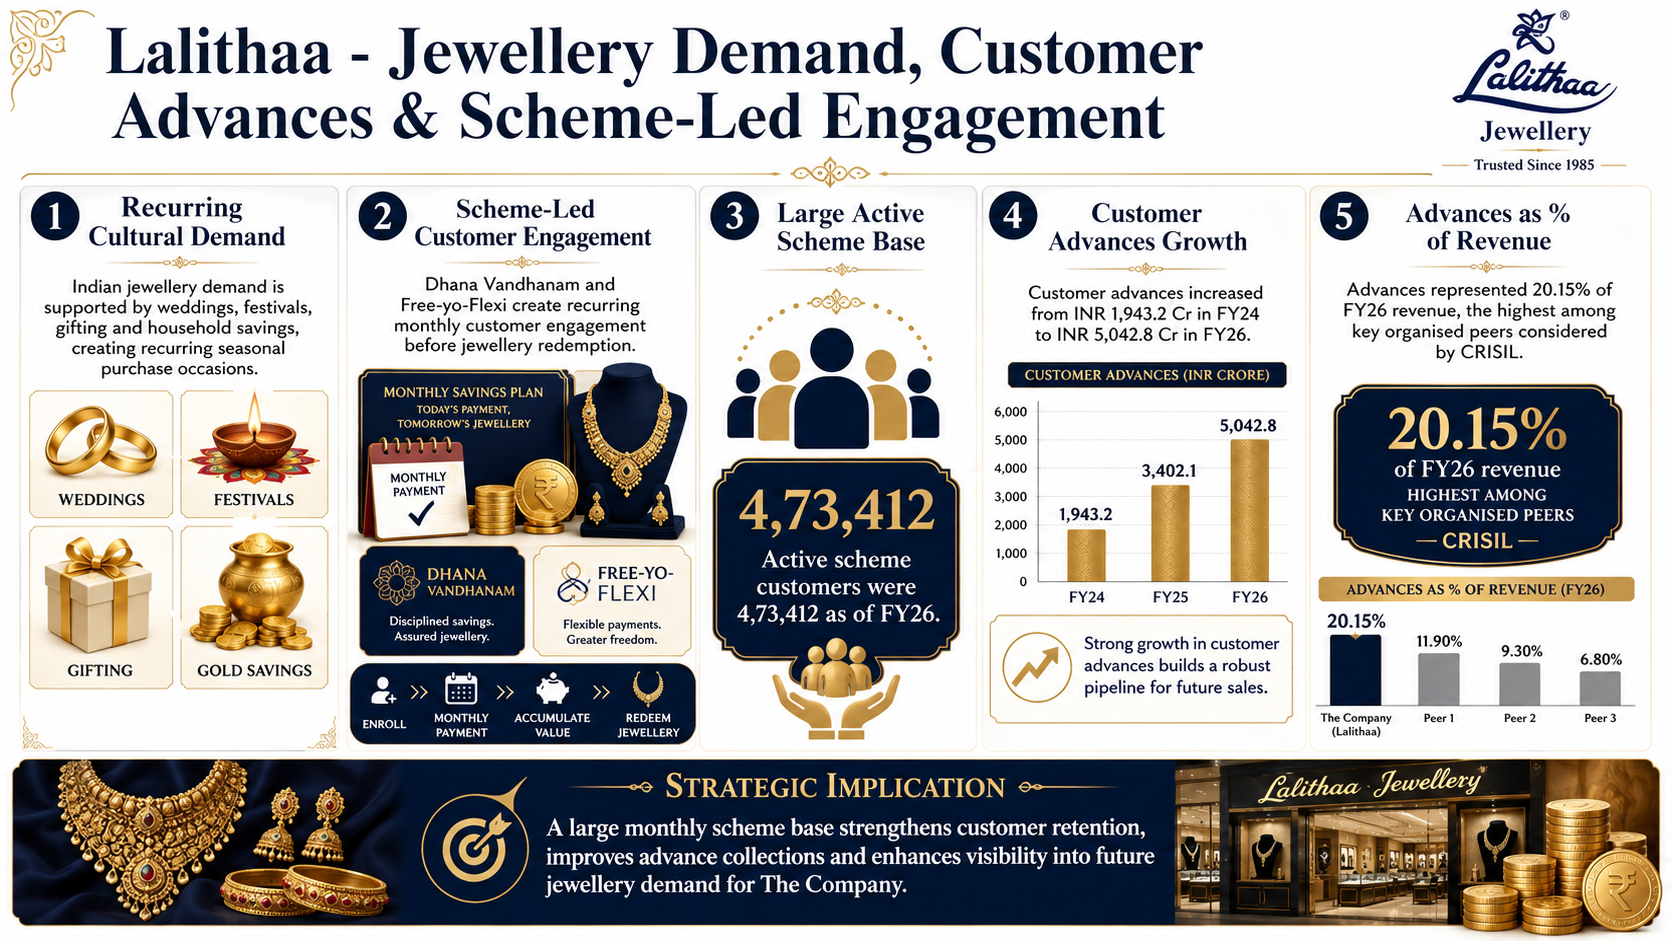
Jewellery demand in India is tied to weddings, festivals, gifting and household savings, creating recurring seasonal purchase occasions. Monthly jewellery-purchase schemes can convert this cultural demand into a more visible future sales funnel by collecting advances and improving customer retention. Lalithaa has built a particularly large scheme base relative to peers
The key details are:
Dhana Vandhanam and Free-yo-Flexi create recurring monthly customer engagement before jewellery redemption
Active scheme customers were 4,73,412 as of FY26
Customer advances increased from INR 1,943.2 Cr in FY24 to INR 5,042.8 Cr in FY26
Advances represented 20.15% of FY26 revenue, the highest among key organised peers considered by CRISIL
Risks in the Industry
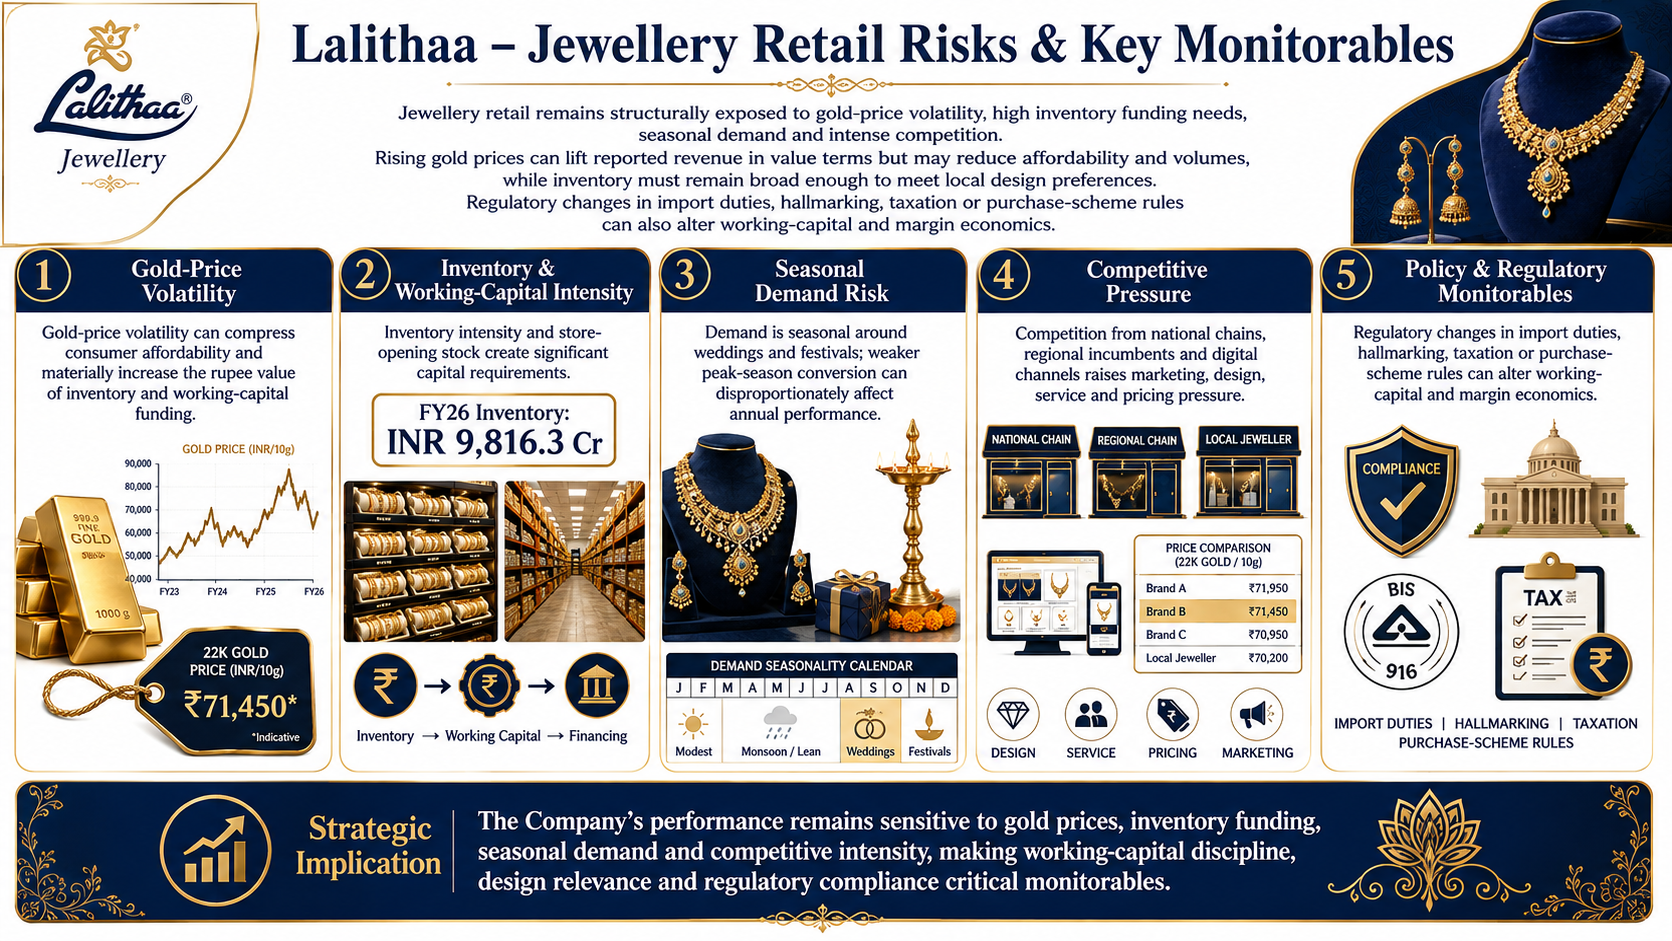
Jewellery retail remains structurally exposed to gold-price volatility, high inventory funding needs, seasonal demand and intense competition. Rising gold prices can lift reported revenue in value terms but may reduce affordability and volumes, while inventory must remain broad enough to meet local design preferences. Regulatory changes in import duties, hallmarking, taxation or purchase-scheme rules can also alter working-capital and margin economics
The key risks are:
Gold-price volatility can compress consumer affordability and materially increase the rupee value of inventory and working-capital funding
Inventory intensity and store-opening stock create significant capital requirements; Lalithaa’s FY26 inventory was INR 9,816.3 Cr
Demand is seasonal around weddings and festivals; weaker peak-season conversion can disproportionately affect annual performance
Competition from national chains, regional incumbents and digital channels raises marketing, design, service and pricing pressure
Government Policy Support
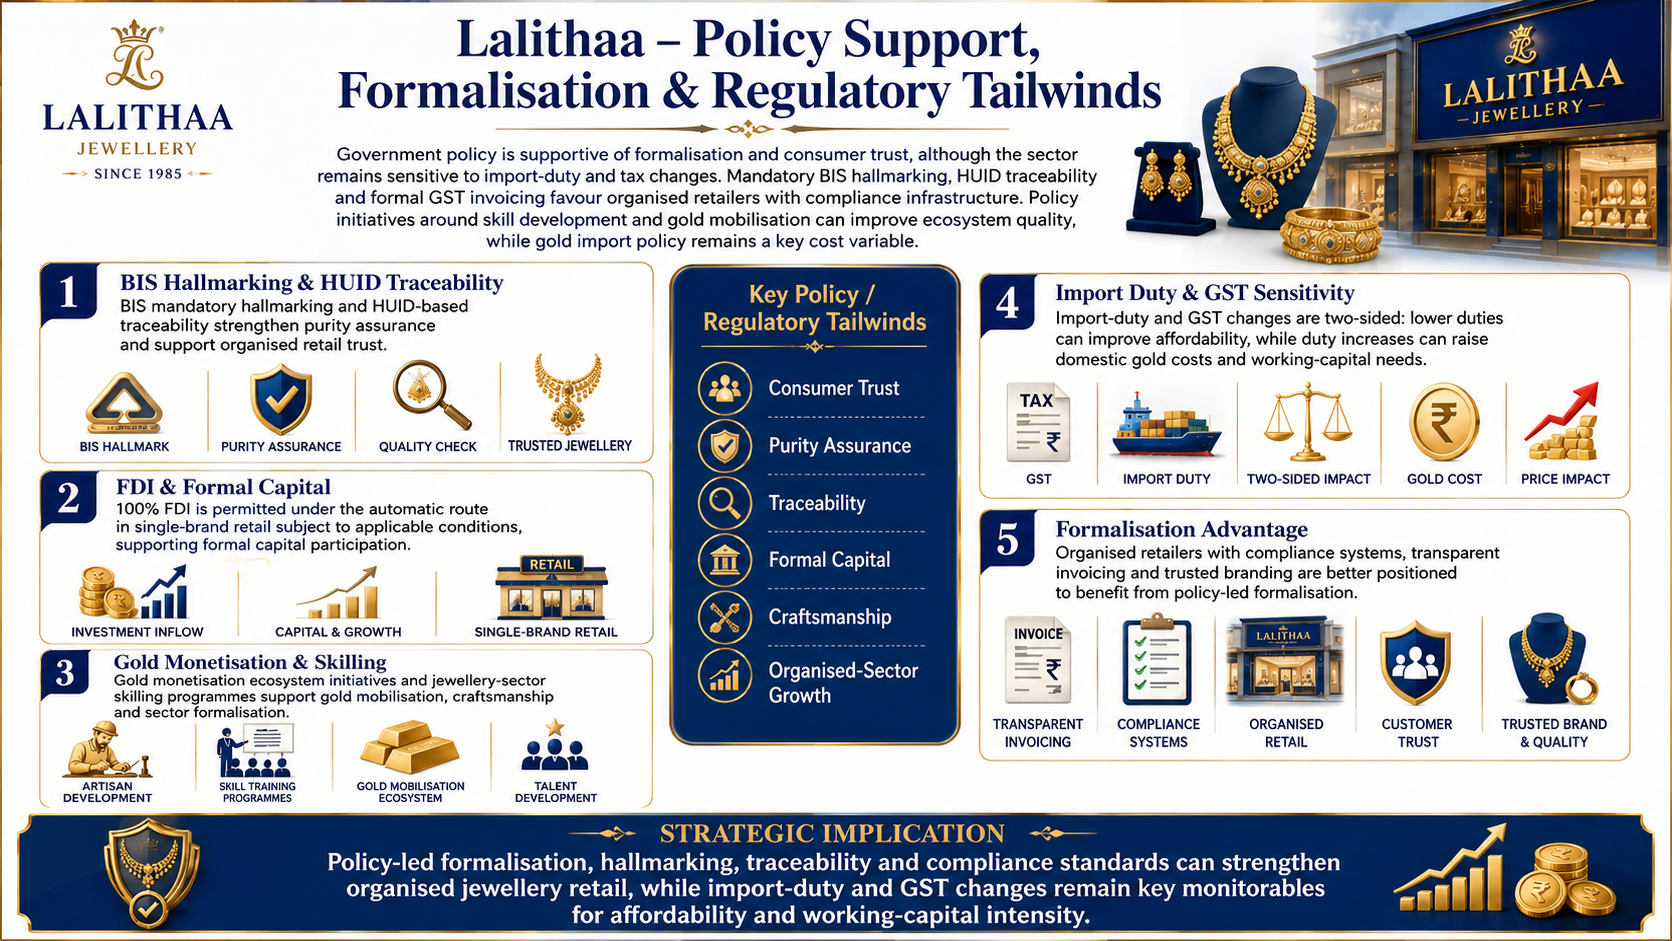
Government policy is supportive of formalisation and consumer trust, although the sector remains sensitive to import-duty and tax changes. Mandatory BIS hallmarking, HUID traceability and formal GST invoicing favour organised retailers with compliance infrastructure. At the same time, policy initiatives around skill development and gold mobilisation can improve ecosystem quality, while gold import policy remains a key cost variable
The key policies are:
BIS mandatory hallmarking and HUID-based traceability strengthen purity assurance and support organised retail trust
100% FDI is permitted under the automatic route in single-brand retail subject to applicable conditions, supporting formal capital participation
Gold Monetisation / ecosystem initiatives and jewellery-sector skilling programmes support mobilisation, craftsmanship and formalisation
Import-duty and GST changes remain two-sided: lower duties can improve affordability, while duty increases can raise domestic gold costs and working-capital needs
Fundraise/Future Plans
Shareholding
Pre-issue shareholding
Promoter Holding 0.0%
Post-Issue Shareholding
Promoter Holding 0.0%
Category
Pre-Issue%Post-Issue%
Promoters
M. Kiran Kumar Jain
97.7%82.8%
Hemaa Kiran Kumar Jain
0.0%0.0%
Total Promoter Holding
97.7%82.8%
Additional Shareholders
0.0%0.0%
Total Additional Holding
0.0%0.0%
Total Shareholding
97.7%82.8%
- Overview
- Business
- Financial Highlights
- Industry Overview
- Fundraise/Future Plans
- Documentation
Get the Preqt App and keep in touch around the clock!
 Monitor your investments in real-time.
- Receive tailored deal suggestions.
- Get real-time updates and alerts.
