

LCC Projects
Engineering Water InfrastructureInfrastructure That Sustains
IPO Summary (PrEqT)
LCC Projects Limited is a multidisciplinary engineering, procurement and construction (EPC) company with its core franchise in irrigation and water-supply infrastructure. FY26 revenue increased 23.4% to INR 3,600.3 Cr, EBITDA rose to INR 519.9 Cr and PAT to INR 286.4 Cr; ROE was 32.2% and ROCE 27.1%. The March 2026 order book stood at INR 7,953.2 Cr across 103 projects, equivalent to 2.2x FY26 revenue, although irrigation and water-supply projects still represented 83.3% of the order book and government departments 79.1%. Operating cash flow improved sharply to INR 158.4 Cr in FY26, but working-capital days increased to 67, trade receivables reached INR 455.8 Cr and unbilled revenue was INR 534.8 Cr. The marketed IPO comprises an INR 258.0 Cr fresh issue and an OFS of approximately INR 169.1 Cr at the cap price; INR 180.0 Cr of fresh proceeds is earmarked for debt repayment and INR 14.7 Cr for equipment. At INR 139.0-INR 146.0 per share, the offer implies P/E of 14.8x and post-issue market capitalization of INR 4,026.4- INR 4229.2 Cr.
IPO Review Rating
Buy
MainboardEngineering Critical Water Infrastructure for India’s Sustainable Growth
LCC Projects has demonstrated strong financial growth, with Revenue increasing from INR 2,438.9 Cr in FY24 to INR 3,600.3 Cr in FY26, representing a 21.5% CAGR, while PAT grew at a much faster 53.2% CAGR. Profitability has strengthened consistently, with EBITDA Margin expanding from 9.9% to 14.4% and PAT Margin from 5.0% to 8.0% over FY24–FY26. The Company had an FY26 Order Book of approximately INR 7,953.2 Cr, equivalent to around 2.2x FY26 Revenue, providing meaningful medium-term execution visibility. Operating cash flow improved materially to INR 158.4 Cr in FY26, although Total Debt remains sizeable at INR 860.7 Cr and continued working-capital discipline will remain important. LCC operates in a Growth Phase irrigation and water-infrastructure market, supported by approximately 10.9% sector CAGR and continued government investment in irrigation, drinking-water and infrastructure programmes. The key concentration risk is dependence on public-sector customers: 89.3% of FY26 Revenue came from government departments, while the Top-10 customers contributed 72.3%. Management has substantial sector experience, promoter shares are unpledged and promoter-group ownership remains high post issue, although the 39.6% OFS represents meaningful promoter monetisation. LCC Projects presents a strong growth and order-book-led infrastructure proposition with improving profitability and reasonable peer-relative valuation.
PARAMETER
WEIGHT
SCORE
KEY FACTORS
Financial Performance
40.0%
4.0/5
LCC Projects has demonstrated a strong financial trajectory, with Revenue growing at 21.5% CAGR and PAT at a significantly faster 53.2% CAGR over FY24–FY26.
Show more
Detailed Analysis
Revenue increased from INR 2,438.9 Cr in FY24 to INR 2,918.3 Cr in FY25 and INR 3,600.3 Cr in FY26, representing a 21.5% FY24–FY26 CAGR
EBITDA increased from INR 241.4 Cr in FY24 to INR 401.0 Cr in FY25 and INR 519.9 Cr in FY26, while EBITDA Margin expanded from 9.9% to 13.7% and 14.4%, respectively
PAT increased from INR 122.0 Cr in FY24 to INR 223.6 Cr in FY25 and INR 286.4 Cr in FY26, representing a 53.2% CAGR, while PAT Margin improved from 5.0% to 7.7% and 8.0%
D/E stood at 1.1x in FY24, 1.2x in FY25 and 1.0x in FY26. Total Debt increased to INR 860.7 Cr in FY26, although leverage improved relative to FY25 as the equity base strengthened
ROE remained high at 31.9% in FY24, 37.0% in FY25 and 32.2% in FY26, while FY26 ROCE stood at 27.1%
OCF was INR 29.4 Cr in FY24, INR 23.6 Cr in FY25 and INR 158.4 Cr in FY26, with FY26 cash generation improving materially despite higher receivables and financial assets
The largest customer contributed 20.0% of FY26 Revenue, while the Top-3 and Top-10 customers contributed 43.3% and 72.3%, respectively. Top-3 concentration has nevertheless improved from 64.2% in FY24
Industry
15.0%
3.0/5
LCC operates in a Growth Phase infrastructure segment, with India's irrigation market projected to grow at approximately 10.9% CAGR.
Show more
Detailed Analysis
India's irrigation sector is projected to grow at approximately 10.9% CAGR during FY23–FY28, supported by increasing investment in irrigation, water management and rural infrastructure. PMKSY carries an overall outlay of approximately INR 93,069.0 Cr
Irrigation and water infrastructure remain in a structural growth phase, supported by government capex, Jal Jeevan Mission, PMKSY, river-interlinking programmes and increasing water-management requirements. Public infrastructure capex increased from approximately INR 2.0 lakh Cr in FY15 to INR 12.2 lakh Cr in the FY27 Budget
The EPC market includes established water and infrastructure players such as Enviro Infra Engineers, Vishnu Prakash R Punglia and JWIL Infra. LCC's scale and order book provide differentiation, but project awards remain dependent on competitive tendering and execution credentials
Projects remain exposed to land acquisition, right-of-way, environmental clearances, regulatory approvals, project-design changes and execution delays, which can cause cost overruns or delayed collections
Management
15.0%
4.0/5
LCC is led by experienced promoters with 16–28+ years of operating experience, supported by a Board with 50.0% independent representation.
Show more
Detailed Analysis
Chairman & MD Arjan Suja Rabari has 28+ years of industry experience, while Managing Director Laljibhai Arjanbhai Ahir has 16+ years of experience, providing substantial execution and project-management experience
The Board comprises 6 Directors, including 3 Independent Directors, resulting in 50.0% independent representation
No promoter shares are pledged or encumbered, and no criminal, tax, regulatory or material civil proceedings are disclosed against the Promoters. The Company itself has 12 tax proceedings involving INR 12.2 Cr and other civil matters
FY26 KMP remuneration and bonuses were approximately INR 27.7 Cr, while promoter/KMP loans were also received and largely repaid during the year. A INR 82.7 Cr subcontracting transaction with subsidiary LCC Engineering is eliminated on consolidation
Valuation
20.0%
4.0/5
LCC's valuation appears reasonable relative to its closest profitable listed peer. At the upper price band, the Company is valued at 14.8x FY26 PAT, approximately 22.9% below Enviro Infra Engineers' 19.1x P/E.
Show more
Detailed Analysis
LCC is valued at 14.8x P/E, compared with 19.1x for listed peer Enviro Infra Engineers, implying an approximately 22.9% discount
Against FY26 EBITDA of INR 519.9 Cr, LCC is valued at 9.5x EV/EBITDA, versus approximately 11.9x currently for Enviro Infra Engineers
At INR 146.0 against FY26 NAV of INR 32.7 per share, LCC is valued at approximately 4.5x P/B
FY26 RoNW stood at 32.2%
Merchant Banker Track Record
10.0%
5.0/5
Motilal Oswal brings substantial Mainboard IPO execution depth, with 37 transactions across the disclosed FY25–FY27 period.
Show more
Detailed Analysis
Across the latest 10 IPOs disclosed in the RHP, average listing-opening return was approximately 16.4%, with outcomes ranging from -11.2% to +43.4%.
8 of the latest 10 disclosed IPOs, or approximately 80.0%, opened above their respective issue prices.
Recent Motilal Oswal-managed IPOs have seen strong demand, including Symbiotec Pharmalab at 71.3x and Kusumgar at 128.9x overall subscription; Lumino Industries also received strong investor participation.
Motilal Oswal handled 9 IPOs in FY27 YTD, 21 IPOs in FY26 and 7 IPOs in FY25, representing 37 IPOs across the disclosed review period.
TOTAL
100%
4.0/5
Weighted Composite Score
Issue Price
₹139.0 to ₹146.0
As of 5 Sep 2026
GMP
₹15.0
As of 5 Sep 2026
Estimated Gain / Loss
+10.3%
Lot Size
102.0 Shares
Grey Market Premium (GMPs) are shared for knowledge purpose only. PrEqt doesn’t promote or execute the trades.
| Issue size | |
|---|---|
| Overall | ₹427.0 Cr |
| Fresh Issue | ₹258.0 Cr |
| Offer for Sale | ₹169.0 Cr |
Minimum Investment
₹14,892.0 / 10,404 shares

Merchant Banker
Motilal Oswal Investment Advisors Ltd.
IPO Document
RHP / Anchor Document
Offer Start Date
9th Sept 2026
Offer End Date
11th Sept 2026
Valuation
₹4,229.2 Cr
Revenue (FY'26)
₹3,639.5 Cr
PAT (FY'26)
₹286.4 Cr
Issue Size
₹427.0 Cr
Face Value
₹ 5.0Offer Price
₹ 146.0Lot Size
102.0 sharesSale Type
Fresh capital cum OFSPAT (FY'26)
₹ 286.4 CrPAT Margin (FY'26)
8.0 %P/E Multiple
14.8xEBITDA (FY'26)
₹ 519.9 CrCAGR Growth 3Y
21.9 %ROE (FY'26)
32.2 %ROCE (FY'26)
27.1 %Price to Book Value
4.5xDebt/Equity
1.0xCompany Website
www.lccprojects.comExplore new deals
Overview
Fund Allocation
Total: ₹0 CrSource:Company DRHP
Timeline
IPO Open Date
To Be Announced
IPO Close Date
To Be Announced
Tentative Allotment
To Be Announced
Initiation of Refunds
To Be Announced
Credit of Shares to Demat
To Be Announced
Tentative Listing Date
To Be Announced
Business
Business Model
Geographical Presence
Sales Channel
Key Risk Factor
Financial Highlights
Income Statement
Revenue growth with EBITDA and PAT margins
| Financial Metric | FY 2024 | FY 2025 | FY 2026 |
|---|---|---|---|
| Revenue (₹ Cr) | 2,449.8 | 2,941.0 | 3,639.5 |
| Growth (%) | 99.0% | 19.7% | 23.4% |
| EBITDA (₹ Cr) | 241.4 | 401.0 | 519.9 |
| EBITDA Margin (%) | 9.9% | 13.7% | 14.4% |
| PAT (₹ Cr) | 122.0 | 223.6 | 286.4 |
| PAT Margin (%) | 5.0% | 7.7% | 8.0% |
OBSERVATIONS & INSIGHTS
FY26 revenue rose 23.4% to INR 3,600.3 Cr, primarily from execution of Sondwa Lift Micro Irrigation, Diyodar-Lakhni pipeline, Sidhi Bansagar and Khavda Solar projects disclosed in the MD&A
EBITDA Margin expanded to 14.4% from 13.7% as revenue growth slightly outpaced core construction costs; FY25 expansion was stronger because construction expense rose only 15.9% versus 19.7% revenue growth. EBITDA increased 29.6% in FY26 to INR 519.9 Cr because revenue grew 23.4% while construction expense rose 22.8%, employee cost 19.3% and finance cost 20.0%, creating operating leverage
PAT Margin improved to 8.0% from 7.7% because PBT margin increased to 10.4% from 10.0%; the gain was modest as depreciation and finance costs also increased with scale. PAT increased 28.1% to INR 286.4 Cr as higher project revenue and operating margin lifted PBT; this more than offset a 20.0% rise in finance cost and 31.5% rise in tax expense
Balance Sheet
| Financial Metric | FY 2024 | FY 2025 | FY 2026 |
|---|---|---|---|
| Net Worth | ₹ 383.4 Cr | ₹ 606.8 Cr | ₹ 893.2 Cr |
| Total Assets | ₹ 1,130.0 Cr | ₹ 1,727.5 Cr | ₹ 2,447.5 Cr |
| Total Borrowing | ₹ 421.6 Cr | ₹ 746.8 Cr | ₹ 860.7 Cr |
| Reserves & Surplus | ₹ 348.8 Cr | ₹ 469.0 Cr | ₹ 752.4 Cr |
OBSERVATIONS & INSIGHTS
Total assets increased 41.7% to INR 2,447.5 Cr, mainly because the project working-capital base expanded across receivables, retention money, unbilled revenue and bank balances
Total borrowings increased to INR 794.4 Cr and represented 92.3% of gross debt, reflecting reliance on cash-credit / working-capital facilities and supplier-financing arrangements
Cash Flow
| Financial Metric | FY 2024 | FY 2025 | FY 2026 |
|---|---|---|---|
CFO in Cr Cash generated from core business operations. | +29.4 Cr | +23.6 Cr | +158.4 Cr |
CFI in Cr Cash used in / generated from investing activities. | -129.5 Cr | +195.2 Cr | -106.8 Cr |
CFF in Cr Cash from / used in financing activities. | +83.5 Cr | +252.5 Cr | +17.7 Cr |
Working Capital
| Efficiency Metric | FY 2023 | FY 2024 | FY 2025 |
|---|---|---|---|
Debtor Days Average number of days taken to collect customer payments. | - | - | - |
Creditor Days Average time taken to pay suppliers and vendors. | - | - | - |
Inventory Days Average number of days inventory remains unsold. | - | - | - |
CCC (Cash Conversion Cycle) (Debtor Days + Inventory Days - Creditor Days) | - | - | - |
Financial Ratios
Measures the company’s leverage relative to shareholder equity.
OBSERVATIONS & INSIGHTS
ROE declined to 32.2% from 37.0% because equity attributable to owners grew 46.9% in FY26, faster than the 28.1% increase in PAT
ROCE remained stable at 27.1% because higher EBIT from project execution was matched by growth in debt and equity capital employed to fund the larger working-capital base
Debt / Equity improved to 1.0x from 1.2x as equity rose faster than gross debt; retained earnings increased equity while borrowings rose mainly for working-capital needs
Interest Coverage Ratio improved to 4.9x because PBT plus finance cost grew faster than finance cost, despite borrowings increasing for higher working-capital requirements
Current Ratio improved to 1.5x because current assets grew 49.4% versus 45.7% growth in current liabilities; the improvement is concentrated in receivables, retention money and unbilled revenue rather than only cash
ROA declined to 11.7% from 12.9% because total assets grew 41.7% in FY26, materially faster than the 28.1% increase in PAT as project working capital expanded
Industry Overview
Industry Drivers
Public Infrastructure Capex and a Large Multi-Sector Project Pipeline
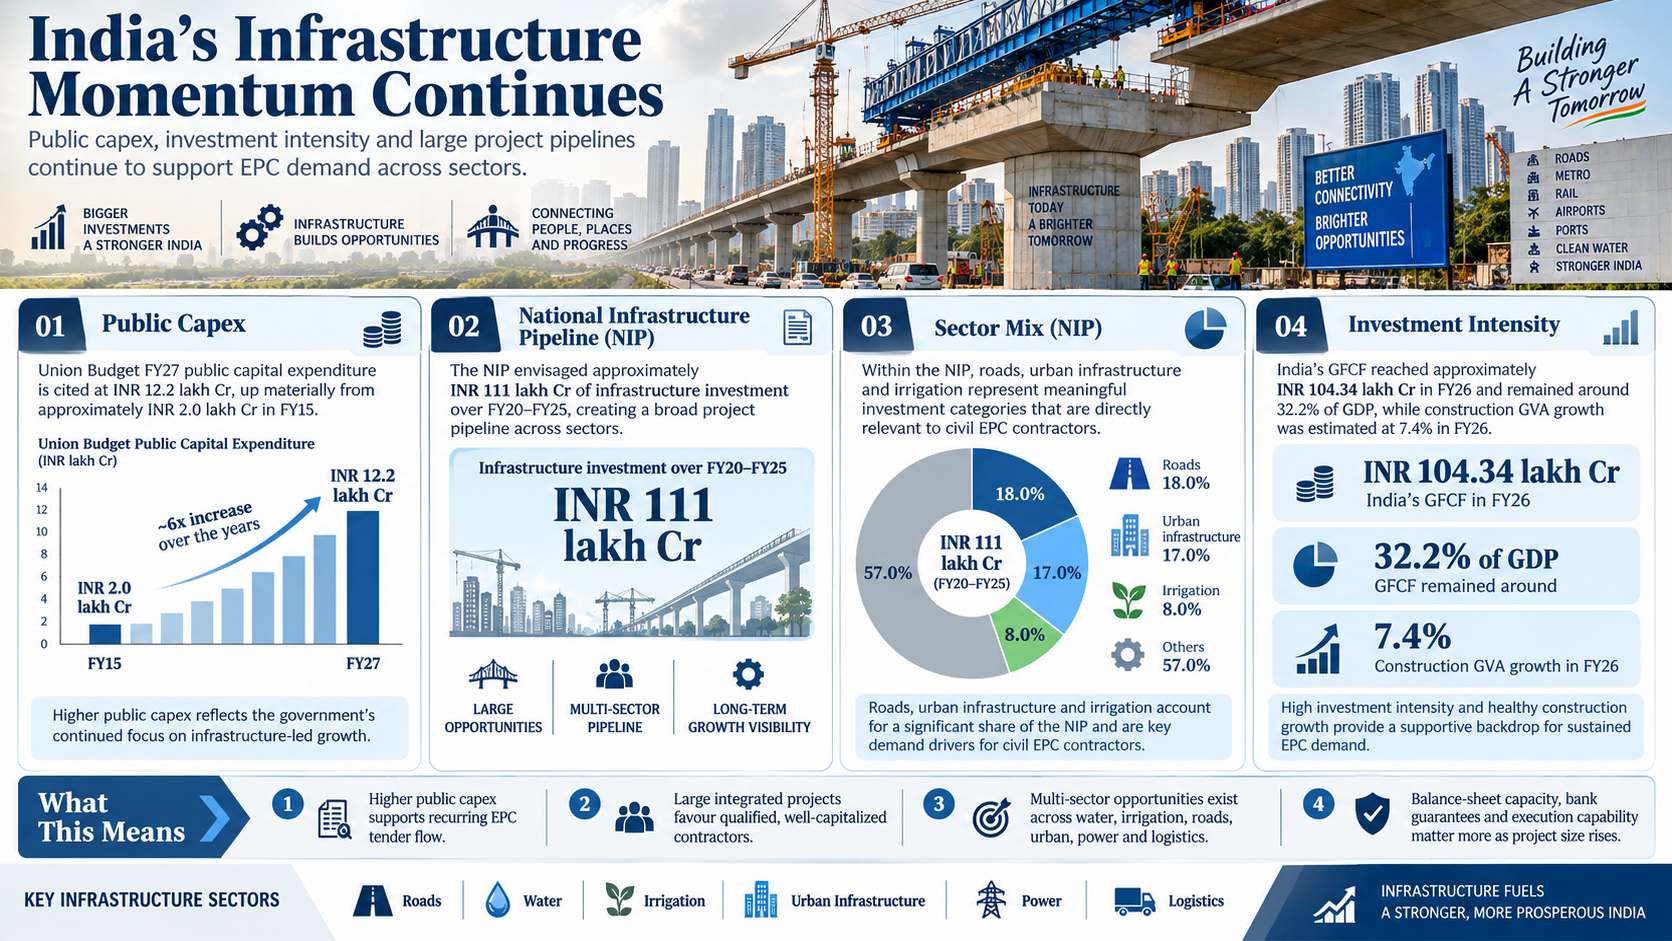
Infrastructure creation remains a central growth lever for India and continues to be driven by large central and state capital programmes. Higher public capex supports a recurring flow of EPC tenders across water, irrigation, roads, urban infrastructure, power and logistics. At the contractor level, the shift toward larger integrated packages increases the importance of qualification credentials, balance-sheet capacity, bank-guarantee availability and multi-state execution capability.
The key drivers are:
Public capex: Union Budget FY27 public capital expenditure is cited at INR 12.2 lakh Cr, up materially from approximately INR 2.0 lakh Cr in FY15
National Infrastructure Pipeline: The NIP envisaged approximately INR 111 lakh Cr of infrastructure investment over FY20-FY25, providing a broad project pipeline across sectors
Sector mix: Within NIP, roads represented approximately 18.0%, urban infrastructure 17.0% and irrigation 8.0% of projected investment, directly relevant to civil EPC contractors
Investment intensity: India's GFCF reached approximately INR 104.34 lakh Cr in FY26 and remained around 32.2% of GDP, while construction GVA growth was estimated at 7.4% in FY26
Irrigation Modernization, Water Stress and Micro-Irrigation Expansion
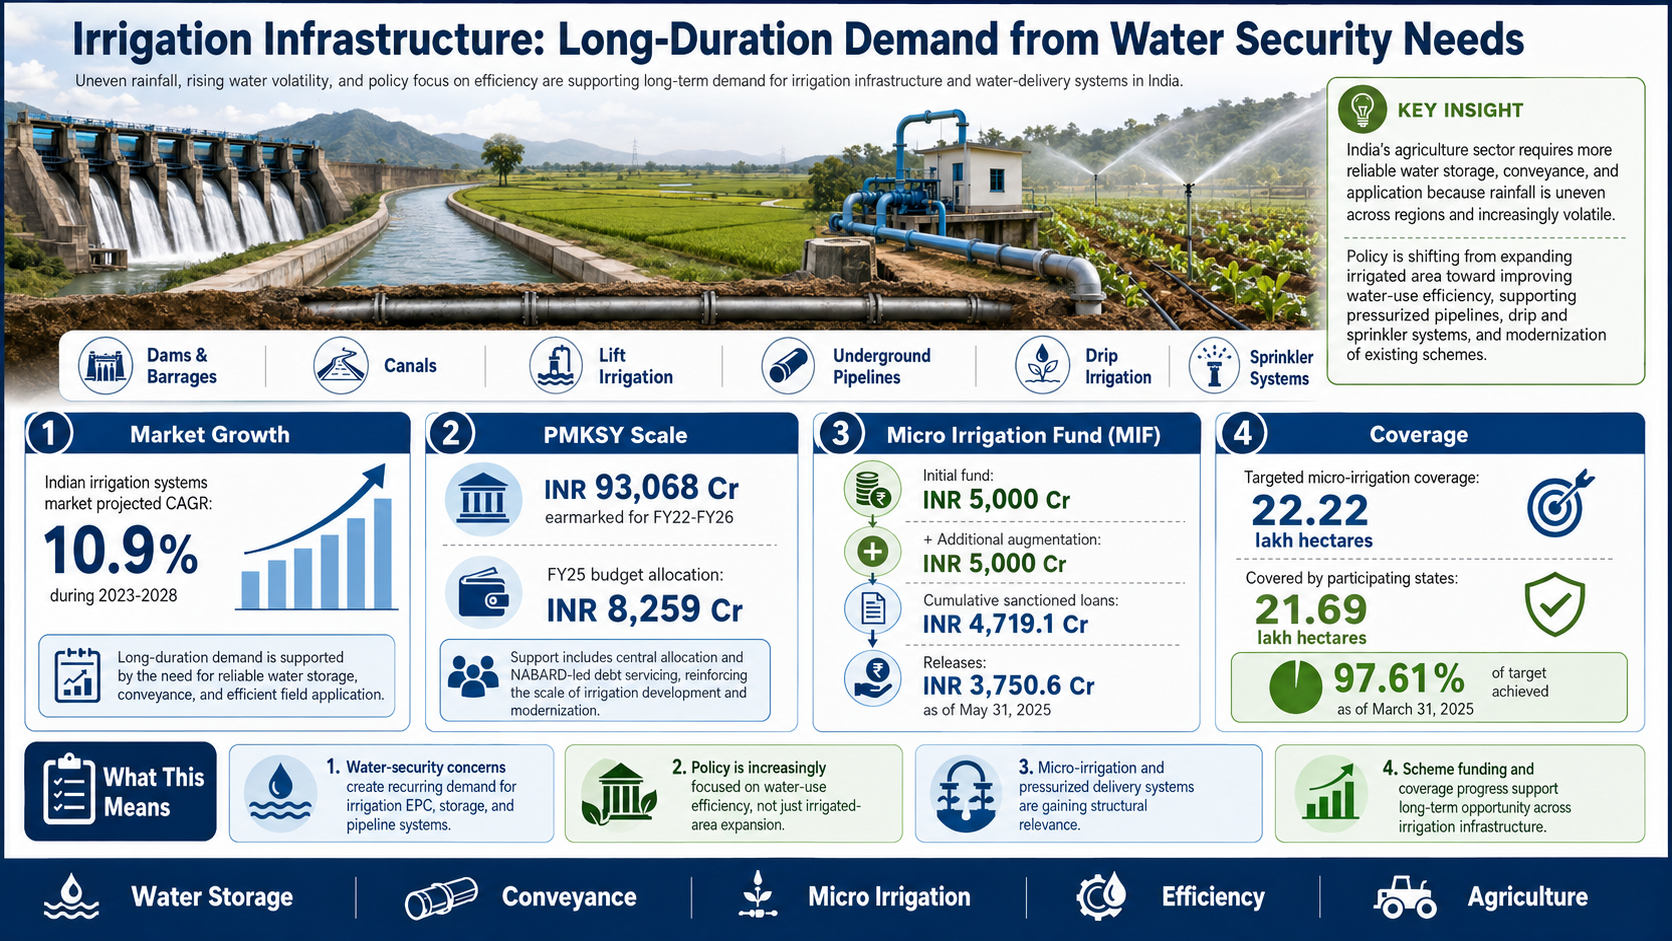
India's agriculture sector requires more reliable water storage, conveyance and application because rainfall is uneven across regions and increasingly volatile. This creates long-duration demand for dams, barrages, canals, lift-irrigation systems, underground pipelines and micro-irrigation networks. Policy is also shifting from simply expanding irrigated area toward improving water-use efficiency, which supports pressurized pipelines, drip and sprinkler systems and modernization of existing schemes.
The key drivers are:
Market growth: The Indian irrigation systems market is projected to grow at a 10.9% CAGR during 2023-2028, according to the ICRA / India Investment Grid data reproduced in the RHP
PMKSY scale: Approximately INR 93,068 Cr was earmarked for FY22-FY26, including central support and NABARD-led debt servicing, with a further FY25 budget allocation cited at INR 8,259 Cr
Micro Irrigation Fund: NABARD's MIF began with INR 5,000 Cr and was augmented by another INR 5,000 Cr; cumulative sanctioned loans were INR 4,719.1 Cr and releases INR 3,750.6 Cr as of May 31, 2025
Coverage: MIF-supported schemes targeted 22.22 lakh hectares of micro-irrigation coverage, of which 21.69 lakh hectares had been covered by participating states as of March 31, 2025
Drinking Water, Urban Water Security and Wastewater Infrastructure
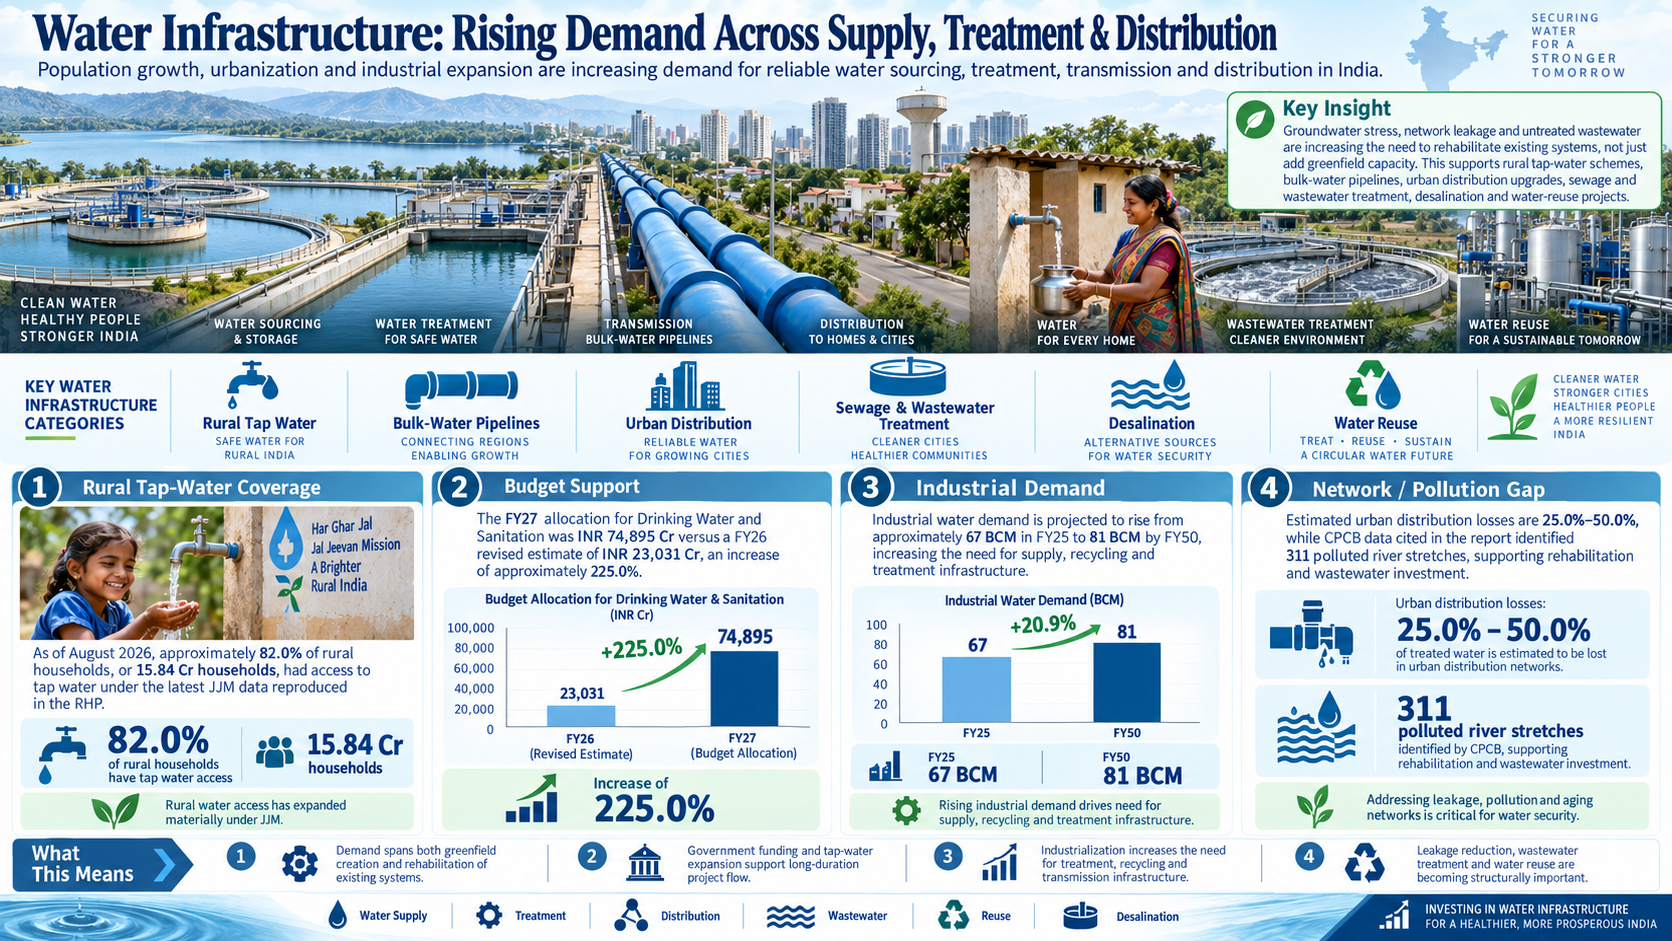
Population growth, urbanization and industrial expansion are increasing demand for reliable water sourcing, treatment, transmission and distribution. At the same time, groundwater stress, network leakage and untreated wastewater require rehabilitation of existing systems rather than only greenfield capacity. This supports rural tap-water schemes, bulk-water pipelines, urban distribution upgrades, sewage and wastewater treatment, desalination and water-reuse projects.
The key drivers are:
Rural tap-water coverage: As of August 2026, approximately 82.0% of rural households, or 15.84 Cr households, had access to tap water under the latest JJM data reproduced in the RHP
Budget support: The FY27 allocation for Drinking Water and Sanitation was INR 74,895 Cr versus a FY26 revised estimate of INR 23,031 Cr, an increase of approximately 225.0%
Industrial demand: Industrial water demand is projected to rise from approximately 67 BCM in FY25 to 81 BCM by FY50, increasing the need for supply, recycling and treatment infrastructure
Network / pollution gap: Estimated urban distribution losses are 25.0%-50.0%, while CPCB data cited in the report identified 311 polluted river stretches, supporting rehabilitation and wastewater investment
Risks in the Industry
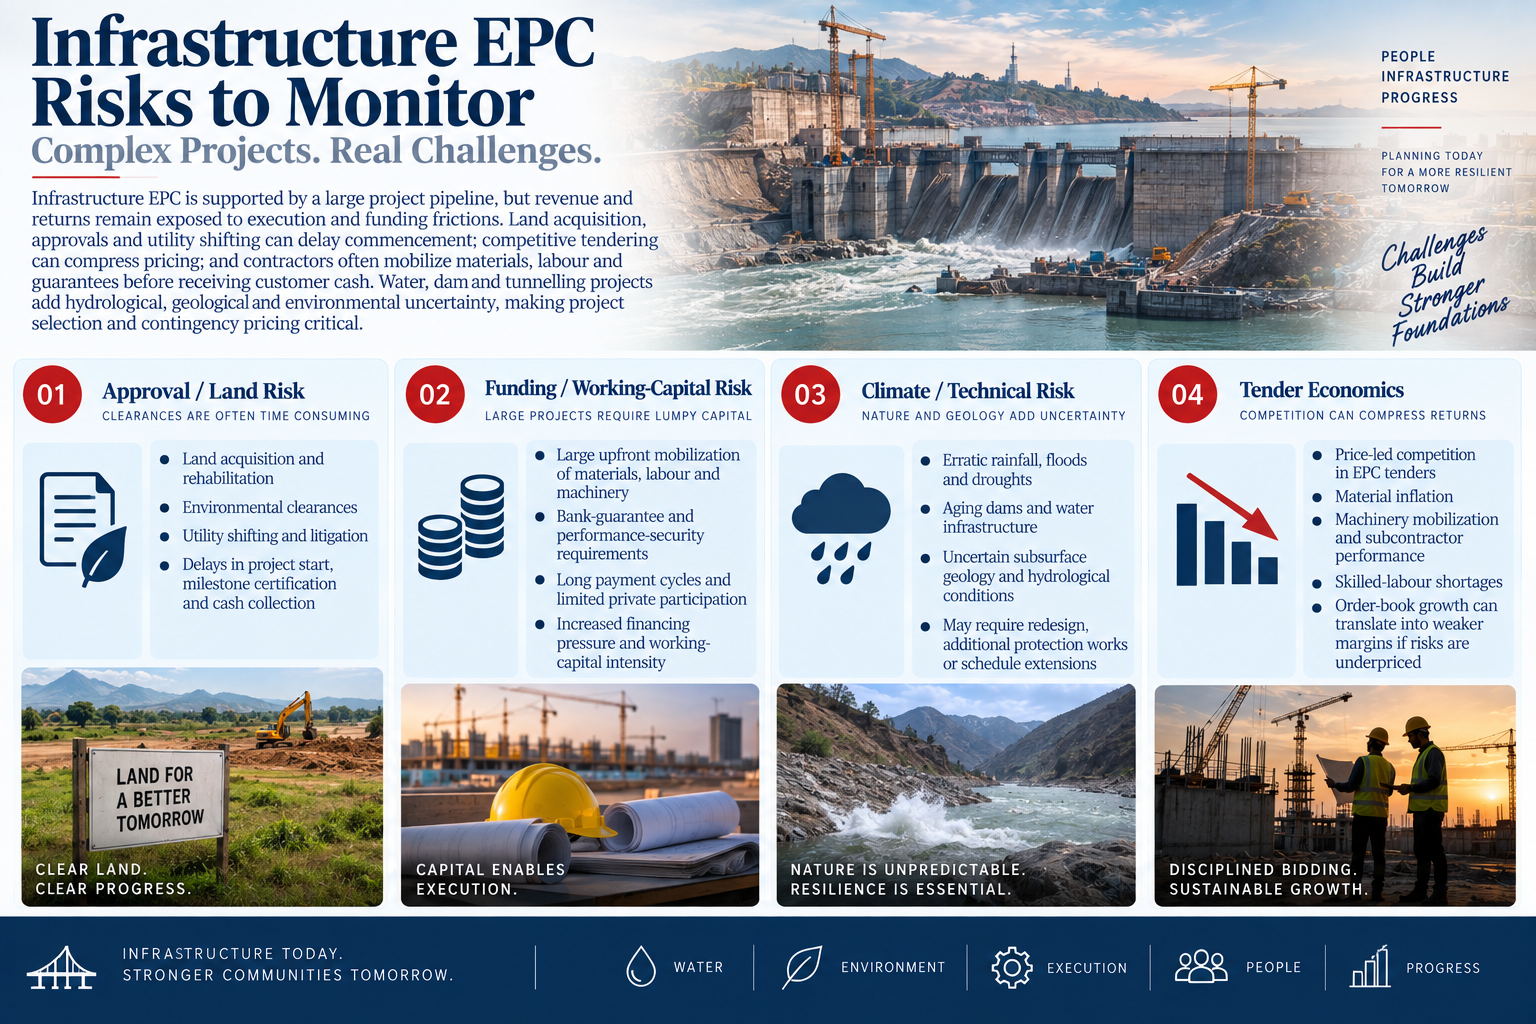
Infrastructure EPC is supported by a large project pipeline, but revenue and returns remain exposed to execution and funding frictions. Land acquisition, approvals and utility shifting can delay commencement; competitive tendering can compress pricing; and contractors often mobilize materials, labour and guarantees before receiving customer cash. Water, dam and tunnelling projects add hydrological, geological and environmental uncertainty, making project selection and contingency pricing critical.
The key risks are:
Approval / land risk: Land acquisition, rehabilitation, environmental clearances, utility shifting and litigation can delay project starts, milestone certification and cash collection
Funding / working-capital risk: Large projects require lumpy mobilization and bank-guarantee support, while long payment cycles and limited private participation can raise financing pressure
Climate / technical risk: Erratic rainfall, floods, droughts, aging dams and uncertain subsurface geology can require redesign, additional protection works or schedule extensions
Tender economics: Price-led competition, material inflation, machinery mobilization, subcontractor performance and skilled-labour shortages can convert order-book growth into weaker margins if risks are underpriced
Government Policy Support
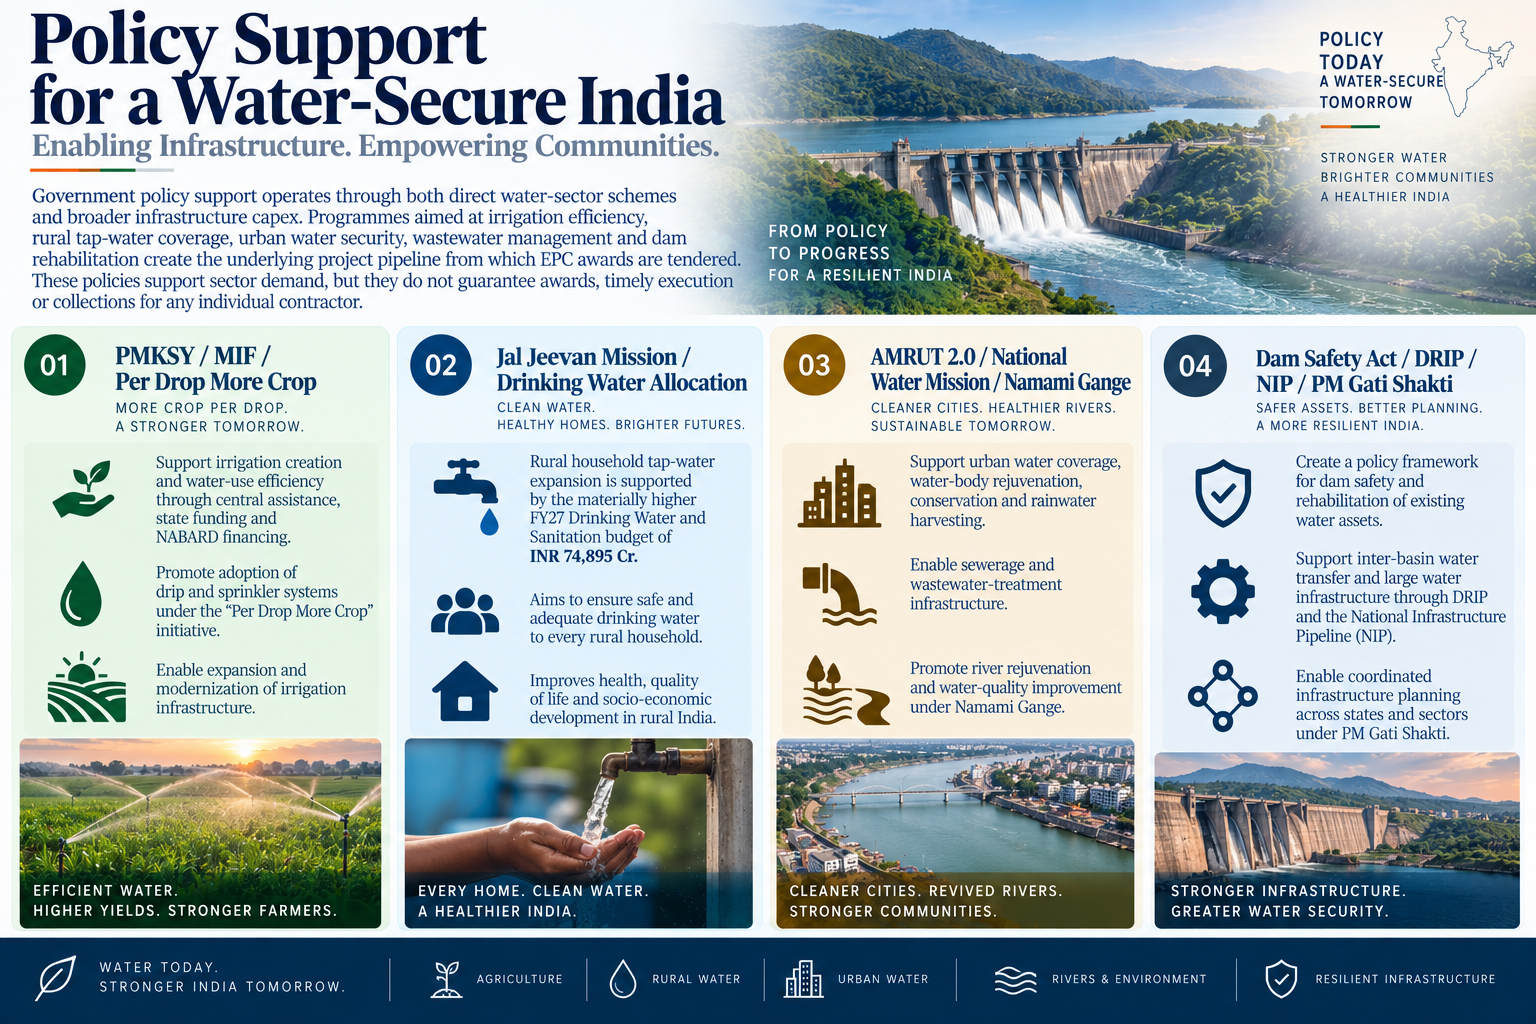
Government policy support operates through both direct water-sector schemes and broader infrastructure capex. Programmes aimed at irrigation efficiency, rural tap-water coverage, urban water security, wastewater management and dam rehabilitation create the underlying project pipeline from which EPC awards are tendered. These policies support sector demand, but they do not guarantee awards, timely execution or collections for any individual contractor.
The key policies are:
PMKSY / MIF / Per Drop More Crop: Support irrigation creation and water-use efficiency through central assistance, state funding, NABARD financing and adoption of drip / sprinkler systems
Jal Jeevan Mission / Drinking Water allocation: Rural household tap-water expansion is supported by the materially higher FY27 Drinking Water and Sanitation budget of INR 74,895 Cr.
AMRUT 2.0 / National Water Mission / Namami Gange: Support urban water coverage, water-body rejuvenation, conservation, rainwater harvesting, sewerage and wastewater-treatment infrastructure
Dam Safety Act / DRIP / NIP / PM Gati Shakti: Create a policy framework for asset rehabilitation, safety upgrades, inter-basin water transfer and coordinated infrastructure planning across states and sectors
Fundraise/Future Plans
Shareholding
Pre-issue shareholding
Promoter Holding 0.0%
Post-Issue Shareholding
Promoter Holding 0.0%
Category
Pre-Issue%Post-Issue%
Promoters
Arjan Suja Rabari
41.0%36.5%
Laljibhai Arjanbhai Ahir
41.0%36.5%
Sejuben Arjanbhai Rabari
9.0%8.5%
Geeta Lalji Ahir
9.0%8.5%
Total Promoter Holding
100.0%90.0%
Additional Shareholders
0.0%0.0%
Total Additional Holding
0.0%0.0%
Total Shareholding
100.0%90.0%
- Overview
- Business
- Financial Highlights
- Industry Overview
- Fundraise/Future Plans
- Documentation
Get the Preqt App and keep in touch around the clock!
 Monitor your investments in real-time.
- Receive tailored deal suggestions.
- Get real-time updates and alerts.
