


Lumino Industries
Powering Infrastructure GrowthEngineering Energy Connections
IPO Summary (PrEqt)
Lumino Industries Limited is an integrated power-infrastructure platform combining manufacturing of cables and conductors with EPC execution across power distribution, transmission, EHV substations, solar and water projects. FY24-FY26 revenue CAGR was approximately 20.4%; FY26 revenue reached INR 2,041.1 Cr, RHP-defined Operating EBITDA INR 238.9 Cr and PAT INR 160.0 Cr, while the closing order book expanded to INR 3,149.9 Cr. Manufacturing contributed 69.7% of FY26 revenue and EPC 30.3%, creating a product-led EPC model with captive consumption of in-house products. The IPO comprises INR 500.0 Cr of fresh capital and INR 200.0 Cr of OFS at the cap price, implying 20.0% primary dilution and a post-issue market capitalisation of approximately INR 2,497.3 Cr. The investment case is supported by grid and renewable capex, expanding higher-voltage capabilities and a growing order book, offset by government-tender dependence, receivable/retention intensity, commodity-price exposure and EPC execution risk.
IPO Review Rating
Buy
MainboardDelivering Integrated Power Solutions from Conductors to Critical Infrastructure
Lumino Industries presents a strong relative-valuation and return-on-equity story within the power-infrastructure space, supported by a growing order book and a predominantly fresh IPO. The operating fundamentals are healthy: FY26 revenue of INR 2,041.1 Cr, EBITDA of INR 238.9 Cr, PAT of INR 160.0 Cr, ROE of 24.62% and closing order book of approximately INR 3,149.9 Cr. The underlying industry is also positioned for double-digit growth through FY31. The principal financial weakness is cash-flow volatility and working-capital/debt intensity. FY25 OCF was deeply negative before recovering in FY26, while D/E remains 0.53x. The transaction directly addresses this issue because approximately INR 337.0 Cr of the INR 500.0 Cr Fresh Issue is intended for debt repayment, compared with only approximately INR 15.0 Cr of specified manufacturing capex. Valuation is the strongest part of the case. At INR 82.0, Lumino trades at approximately 12.5x FY26 P/E, 11.7x EV/EBITDA and 2.7x P/B, while producing 24.62% RoNW. Governance is reasonable rather than exceptional. The Board is 50.0% independent, promoter experience is substantial and no current promoter pledge is disclosed, but 9.2% P&L-related RPT exposure and an INR 200.0 Cr promoter OFS remain relevant monitorables. Estimated promoter ownership still remains approximately 59.9% post issue, so the OFS does not represent a promoter exit.
PARAMETER
WEIGHT
SCORE
KEY FACTORS
Financial Performance
40.0%
4.0/5
Lumino demonstrates good financial quality with strong returns and healthy growth, but the profile is not uniformly strong. Revenue has compounded at 20.4%, ROE is 24.6%, and FY26 OCF has recovered strongly.
Show more
Detailed Analysis
Revenue from operations increased from INR 1,407.3 Cr in FY24 to INR 1,918.0 Cr in FY25 and INR 2,041.1 Cr in FY26, representing a FY24–FY26 CAGR of approximately 20.4%
EBITDA increased from INR 145.1 Cr in FY24 to INR 222.9 Cr in FY25 and INR 238.9 Cr in FY26, while EBITDA margin expanded from 10.3% to 11.7%
PAT increased from INR 86.6 Cr in FY24 to INR 124.6 Cr in FY25 and INR 160.0 Cr in FY26, with FY26 PAT margin improving to 7.7%
Total debt stood at INR 384.2 Cr in FY26, resulting in D/E of 0.5x, versus 0.1x in FY24 and 0.7x in FY25
ROE stood at 21.5% in FY24, 24.5% in FY25 and 24.6% in FY26
OCF moved from INR 100.9 Cr in FY24 to INR -238.6 Cr in FY25, before recovering sharply to INR 156.1 Cr in FY26
The largest customer contributed approximately 7.32% of FY26 revenue, while the Top 10 customers collectively accounted for approximately 46.52%
Industry
15.0%
3.0/5
Lumino operates in a structurally attractive power-infrastructure market, supported by double-digit cable/conductor growth, transmission investment, renewable integration and railway electrification.
Show more
Detailed Analysis
India's wires and cables market is projected to grow at approximately 13–14% CAGR during FY26–FY31, while the conductor industry is expected to grow at approximately 12–15% CAGR
Transmission, distribution, renewable integration, railway electrification and reconductoring continue to drive investment in power infrastructure and associated cable/conductor demand
Power-sector capex and government programmes support demand, while public tendering, project approvals, Right-of-Way and execution requirements create moderate regulatory and project risk
Management
15.0%
4.0/5
Management has long operating experience, meaningful continuing ownership and adequate Board independence.
Show more
Detailed Analysis
Managing Director Devendra Goel has been a Director since April 2005, giving more than 21 years of direct association with the Company, while the underlying Lumino business traces its history to 1989
The Board has 6 Directors, including 3 Independent Directors, resulting in exactly 50.0% independent representation
The promoter group has no material criminal/regulatory proceedings, while certain promoter tax proceedings are disclosed
FY26 P&L-related RPTs aggregated approximately INR 187.8 Cr, equivalent to 9.2% of revenue from operations
Valuation
20.0%
5.0/5
At 12.5x FY26 P/E, 11.7x EV/EBITDA and 2.7x P/B, the IPO is priced at a substantial discount to the disclosed/selected peer universe despite FY26 RoNW of 24.6%.
Show more
Detailed Analysis
At INR 82.0, Lumino trades at approximately 12.5x FY26 P/E, versus the RHP-disclosed peer average of 48.5x, representing an approximate 74.3% discount
Lumino trades at approximately 11.7x EV/EBITDA versus an indicative selected-peer average of 22.3x, implying a peer/Lumino ratio of approximately 1.9x
INR 82.0 represents approximately 2.7x FY26 NAV of INR 30.0 per share
FY26 RoNW stood at 24.6%
Merchant Banker Track Record
10.0%
4.0/5
The BRLM setup is a positive for the IPO. The representative sample shows 15.5% average listing gains and 57.6x average subscription, although the outcomes are not uniformly positive.
Show more
Detailed Analysis
The three selected mandates generated an average listing return of approximately 15.5%
The sample generated average overall subscription of approximately 57.6x
Two of the three representative transactions opened above their respective issue prices, resulting in a 66.7% positive-listing rate
The syndicate has strong institutional execution credentials: Motilal Oswal and JM Financial have extensive mainboard franchises, supplemented by Monarch Networth
TOTAL
100%
4.0/5
Weighted Composite Score
Issue Price
₹78.0 to ₹82.0
As of 29 Aug 2026
GMP
₹49.0
As of 29 Aug 2026
Estimated Gain / Loss
+59.7%
Lot Size
182.0 Shares
Grey Market Premium (GMPs) are shared for knowledge purpose only. PrEqt doesn’t promote or execute the trades.
| Issue size | |
|---|---|
| Overall | ₹700.0 Cr |
| Fresh Issue | ₹500.0 Cr |
| Offer for Sale | ₹200.0 Cr |
Minimum Investment
₹14,924.0 / 33,124 shares

Merchant Banker
Motilal Oswal Investment Advisors Ltd.; JM Financial; Monarch Networth
IPO Document
RHP / Anchor Document
Offer Start Date
27th Aug 2026
Offer End Date
31st Aug 2026
Valuation
₹2,497.3 Cr
Revenue (FY'26)
₹2,089.3 Cr
PAT (FY'26)
₹160.0 Cr
Issue Size
₹700.0 Cr
Face Value
₹ 5.0Offer Price
₹ 82.0Lot Size
182.0 sharesSale Type
Fresh capital cum OFSPAT (FY'26)
₹ 160.0 CrPAT Margin (FY'26)
7.7 %P/E Multiple
11.7xEBITDA (FY'26)
₹ 238.9 CrCAGR Growth 2Y
20.4 %ROE (FY'26)
24.6 %ROCE (FY'26)
25.8 %Price to Book Value
2.7xDebt/Equity
0.5xCompany Website
www.luminoindustries.comExplore new deals
Overview
Fund Allocation
Total: ₹0 CrSource:Company DRHP
Timeline
IPO Open Date
To Be Announced
IPO Close Date
To Be Announced
Tentative Allotment
To Be Announced
Initiation of Refunds
To Be Announced
Credit of Shares to Demat
To Be Announced
Tentative Listing Date
To Be Announced
Business
Business Model
Geographical Presence
Sales Channel
Key Risk Factor
Financial Highlights
Income Statement
Revenue growth with EBITDA and PAT margins
| Financial Metric | FY 2024 | FY 2025 | FY 2026 |
|---|---|---|---|
| Revenue (₹ Cr) | 1,424.6 | 1,946.7 | 2,089.3 |
| Growth (%) | 84.2% | 36.3% | 6.4% |
| EBITDA (₹ Cr) | 145.1 | 222.9 | 238.9 |
| EBITDA Margin (%) | 10.3% | 11.6% | 11.7% |
| PAT (₹ Cr) | 86.6 | 124.6 | 160.0 |
| PAT Margin (%) | 6.1% | 6.4% | 7.7% |
OBSERVATIONS & INSIGHTS
FY25 revenue rose 36.3% as both manufacturing and EPC activity scaled; FY26 growth moderated to 6.4% as EPC revenue declined while manufacturing expanded 14.2%, led by aluminium conductors
Growth outpaced revenue over FY24-FY26 as plant throughput, project execution and fixed-cost absorption improved. FY26 EBITDA growth slowed with revenue growth but margin still increased to 11.7%
PAT grew 43.9% in FY25 and 28.4% in FY26. FY26 PAT growth exceeded EBITDA growth because operating performance improved while finance cost was broadly flat and tax effects were supportive
Balance Sheet
| Financial Metric | FY 2024 | FY 2025 | FY 2026 |
|---|---|---|---|
| Net Worth | ₹ 445.9 Cr | ₹ 570.3 Cr | ₹ 729.6 Cr |
| Total Assets | ₹ 1,175.4 Cr | ₹ 1,718.7 Cr | ₹ 2,174.9 Cr |
| Total Borrowing | ₹ 40.9 Cr | ₹ 418.8 Cr | ₹ 384.2 Cr |
| Reserves & Surplus | ₹ 415.5 Cr | ₹ 448.7 Cr | ₹ 607.9 Cr |
OBSERVATIONS & INSIGHTS
Total Borrowings increased from INR 40.9 Cr in FY24 to INR 418.8 Cr in FY25 because short-term debt funded the sharp expansion in receivables, inventory and project activity. Borrowings reduced to INR 384.2 Cr in FY26 as operating cash flow recovered and short-term debt declined, although long-term borrowing increased for expansion
Reserves & Surplus increased to INR 607.9 Cr in FY26 from INR 448.7 Cr, primarily through retained profitability. The rise strengthened the capital base and helped offset leverage from growth funding
Total Equity rose from INR 446.0 Cr in FY24 to INR 729.7 Cr in FY26. FY25 also reflects a higher share-capital base following capital restructuring / bonus and split, while FY26 growth was driven mainly by earnings retention
Total Assets expanded to INR 2,174.9 Cr in FY26 from INR 1,718.7 Cr in FY25, led by higher trade receivables, inventory, CWIP and other financial assets as the order book and manufacturing/EPC activity scaled
Cash Flow
| Financial Metric | FY 2024 | FY 2025 | FY 2026 |
|---|---|---|---|
CFO (₹ Cr) Cash generated from core business operations. | +100.9 Cr | -238.6 Cr | +156.1 Cr |
CFI (₹ Cr) Cash used for investments and long-term assets. | -3.6 Cr | -12.8 Cr | -40.6 Cr |
CFF (₹ Cr) Cash flow related to funding and borrowings. | -94.3 Cr | +311.5 Cr | -101.7 Cr |
Working Capital
| Efficiency Metric | FY 2023 | FY 2024 | FY 2025 |
|---|---|---|---|
Debtor Days Average number of days taken to collect customer payments. | - | - | - |
Creditor Days Average time taken to pay suppliers and vendors. | - | - | - |
Inventory Days Average number of days inventory remains unsold. | - | - | - |
CCC (Cash Conversion Cycle) (Debtor Days + Inventory Days - Creditor Days) | - | - | - |
Financial Ratios
Measures the company’s leverage relative to shareholder equity.
OBSERVATIONS & INSIGHTS
ROE improved from 21.5% to 24.5% in FY25 as PAT grew faster than equity; it held at 24.6% in FY26 despite retained earnings expanding the equity base
Debt / Equity rose sharply in FY25 because short-term borrowings were raised to finance a larger working-capital cycle; improved to 0.53x in FY26 as equity accreted and short-term debt reduced
Interest Coverage fell to 3.6x in FY25 as finance cost nearly doubled with higher debt, then improved to 4.1x in FY26 as EBIT increased while finance cost remained broadly flat
Current Ratio reduced from 1.5x to ~1.4x as current borrowings and trade acceptances expanded with scale; FY26 stability indicates liquidity growth broadly matched current liabilities
ROA rose in FY25 as earnings growth outpaced the average asset base, then eased to 8.2% in FY26 because receivables, inventory and CWIP increased faster than PAT
ROCE declined to 25.8% in FY26 from 31.9% as capital employed increased materially through retained earnings and borrowings before the full return from expansion assets was realized
Industry Overview
Industry Drivers
Power Transmission, Distribution and Grid-Capex Cycle
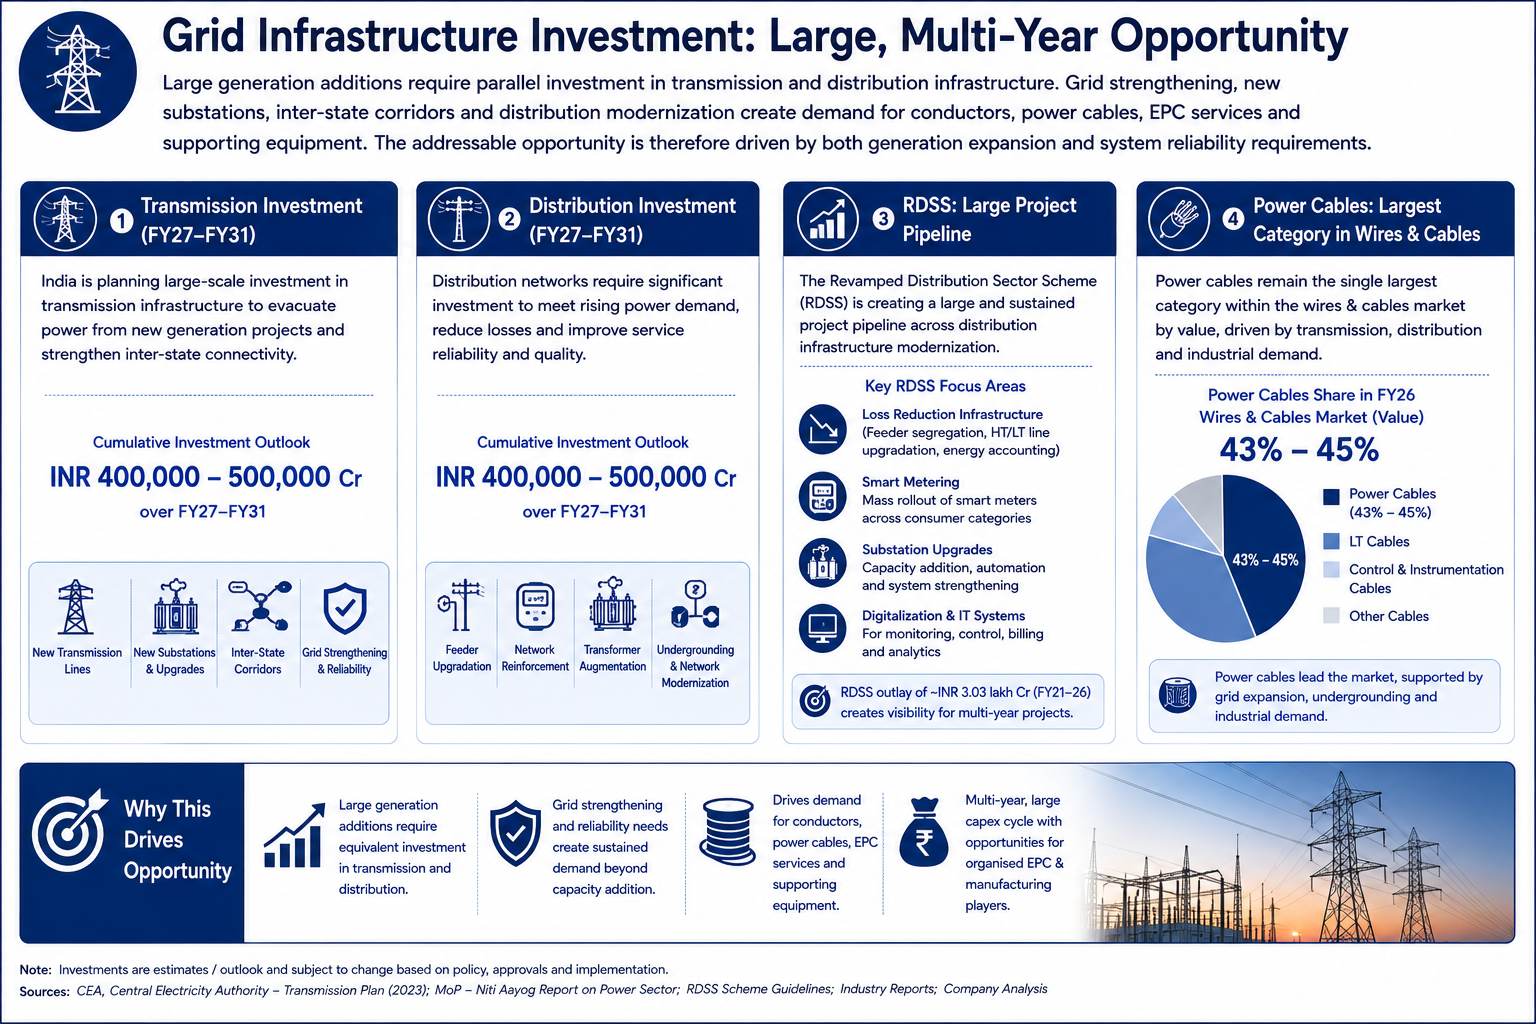
India requires sustained transmission and distribution investment to support growing generation capacity, rising electricity consumption and higher renewable penetration. New interstate corridors, EHV substations, distribution strengthening and system augmentation create recurring demand for power cables, conductors and EPC services. The investment cycle is increasingly focused on reliability, loss reduction and network modernisation rather than only greenfield electrification.
The key drivers are:
Transmission-sector investment is expected at approximately INR 400,000.0-500,000.0 Cr cumulatively over FY27-FY31
Distribution investment is also projected at approximately INR 400,000.0-500,000.0 Cr over FY27-FY31, supported by network strengthening and 24x7 power requirements
RDSS has sanctioned about INR 283,000.0 Cr of projects across loss-reduction infrastructure, smart metering, feeder segregation and substation upgrades
The National Electricity Plan envisages continued expansion of transmission lines, substations and inter-regional transfer capacity as electricity demand rises
Structural Growth in Wires, Cables and Conductors
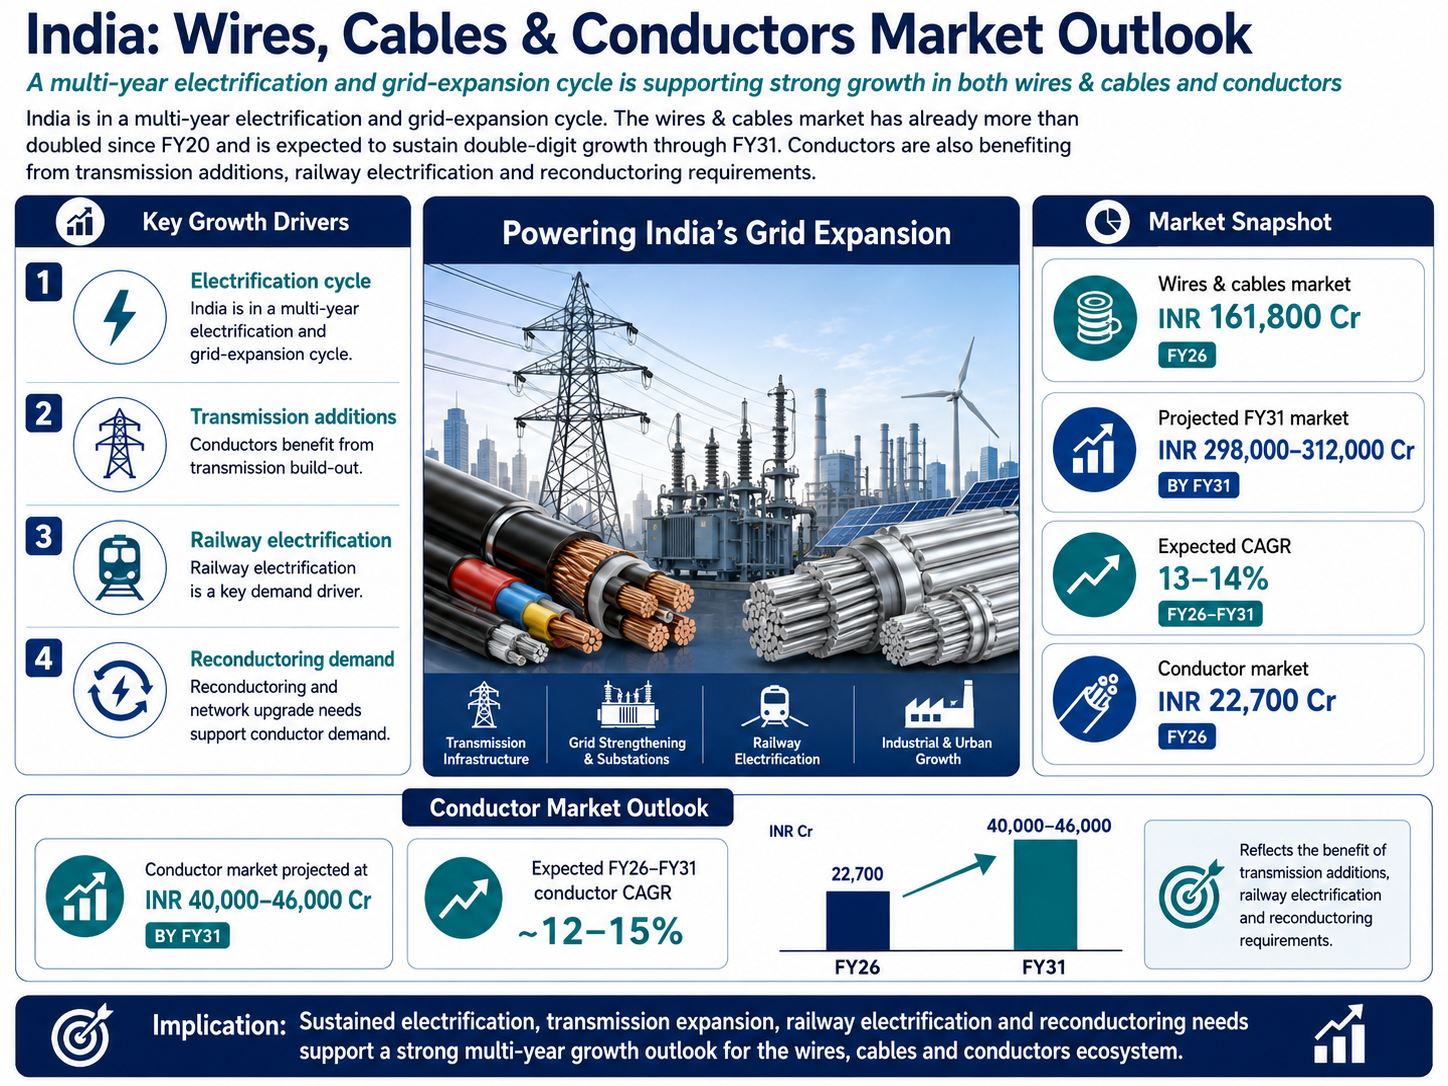
The Indian wires and cables market has more than doubled since FY20 as electrification, construction, industrial investment and power-sector additions increased underlying consumption. Conductors are seeing a similar structural expansion from transmission-line additions, railway electrification and reconductoring requirements. Growth is gradually shifting toward higher-voltage, specialised and performance-oriented products as grid intensity and technical requirements increase.
The key details are:
India's wires and cables market was approximately INR 161,800.0 Cr in FY26 and is projected at INR 298,000.0-312,000.0 Cr by FY31
The wires and cables market is expected to grow at approximately 13-14% CAGR between FY26 and FY31
The conductor market was approximately INR 22,700.0 Cr in FY26 and is projected at INR 40,000.0-46,000.0 Cr by FY31, implying approximately 12-15% CAGR
Power transmission cables represented the largest FY26 wires-and-cables category at approximately 43-45% of domestic market value
Renewable Integration, High-Voltage Upgrade and Reconductoring
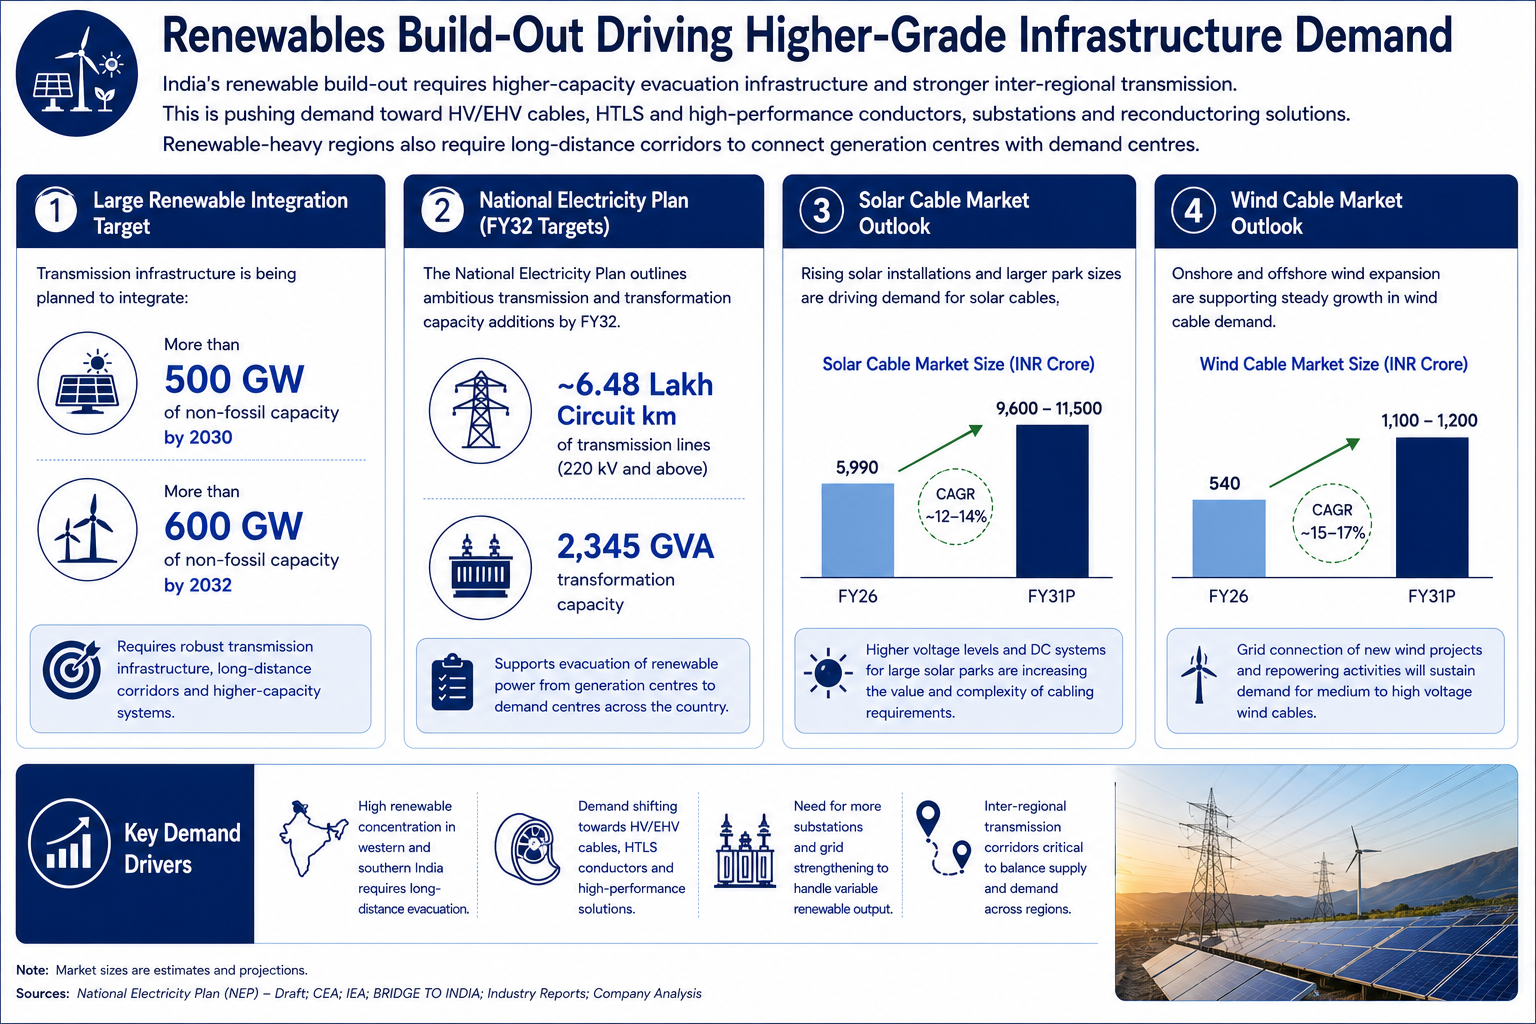
Renewable generation is increasingly located away from major demand centres, requiring long-distance evacuation infrastructure and stronger inter-regional transfer capability. This is pushing investment into HV/EHV cables, high-capacity conductors, substations and reconductoring solutions that can carry more power within constrained rights of way. Grid-modernisation programmes therefore create a technology-led demand layer in addition to conventional network expansion.
The key details are:
Transmission infrastructure is being planned to integrate more than 500 GW of non-fossil capacity by 2030 and more than 600 GW by 2032
The National Electricity Plan projects the 220 kV-and-above network at about 6.48 lakh circuit km and transformation capacity at about 2,345 GVA by FY32
Green Energy Corridor programmes support renewable-energy evacuation across multiple states and create demand for high-voltage corridors and substations
Limited right-of-way availability is increasing the relevance of HTLS and other high-performance conductors for uprating existing corridors without proportionate tower expansion
Risks in the Industry
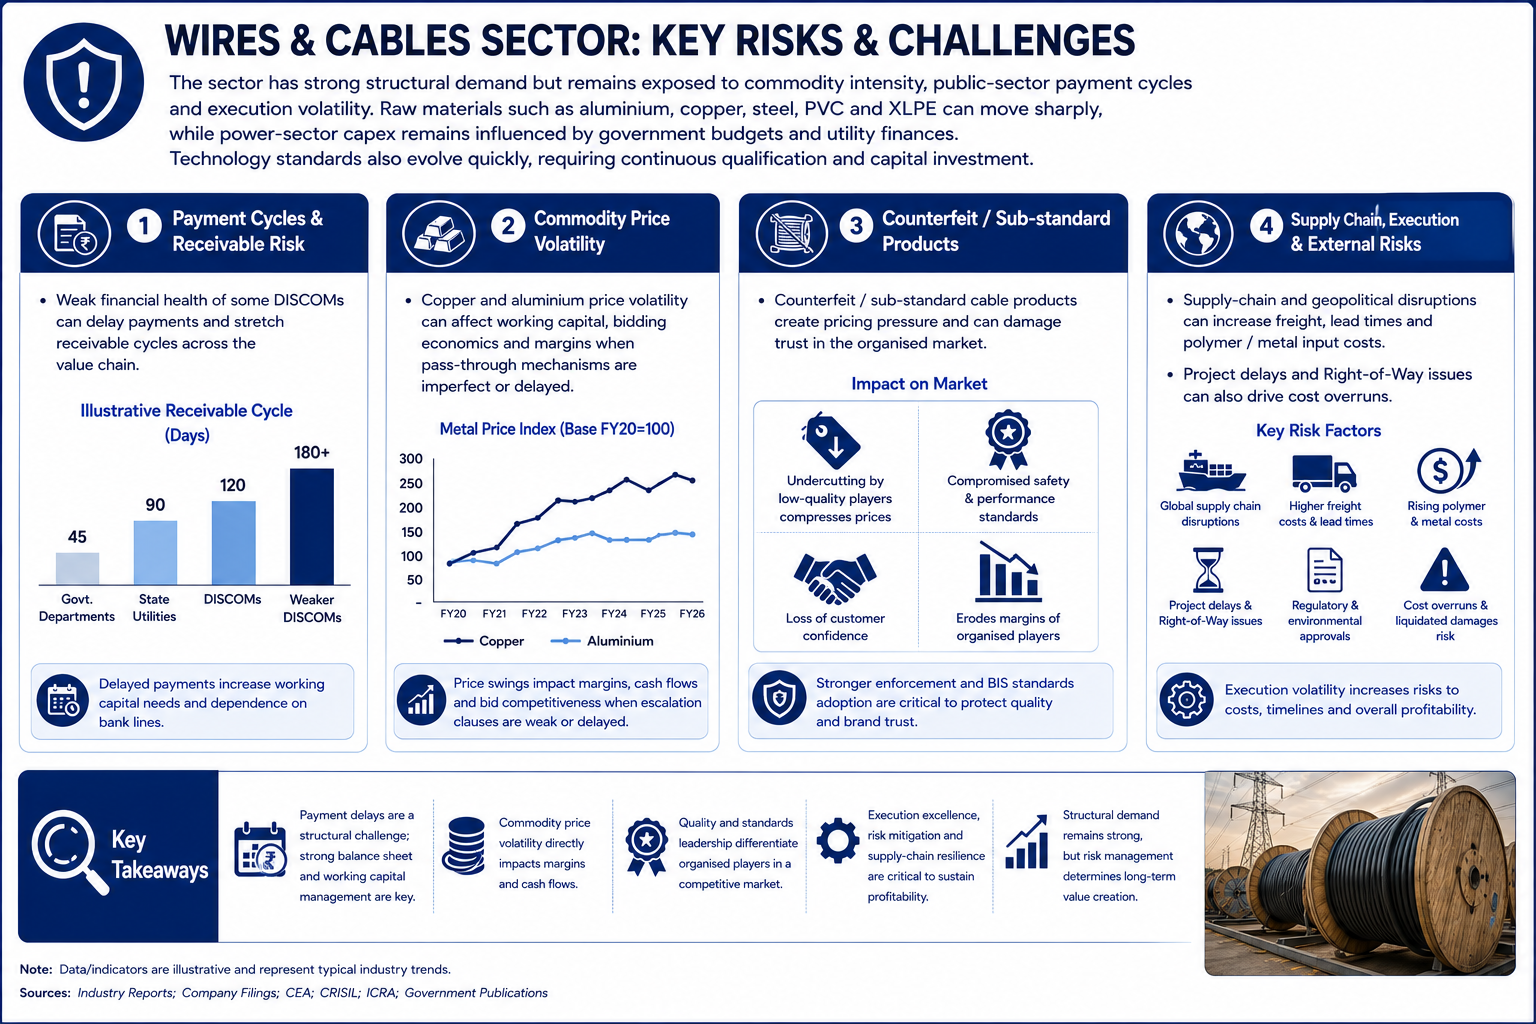
The sector has strong structural demand, but profitability and cash conversion can be volatile because cables, conductors and EPC contracts are exposed to metal prices, public-sector payment cycles, competitive tendering and execution delays. Long project durations can magnify changes in raw-material, freight and labour costs, while delayed right-of-way, land acquisition or approvals can postpone billing and increase working-capital requirements. Industry participants must therefore balance order-book growth with disciplined bidding, hedging and receivable management.
The key risks are:
DISCOM financial stress and delayed utility payments can stretch receivable cycles and increase dependence on working-capital borrowing across the value chain
Aluminium, copper, steel, PVC and XLPE prices can move sharply; imperfect or delayed pass-through clauses can affect conversion margins and bid economics
Low-price competition and counterfeit or sub-standard products can pressure organised-market pricing while raising safety, compliance and brand-trust concerns
Supply-chain disruption, geopolitical events, freight volatility, right-of-way constraints and project approvals can increase lead times and contribute to cost overruns
Government Policy Support
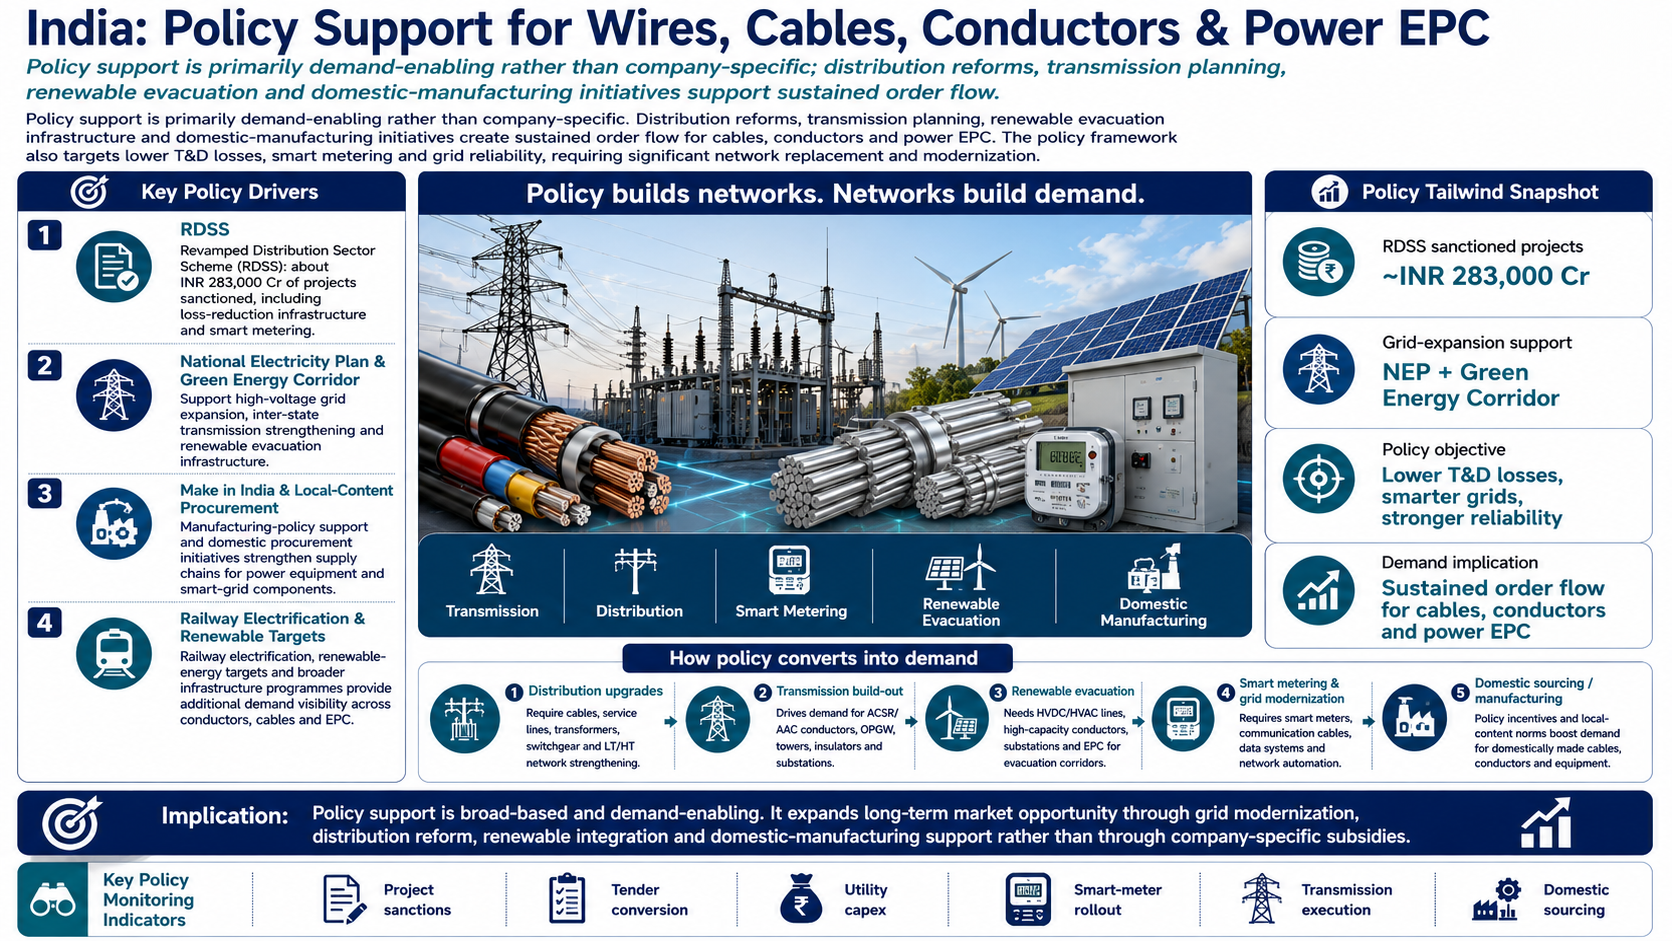
Government policy support is primarily demand enabling rather than a guaranteed benefit to any individual manufacturer or contractor. Transmission planning, distribution reform, renewable evacuation, smart-meter deployment and local-content initiatives expand the addressable project pipeline for cables, conductors and power EPC. Actual industry conversion still depends on tendering, state implementation, budget releases, utility finances and project execution capacity.
The key policies are:
Revamped Distribution Sector Scheme (RDSS): Approximately INR 283,000.0 Cr of projects have been sanctioned for loss reduction, network modernisation and smart metering
National Electricity Plan and Green Energy Corridor programmes support high-voltage transmission expansion, inter-regional transfer capacity and renewable-energy evacuation
Make in India and local-content procurement requirements support domestic manufacturing of power-sector and smart-grid equipment; smart-meter procurement includes specified localisation thresholds
Railway electrification, renewable-energy targets and broader infrastructure programmes create additional long-duration demand for conductors, cables, substations and EPC services
Fundraise/Future Plans
Shareholding
Pre-issue shareholding
Promoter Holding 0.0%
Post-Issue Shareholding
Promoter Holding 0.0%
Category
Pre-Issue%Post-Issue%
Promoters
Purushottam Dass Goel
0.3%0.3%
Devendra Goel
49.0%33.2%
Jay Goel
35.5%26.4%
Total Promoter Holding
84.8%59.9%
Additional Shareholders
0.0%0.0%
Total Additional Holding
0.0%0.0%
Total Shareholding
84.8%59.9%
- Overview
- Business
- Financial Highlights
- Industry Overview
- Fundraise/Future Plans
- Documentation
Get the Preqt App and keep in touch around the clock!
 Monitor your investments in real-time.
- Receive tailored deal suggestions.
- Get real-time updates and alerts.
