

Mahanadi Coalfields
Powering India’s Energy NeedsFueling National Progress
IPO Summary (PrEqT)
Mahanadi Coalfields Limited (MCL) is a wholly-owned subsidiary of Coal India Limited (CIL) and the single largest coal-producing company in India, operating 17 mines (14 opencast and three underground) concentrated in the Talcher and Ib Valley coalfields of Odisha. MCL accounted for approximately 21% of India's domestic coal production in Fiscal 2026, with Annual Coal Production of 218.31 MT and audited coal reserves of 9,840.31 MT as at April 1, 2026, sufficient to sustain current production for approximately 45 years.
The Offer is a pure Offer for Sale of up to 661,836,300 equity shares (face value INR 2.0 each, approximately 10.0% of the Company's paid-up capital) entirely by Coal India Limited, the Promoter Selling Shareholder; there is no fresh issue, and the Company will not receive any part of the Offer Proceeds, all of which accrue to Coal India Limited. Revenue from operations declined marginally from INR 31,634.3 Cr (FY24) to INR 31,353.0 Cr (FY25, -0.9%) to INR 30,549.6 Cr (FY26, -2.6%), while PAT attributable to owners declined from INR 11,841.4 Cr (FY24) to INR 10,823.6 Cr (FY25, -8.6%) to INR 10,677.7 Cr (FY26, -1.3%), reflecting a moderation in realisations even as production volumes continued to grow.
The Company reported a Return on Net Worth of 53.77% in FY26 (RHP-disclosed), among the highest of any listed coal peer, and remains effectively debt-free, with total borrowings of only INR 3.2 Cr against a net worth exceeding INR 21,000.0 Cr. Key considerations for investors include the undisclosed price band (which prevents a definitive valuation call at this stage), near-total dependence on a single customer group (the power sector, both government-owned and private), geographic concentration of reserves and operations entirely within two coalfields in Odisha, exposure to the government-administered notified coal pricing mechanism, a sharp 73.3% rise in trade receivables over the three-year window, and governance features inherent to a majority state-controlled enterprise, including Board composition that does not currently comply with SEBI Listing Regulations (SEBI has granted a temporary exemption until listing).
IPO Review Rating
Above Avg
MainboardPowering Core Industries Through Reliable and Efficient Coal Supply
Mahanadi Coalfields represents a financially robust and strategically important coal-mining business, supported by its 21.0% share of domestic production, substantial audited coal reserves, negligible debt and superior operating profitability. FY26 operating EBITDA margin of 41.7%, return on net worth of 53.8% and operating cash flow of INR 12,477.5 Cr demonstrate the Company's earnings strength and capacity to finance capital expenditure internally.
At the upper price band of INR 136.0, the IPO's 8.4x FY26 P/E offers a meaningful discount to the broader reported industry average, while the 4.6x illustrative EV/EBITDA provides additional valuation support. Nevertheless, the Company's premium valuation relative to its parent, Coal India, suggests that much of its superior profitability may already be reflected in the asking price.
Several material risks deserve attention. Revenue contracted at a 1.7% CAGR over FY24–FY26, operating EBITDA declined at a 6.9% CAGR, and operating margins compressed by 4.7 percentage points. Customer concentration remains elevated, and the Company's dependence on thermal coal and regulated pricing limits its ability to fully control future growth and realisations.
The most significant concerns arise from corporate governance and contingent liabilities. The absence of independent directors at the RHP date, substantial related-party transactions and INR 12,513.3 Cr of contingent liabilities as of September 2026 justify a meaningful risk discount. Furthermore, the 100.0% OFS means that the business will not receive growth capital from the IPO.
For investors seeking long-term exposure to a cash-generative Indian coal producer, the issue may merit a selective subscription, supported by its production leadership, financial strength and moderate earnings valuation. However, the Company's declining operating profitability and governance deficiencies prevent an unequivocal positive recommendation.
PARAMETER
WEIGHT
SCORE
KEY FACTORS
Financial Performance
20.0%
4.0/5
The Company demonstrates exceptional profitability, negligible leverage and substantial cash generation, supported by an FY26 41.7% operating EBITDA margin and 53.8% RoNW. However, the negative 1.7% revenue CAGR, negative 6.9% operating EBITDA CAGR, declining return ratios and material customer concentration prevent a higher score. H1 FY27 revenue and PAT growth of 9.3% and 6.7%, respectively, indicate a partial recovery, although operating margins remain under pressure
Show more
Detailed Analysis
Revenue from operations declined from INR 31,634.4 Cr in FY24 to INR 30,549.6 Cr in FY26, reflecting a negative 1.7% CAGR. FY26 revenue contracted 2.6% YoY, although H1 FY27 revenue recovered 9.3% YoY to INR 16,093.0 Cr
FY26 operating EBITDA was INR 12,735.2 Cr, with an operating margin of 41.7%, declining from 46.4% in FY24. Despite the 4.7-percentage-point contraction, The Company maintained substantially higher operating margins than Coal India (24.9%) and Bharat Coking Coal (negative 3.6%)
FY26 PAT stood at INR 10,698.1 Cr, representing a 31.6% margin, against 35.3% in FY24. PAT declined at a 4.9% CAGR over FY24–FY26, while other income increased to INR 3,349.7 Cr, equivalent to 23.3% of FY26 PBT, providing significant support to overall profitability
FY26 total borrowings were only INR 3.2 Cr, against net worth of INR 21,371.2 Cr, resulting in effectively negligible financial leverage. The 2.1x current ratio and substantial cash and bank balances provide strong liquidity and financing flexibility
FY26 return on net worth was 53.8%, significantly higher than Coal India (27.8%) and Bharat Coking Coal (2.1%). However, RoNW declined from 80.6% in FY24, while RoACE moderated from 107.0% to 73.3%, indicating declining incremental capital efficiency
FY26 operating cash flow increased to INR 12,477.5 Cr, from INR 7,705.0 Cr in FY25, representing 1.2x FY26 PAT. H1 FY27 operating cash flow reached INR 8,997.1 Cr, while FY26 capital expenditure was INR 2,929.6 Cr, demonstrating strong internal funding capacity
FY26 revenue concentration stood at 55.9% for the top 10 customers, 41.1% for the top five, and 14.6% for the largest customer. Government-controlled power utilities contributed 44.8% of revenue, increasing exposure to payment delays and concentration within the power sector
Industry
15.0%
2.0/5
India's coal industry offers moderate long-term growth, with 4.1% projected overall coal-demand CAGR through FY31 and a 3.8% implied CAGR for non-coking coal. The Company's 21.0% national production share, extensive reserves and cost-efficient mining provide a strong competitive position. Nevertheless, renewable-energy penetration, environmental obligations and geographic concentration constrain the industry's long-term attractiveness
Show more
Detailed Analysis
CRISIL projects India's levelised coal demand to increase from 1,176.0 MT in FY25 to 1,495.0 MT by FY31, reflecting a 4.1% CAGR. Within this, non-coking coal demand is projected to increase from 1,112.0 MT to 1,394.0 MT, implying approximately 3.8% CAGR, supported by electricity generation and industrial demand
Coal remains a mature, strategically important energy source, contributing approximately 68.0% of India's electricity generation in FY26. However, renewable capacity expansion towards the government's 500.0 GW target by 2030 creates long-term substitution pressure and limits structural growth potential
Coal mining faces extensive environmental, forest, land-acquisition and mine-closure regulations. The Company had environmental clearance capacity of 330.8 MTPA and consent-to-operate capacity of 272.1 MTPA in FY26, but increasing environmental compliance requirements and renewable-energy policies present material long-term risks
Management
15.0%
3.0/5
Government ownership, Coal India's operational support and experienced management provide institutional stability. However, the absence of independent directors, related-party transactions equal to 27.5% of FY26 revenue, and contingent liabilities equal to 55.9% of September 2026 net worth are significant governance and financial-risk considerations. These weaknesses materially reduce the assessment despite the strength of the promoter
Show more
Detailed Analysis
The Company was incorporated in 1992 and is led by CMD Uday A. Kaole, supported by experienced executives and Coal India's institutional resources. Its workforce of 20,526 employees as of September 2026 and established mining operations demonstrate significant technical and operating experience
As of the RHP date, the Board had no independent directors, despite the stated requirement for six independent directors, including one woman independent director. The Company sought regulatory exemptions from specified governance requirements, creating a significant weakness in independent oversight and minority-shareholder protection
The Company is promoted by the Government of India and Coal India, with Coal India selling approximately 10.0% of equity through the IPO and retaining approximately 90.0% ownership thereafter. The promoter's shares were reported as unpledged, supporting ownership stability and strategic continuity
Contingent liabilities increased from INR 8,506.2 Cr in FY26 to INR 12,513.3 Cr as of September 2026, equivalent to 55.9% of net worth. The September 2026 exposure included INR 8,074.8 Cr of income-tax matters, representing a substantial potential financial liability if adverse outcomes materialise
FY26 aggregate related-party transactions stood at INR 8,386.1 Cr, equivalent to 27.5% of revenue from operations, compared with 29.8% in FY25. The significant transaction volume and close operational integration with Coal India warrant continuing scrutiny of transaction terms and minority-shareholder interests
Valuation
20.0%
4.0/5
At 8.4x FY26 earnings, MCL trades at an attractive 27.1% discount to the stated industry average, supported by exceptional profitability and substantial liquidity. However, its 5.4% P/E premium and 103.8% P/B premium to parent Coal India, declining operating profitability, and entirely secondary offer structure limit the valuation advantage. The 4.6x EBITDA multiple offers some comfort, but the pricing appears reasonable rather than deeply discounted, particularly when compared with its closest domestic coal-mining peer
Show more
Detailed Analysis
At INR 136.0 per share, The Company trades at 8.4x FY26 PAT of INR 10,698.1 Cr, representing a 27.5% discount to the industry peer average P/E of 11.6x, but a 5.3% premium to Coal India’s 8.0x P/E
At the upper price band, illustrative enterprise value is approximately INR 74,102.2 Cr, resulting in 4.6x FY26 EBITDA of INR 16,084.9 Cr and 5.8x FY26 operating EBITDA of INR 12,735.2 Cr. These multiples appear reasonable in absolute terms, although a fully comparable, contemporaneous EV/EBITDA benchmark for listed peers was not verified
The IPO trades at 4.2x FY26 NAV of INR 32.3 per share, representing a 321.2% premium to book value. Coal India trades at approximately 2.1x FY26 NAV using its 13 November closing price, placing MCL at a 103.8% P/B premium to its parent. Higher profitability partly supports the premium, but it reduces valuation comfort
Merchant Banker Track Record
10.0%
5.0/5
The appointment of five established capital-market intermediaries supports confidence in issue execution, institutional distribution and regulatory coordination. However, the syndicate's historical listing-performance metrics remain unverified, and BRLM reputation should not be interpreted as a guarantee of favourable IPO returns
Show more
Detailed Analysis
The IPO is managed by SBI Capital Markets, Axis Capital, BOB Capital Markets, IDBI Capital Markets & Securities, and IIFL Capital Services. These are established Indian investment-banking institutions with experience in capital-market transactions and regulatory execution
The five-BRLM syndicate provides diversified institutional distribution and execution resources for the approximately INR 8,981.1 Cr public issue. The size and complexity of this government-owned enterprise divestment support the need for an experienced syndicate
TOTAL
100%
3.6/5
Weighted Composite Score
Issue Price
₹129.0 to ₹136.0
As of 17 Nov 2026
GMP
₹3.3
As of 17 Nov 2026
Estimated Gain / Loss
+4.5%
Lot Size
110.0 Shares
Grey Market Premium (GMPs) are shared for knowledge purpose only. PrEqt doesn’t promote or execute the trades.
| Issue Size (in Cr) | |
|---|---|
| Overall | ₹8,981.1 Cr |
| Fresh Issue | - |
| Offer for Sale | ₹8,981.1 Cr |
Minimum Investment
₹14,960.0 / 12,100 shares

Merchant Banker
SBI Capital Markets Ltd., Axis Capital, BOB Capital Markets, IDBI Capital Markets & Securities, IIFL Capital Services
SBI Capital Markets Ltd.
Axis Capital
BOB Capital Markets
IDBI Capital Markets & Securities
IIFL Capital Services
IPO Document
Offer Start Date
Offer End Date
Valuation
Revenue
PAT (FY'26)
Issue Size (in Cr)
Face Value
₹ 2.0Offer Price
₹ 136.0Lot Size
110.0 sharesSale Type
OFS onlyPAT (FY'26)
₹ 10,677.7 CrPAT Margin (FY'26)
35.0 %P/E Multiple
8.4xEBITDA (FY'26)
₹ 16,084.9 CrCAGR Growth 2Y
-1.7 %ROE (FY'26)
53.8 %ROCE (FY'26)
34.3 %Price to Book Value
4.2xDebt/Equity
0.0xCompany Website
www.mahanadicoal.inExplore new deals
Overview
Fund Allocation
Total: ₹0 CrSource:Company DRHP
Timeline
IPO Open Date
To Be Announced
IPO Close Date
To Be Announced
Tentative Allotment
To Be Announced
Initiation of Refunds
To Be Announced
Credit of Shares to Demat
To Be Announced
Tentative Listing Date
To Be Announced
Business
Business Model
Geographical Presence
Sales Channel
Key Risk Factors
Financial Highlights
Income Statement
Revenue growth with EBITDA and PAT margins
| Financial Metric | FY 2024 | FY 2025 | FY 2026 |
|---|---|---|---|
| Revenue (₹ Cr) | 31,634.3 | 31,353.0 | 30,549.6 |
| Growth (%) | - | -0.9% | -2.6% |
| EBITDA (₹ Cr) | 16,636.9 | 15,331.1 | 16,084.9 |
| EBITDA Margin (%) | 52.6% | 48.9% | 52.7% |
| PAT (₹ Cr) | 11,841.4 | 10,823.6 | 10,677.7 |
| PAT Margin (%) | 37.4% | 34.5% | 35.0% |
OBSERVATIONS & INSIGHTS
Revenue: Revenue moved from INR 31,634.3 Cr in FY24 to INR 31,353.0 Cr in FY25 and further down to INR 30,549.6 Cr in FY26, a mild overall decline of 3.4% across the three years. This happened even though coal despatch volumes kept growing, because average realisations softened, especially on the market linked e-auction route, where per tonne rates fell from INR 2,273.1 in FY24 to INR 1,797.3 in FY26
EBITDA: EBITDA margin eased from 52.6% in FY24 to 48.9% in FY25, mainly because depreciation jumped sharply that year and contractual expenses also rose. It then recovered to 52.7% in FY26, helped by a strong jump in other income, which rose to INR 3,349.7 Cr from INR 1,675.6 Cr in FY25, largely from higher interest earned on the Company’s large bank deposits
PAT: PAT declined steadily across all three years, from INR 11,841.4 Cr in FY24 to INR 10,823.6 Cr in FY25 and INR 10,677.7 Cr in FY26. The fall reflects the softer revenue base, a sharp rise in FY26 depreciation to INR 1,632.3 Cr as new capital work in progress was capitalised, and a modestly higher effective tax rate compared with FY24, even as operating cash flow kept improving
Balance Sheet
| Financial Metric | FY 2024 | FY 2025 | FY 2026 |
|---|---|---|---|
| Net Worth | ₹ 16,117.9 Cr | ₹ 18,352.0 Cr | ₹ 21,431.2 Cr |
| Total Assets | ₹ 50,687.8 Cr | ₹ 53,590.5 Cr | ₹ 55,358.3 Cr |
| Total Borrowing | ₹ 4.0 Cr | ₹ 3.4 Cr | ₹ 3.2 Cr |
| Reserves & Surplus | ₹ 14,700.9 Cr | ₹ 16,873.5 Cr | ₹ 19,932.3 Cr |
OBSERVATIONS & INSIGHTS
Net Worth: Net Worth grew steadily from INR 16,117.9 Cr in FY24 to INR 18,352.0 Cr in FY25 and INR 21,431.2 Cr in FY26, a cumulative rise of about 33% over the three years. This growth came entirely from internal accruals, since the Company paid no fresh equity and raised no external capital, retaining a large share of its annual profit after dividend payouts to Coal India Limited and the Government each year
Total Assets: Total Assets rose from INR 50,687.8 Cr in FY24 to INR 53,590.5 Cr in FY25 and INR 55,358.3 Cr in FY26, growing at a steadier pace than Net Worth. The increase was driven mainly by continued capitalisation of property, plant and equipment as mine development and equipment additions progressed, alongside a build up in trade receivables and bank deposits on the current assets side
Total Borrowing: Total Borrowing is negligible and declining throughout, from INR 4.0 Cr in FY24 to INR 3.4 Cr in FY25 and INR 3.2 Cr in FY26. This confirms MCL is effectively a debt free company, funding its entire capital expenditure and working capital needs from internal operating cash flow rather than external borrowings, a position very few capital intensive mining companies are able to sustain
Reserves and Surplus: Reserves and Surplus increased from INR 14,700.9 Cr in FY24 to INR 16,873.5 Cr in FY25 and INR 19,932.3 Cr in FY26, mirroring the growth in Net Worth since Equity Share Capital itself stayed flat at INR 1,323.7 Cr across all three years. The steady build up reflects consistent profit retention, with dividends paid out below reported PAT in every year of the period
Cash Flow
| Financial Metric | FY 2024 | FY 2025 | FY 2026 |
|---|---|---|---|
CFO (₹ Cr) Cash generated from core business operations. | +6,325.6 Cr | +7,705.0 Cr | +12,477.5 Cr |
CFI (₹ Cr) Cash used for investments and long-term assets. | +3,436.5 Cr | +2,117.2 Cr | -5,068.0 Cr |
CFF (₹ Cr) Cash flow related to funding and borrowings. | -9,002.0 Cr | -8,600.8 Cr | -7,651.2 Cr |
Working Capital
| Efficiency Metric | FY 2023 | FY 2024 | FY 2025 |
|---|---|---|---|
Debtor Days Average number of days taken to collect customer payments. | - | - | - |
Creditor Days Average time taken to pay suppliers and vendors. | - | - | - |
Inventory Days Average number of days inventory remains unsold. | - | - | - |
CCC (Cash Conversion Cycle) (Debtor Days + Inventory Days - Creditor Days) | - | - | - |
Financial Ratios
Measures the company’s leverage relative to shareholder equity.
OBSERVATIONS & INSIGHTS
ROE: Return on Equity (the RHP’s own RoNW figure) declined from 80.6% in FY24 to 62.8% in FY25 and further to 53.8% in FY26. The fall tracks declining PAT attributable to owners, from INR 11,841.4 Cr to INR 10,677.7 Cr, against a steadily rising net worth base built almost entirely from retained profits rather than fresh capital. Even at 53.8%, MCL’s FY26 ROE remains far above every listed peer in its comparison set, including Coal India Limited at 27.8%
ROA: Return on Assets eased from 23.4% in FY24 to 20.2% in FY25 and 19.3% in FY26, a gentler decline than ROE because the asset base grew more slowly than equity over the period. The trend mirrors falling PAT against a Total Assets base that expanded steadily, from INR 50,687.8 Cr to INR 55,358.3 Cr, mainly through continued capitalisation of property, plant and equipment as mine development work progressed
ROCE: Return on Capital Employed fell from 41.8% in FY24 to 36.0% in FY25 and 34.3% in FY26, calculated as EBIT divided by capital employed. The decline is driven by softening EBIT, which moved from INR 15,657.9 Cr to INR 14,452.7 Cr, while capital employed kept rising as the Company reinvested operating cash flow into property, plant and equipment rather than distributing all of it as dividends
Debt to Equity & Interest Coverage): MCL carries almost no financial debt, so Debt to Equity rounds to 0.0x in every year shown, confirming the Company is effectively debt free. Interest Coverage is extremely high through the period, at 230.3x in FY24, 199.8x in FY25, and 158.4x in FY26. The declining trend here is only because finance costs are negligible rather than earnings weakening, so this ratio should not be read as a solvency concern for the Company
Current Ratio: Current Ratio held steady at 2.0x in FY24 and FY25, improving slightly to 2.1x in FY26. This stability shows current assets, largely cash, bank deposits and receivables, have comfortably covered current liabilities throughout the period, giving the Company ample short term liquidity even as trade receivables lengthened and capital expenditure increased in FY26
Industry Overview
Industry Drivers
Rising Power Demand and Continued Reliance on Coal-Based Baseload Generation
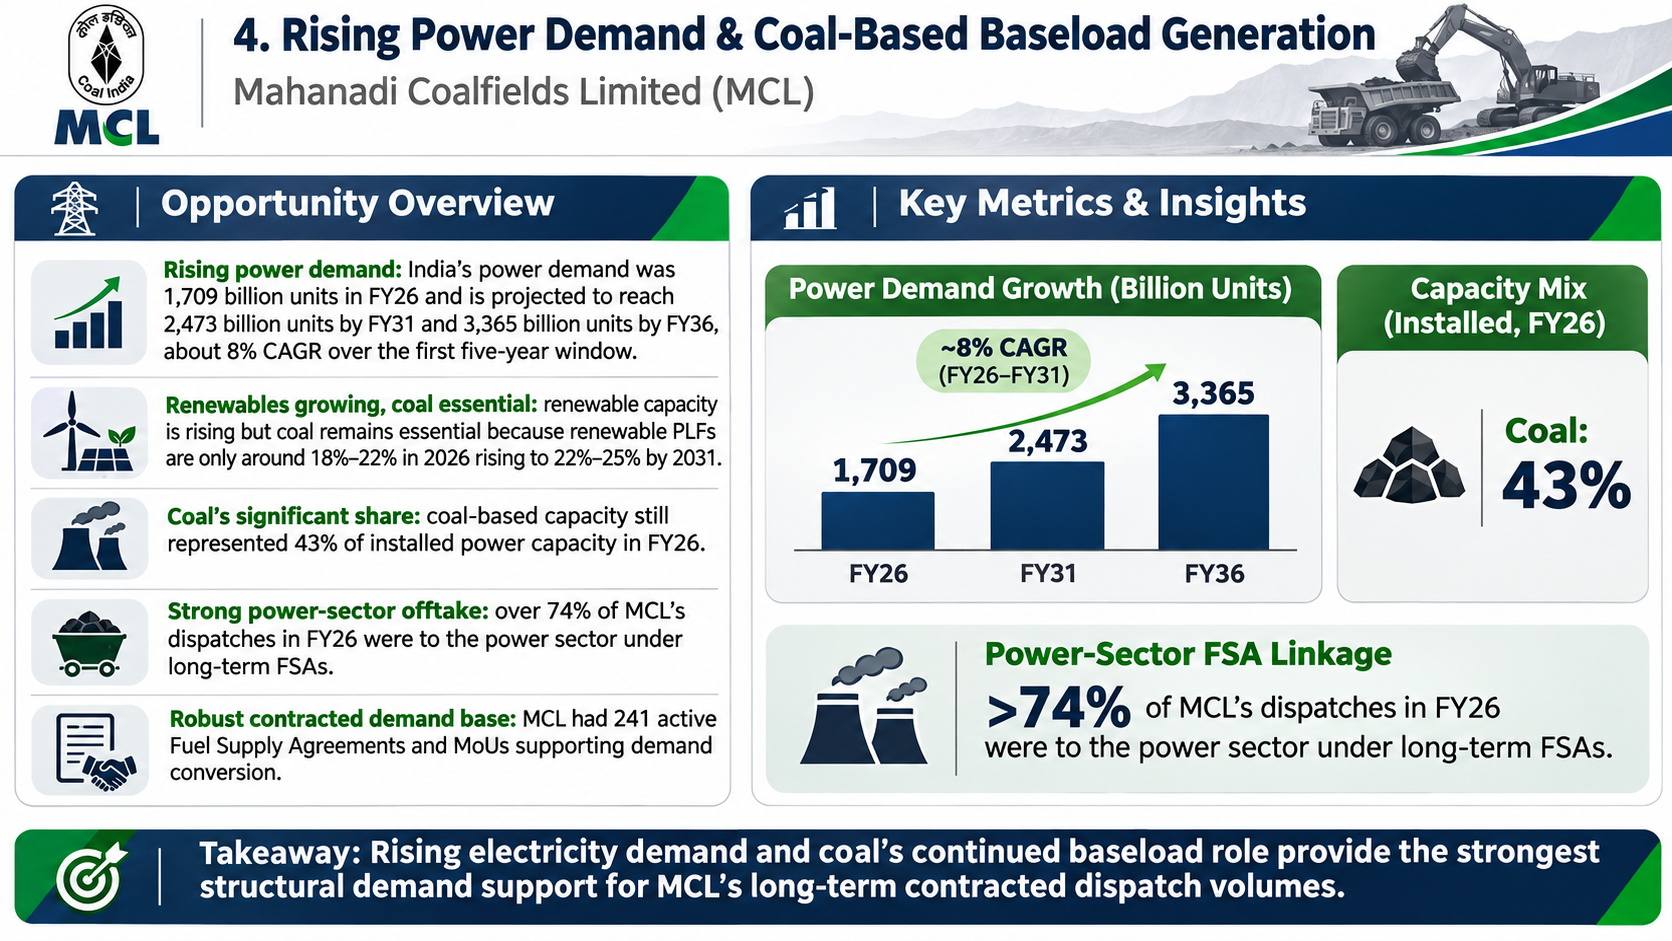
India's power demand was 1,709 billion units in Fiscal 2026 and is projected to reach 2,473 billion units by Fiscal 2031 and 3,365 billion units by Fiscal 2036, an 8% CAGR over the first five-year window. While renewable capacity additions are accelerating, coal-based thermal power continues to anchor grid reliability because renewable Plant Load Factors remain structurally lower (18%-22% in 2026, rising only to 22%-25% by 2031). Coal-based capacity still represented 43% of India's installed power capacity in Fiscal 2026, the single largest source. For MCL, whose revenue from sale of products to government-owned and controlled power generation companies and utilities has consistently exceeded 40% of total sale of products, this sustained baseload role is the single most important demand driver for its coal.
The key drivers are:
Demand growth: Power demand CAGR of approximately 8% through FY31 implies continued absolute coal offtake growth even as coal's percentage share of the generation mix declines gradually
Capacity mix: Coal remained 43% of India's installed power capacity in FY26, versus a combined 38% for solar and wind, underscoring coal's continuing centrality to grid stability
FSA linkage: MCL's 241 active Fuel Supply Agreements and MoUs (Fiscal 2026), covering a substantial Annual Contracted Quantity, directly convert this demand into contracted offtake for the Company
Customer concentration upside: Over 74% of MCL's total coal dispatches in Fiscal 2026 were to the power sector under long-term FSAs, meaning power-sector demand growth converts with high pass-through into MCL's own despatch volumes
Government Policy Push for Higher Domestic Coal Production and Self-Reliance
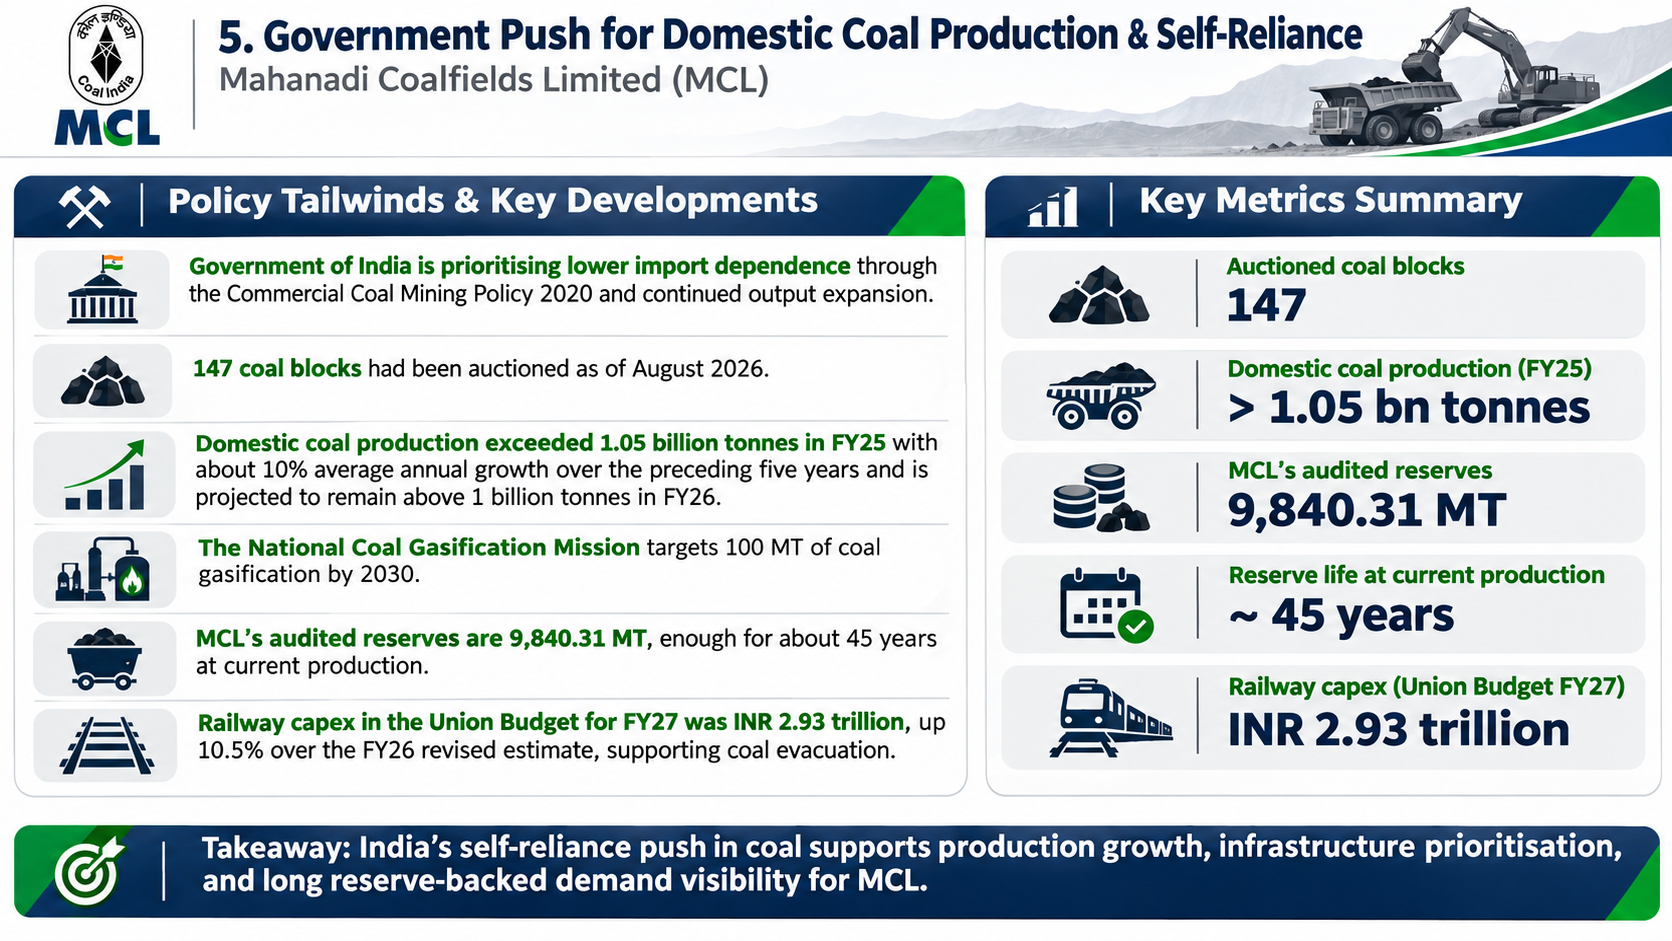
The Government of India has prioritised reducing coal import dependence through measures including the Commercial Coal Mining Policy, 2020, which removed end-use restrictions and introduced auction-based allocation of coal blocks, and continued capacity expansion at Coal India Limited and its subsidiaries, including MCL. As of August 2026, 147 coal blocks had been auctioned under these reforms, broadening the base of commercial and captive coal producers while CIL subsidiaries such as MCL continue to account for the majority of domestic output. Domestic coal production exceeded 1.05 billion tonnes in Fiscal 2025, a 10% average annual growth rate over the preceding five years, and is projected to remain above 1 billion tonnes in Fiscal 2026. For MCL, this policy-driven push supports continued production growth and favourable evacuation and environmental-clearance prioritisation as a strategic national producer.
The key drivers are:
Production growth mandate: National production has grown at approximately 10% per year over the preceding five years, with the GoI continuing to target higher domestic output to curb coal imports and improve energy security
Infrastructure support: The National Coal Gasification Mission targets gasification of 100 MT of coal by 2030, supported by First Mile Connectivity rail projects that directly benefit large integrated producers such as MCL
MCL's reserve advantage: MCL's audited coal reserves of 9,840.31 MT, sufficient for approximately 45 years at current production, position the Company to absorb incremental government-directed production targets without near-term resource constraints
Railway capex: The Union Budget for Fiscal 2027 allocated INR 2.93 trillion for railway capital expenditure, a 10.5% increase over the Fiscal 2026 revised estimate, directly supporting coal evacuation capacity from MCL's Talcher and Ib Valley coalfields
Diversification of Revenue Routes Through E-Auctions and Flexi/Premium Linkages
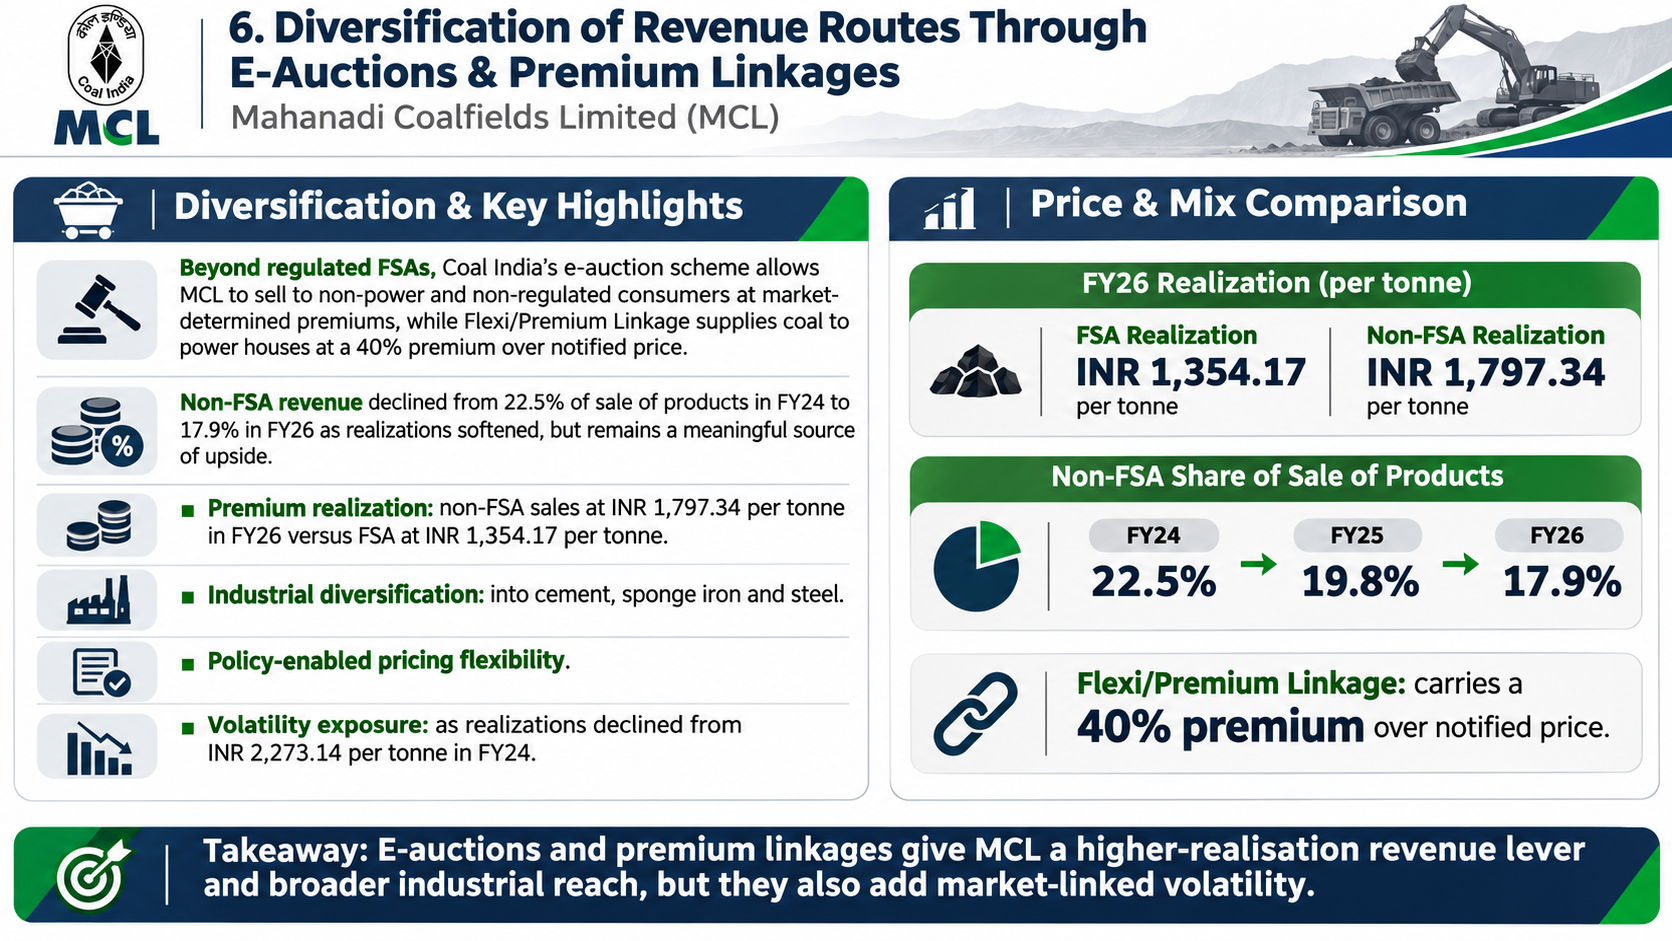
Beyond regulated Fuel Supply Agreements, Coal India Limited's Single Window Mode Agnostic e-auction scheme allows MCL to sell coal at market-determined premiums to non-power and non-regulated consumers, including cement, sponge iron and steel producers, with MCL retaining flexibility to set floor prices under the scheme. MCL also supplies coal under the Flexi/Premium Linkage policy to power houses at a 40% premium over notified prices. While MCL's e-auction and other non-FSA revenue declined from 22.5% of sale of products in Fiscal 2024 to 17.9% in Fiscal 2026 as realisations softened, this channel remains a meaningful source of margin upside relative to notified FSA pricing, particularly during periods of tight domestic coal supply.
The key drivers are:
Premium realisation: E-auction and other non-FSA sales realised INR 1,797.34 per tonne in FY26, materially above the FSA rate of INR 1,354.17 per tonne, despite the e-auction rate itself declining from INR 2,273.14 per tonne in FY24
Industrial diversification: Non-power industrial consumers (cement, sponge iron, steel) accessed through e-auctions diversify MCL's customer base beyond its concentrated power-sector FSA book
Policy-enabled flexibility: The transparent, linkage-based e-auction mechanism replaced the earlier nomination-based system, giving MCL greater control over pricing for the non-FSA portion of its sales
Volatility exposure: Because e-auction and other non-FSA sales are market-priced rather than notified, this driver is also a source of revenue volatility when coal demand softens, as evident in the FY24-FY26 realisation decline
Industry Risks
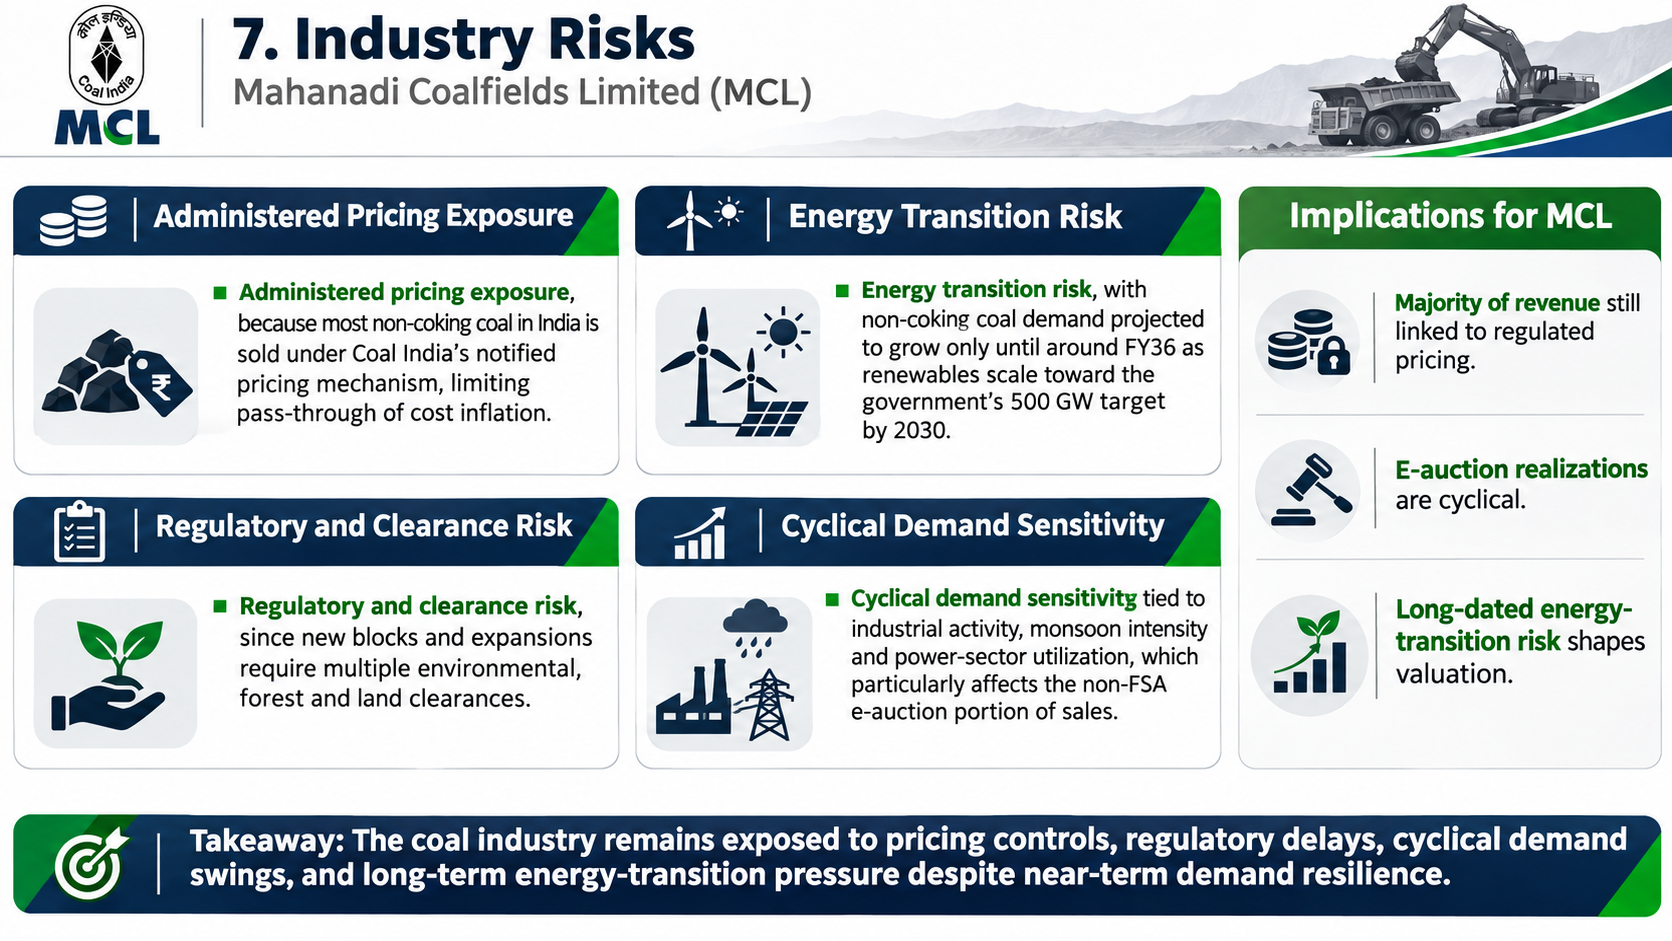
The Indian coal mining industry carries structural risks that affect all producers, including MCL, irrespective of company-specific factors. These stem from the administered nature of domestic coal pricing, the cyclicality of industrial and power demand, regulatory and environmental compliance burdens, and the long-term energy-transition trajectory away from fossil fuels.
The key drivers are:
Administered pricing exposure: The majority of non-coking coal in India is sold under a notified pricing mechanism administered by Coal India Limited rather than being fully market-determined, which limits producers' ability to pass through cost inflation and exposes revenue to policy-driven pricing decisions outside their control
Energy transition risk: Non-coking coal demand is projected to grow only until approximately Fiscal 2036 before potentially declining as renewable energy capacity expands toward the Government's 500 GW renewable target by 2030, creating a multi-decade horizon risk for coal-dependent revenue models
Regulatory and clearance risk: Operationalisation of new coal blocks and expansion of existing mines in India remains subject to complex, multi-agency environmental, forest and land clearance processes, which can delay production ramp-ups across the industry
Cyclical demand sensitivity: Coal demand is closely tied to industrial activity, monsoon intensity (affecting hydropower availability and therefore thermal power offtake) and power-sector capacity utilisation, all of which introduce year-to-year volatility in realisations, particularly for the non-FSA, e-auction portion of sales
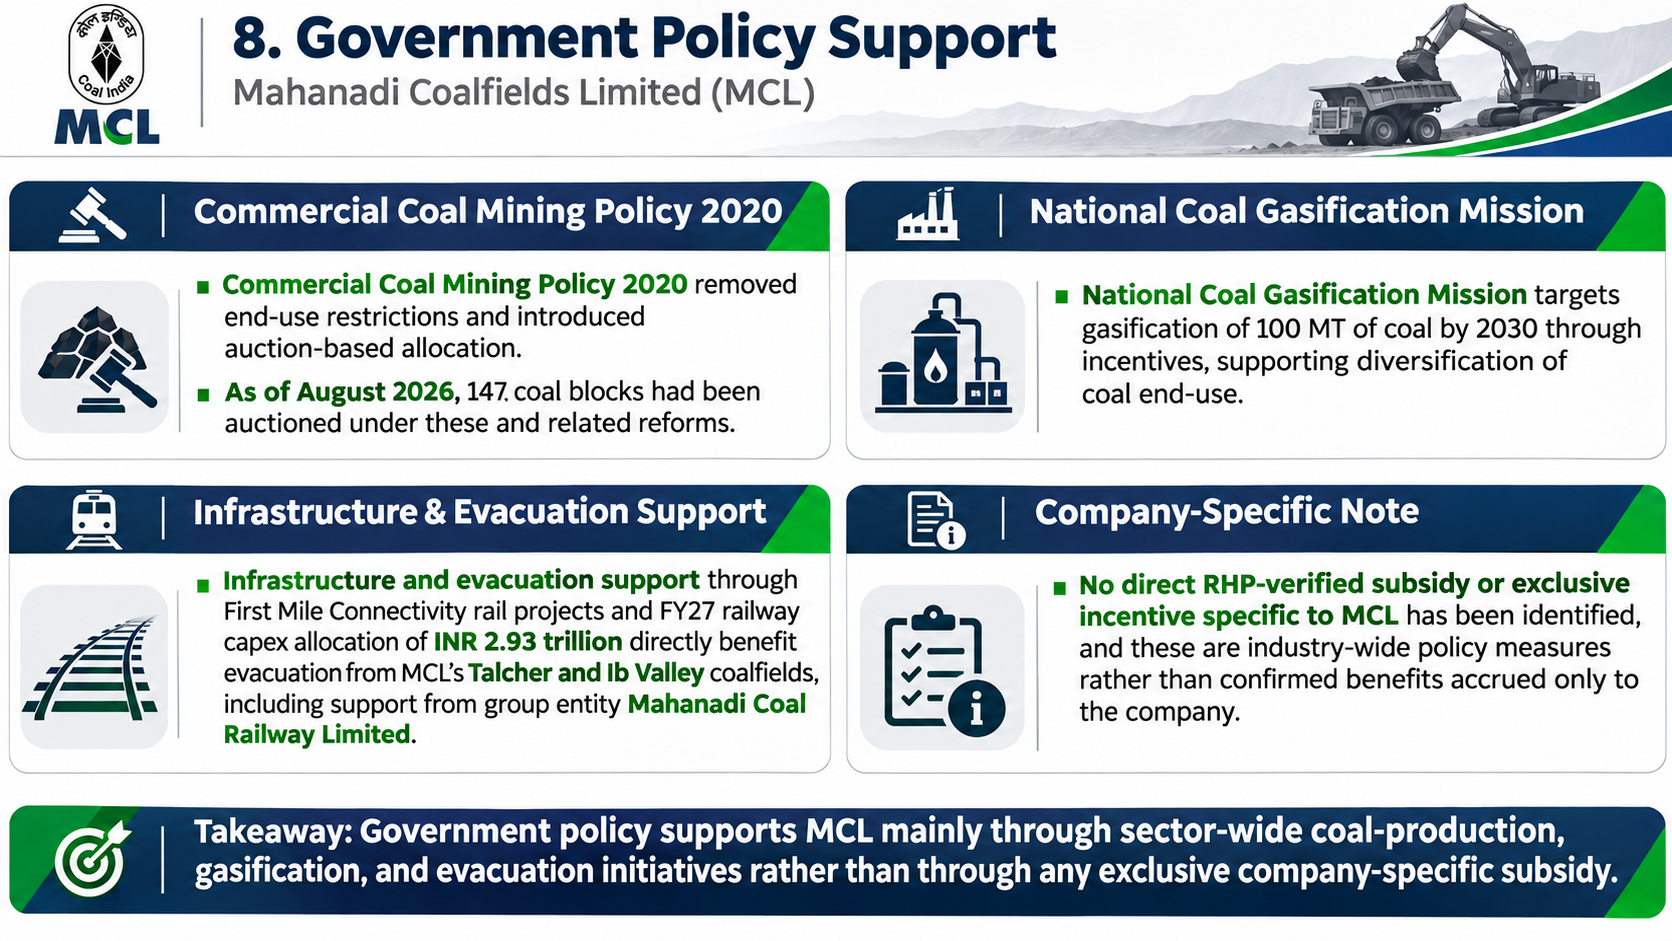
Government Policy Support
The Government of India has pursued a multi-pronged policy agenda to support domestic coal production and the broader coal value chain, several elements of which have a direct bearing on MCL given its status as a Coal India Limited subsidiary.
The key policies are:
Commercial Coal Mining Policy, 2020: Removed end-use restrictions on coal mining and introduced auction-based allocation without captive-use requirements, broadening the producer base; as of August 2026, 147 coal blocks had been auctioned under this and related reforms
National Coal Gasification Mission: Targets gasification of 100 MT of coal by 2030 through financial incentives, supporting diversification of coal end-use and providing a potential future revenue avenue for large producers such as MCL, which has flagged diversification into coal gasification as a strategic consideration
Infrastructure and evacuation support: Continued First Mile Connectivity rail projects and a Fiscal 2027 railway capex allocation of INR 2.93 trillion directly benefit coal evacuation from MCL's Talcher and Ib Valley coalfields, where Mahanadi Coal Railway Limited, a group entity, supports dedicated rail infrastructure
Company-specific benefit: No direct, RHP-verified subsidy or incentive specific to MCL beyond the general industry measures above has been identified; the above are industry-wide policy measures rather than confirmed benefits accrued exclusively to MCL
Fundraise/Future Plans
Shareholding
Pre-issue shareholding
Promoter Holding 0.0%
Category
Pre-Issue%
Promoters
Coal India Limited
100.0%
President of India, acting through Ministry of Coal (Promoter)
0.0%
Total Promoter Holding
100.0%
Additional Shareholders
0.0%
Total Additional Holding
0.0%
Total Shareholding
100.0%
- Overview
- Business
- Financial Highlights
- Industry Overview
- Fundraise/Future Plans
- Documentation
Get the Preqt App and keep in touch around the clock!
 Monitor your investments in real-time.
- Receive tailored deal suggestions.
- Get real-time updates and alerts.