

Manika Plastech
Precision in PlasticsMoulding Industrial Performance
IPO Summary (PreQt)
Manika Plastech Limited is a rigid plastic packaging and moulded-products manufacturer with an operating history since 1996, serving battery, paints, FMCG, automotive and industrial applications. FY26 revenue from operations was INR 436.0 Cr, EBITDA was INR 58.1 Cr and PAT was INR 22.4 Cr; EBITDA margin improved to 13.3% and PAT margin to 5.1% as operating mix and raw-material economics strengthened. The Company operated six manufacturing plants with 28,300 MTPA installed capacity in FY26, while battery casings contributed 56.5% of revenue versus 67.3% in FY24 as pails, thinwall containers and painting scaled. The IPO comprises a fresh issue of approximately INR 92.5 Cr and an OFS of INR 33.0 Cr at the cap price; INR 54.9 Cr of fresh proceeds is earmarked for plant and machinery and INR 15.0 Cr for debt repayment. At INR 40.0-INR 43.0 per share, the issue implies FY26 P/E of approximately 22.4x, with customer concentration, battery-casing dependence, polymer-price volatility and capex execution as the key monitorables.
IPO Review Rating
Average
MainboardEngineering Precision Polymer Solutions for Diverse Industrial Applications
Manika Plastech has delivered moderate topline growth but significantly stronger earnings growth, with Revenue increasing from INR 360.8 Cr in FY24 to INR 436.0 Cr in FY26, while PAT almost doubled to INR 22.4 Cr. The strongest financial trend is margin expansion, with EBITDA Margin improving from 8.6% to 13.3% and ROCE increasing to 18.8%, indicating improving operating efficiency as the business scales. Cash generation remains healthy, with INR 44.3 Cr of FY26 operating cash flow, although OCF conversion has moderated relative to EBITDA as profitability has grown faster. Customer concentration is the key operating risk, with the Top-5 customers contributing 63.0% and Top-10 contributing 73.5% of FY26 Revenue, while battery casings still account for 56.5% of Revenue. The planned ~30.0% capacity expansion and entry into additional packaging applications could broaden the product mix, while INR 15.0 Cr of debt repayment should further improve the balance sheet. Management has more than two decades of sector experience, promoter shares are unpledged and promoter ownership remains high post IPO, although historical compliance matters and concentrated promoter ownership remain monitorables. At the cap price, the Company's 22.4x FY26 P/E represents an approximately 57.8% discount to the 53.0x listed-peer average, while indicative EV/EBITDA of around 10.1x also appears reasonable relative to peers.
PARAMETER
WEIGHT
SCORE
KEY FACTORS
Financial Performance
40.0%
3.0/5
Manika has delivered steady Revenue growth with significantly stronger improvement in margins and earnings, as PAT almost doubled from INR 11.5 Cr in FY24 to INR 22.4 Cr in FY26. EBITDA Margin improved to 13.3%, leverage reduced to 0.6x D/E, ROE remained above 15.0% and operating cash flow stayed positive
Show more
Detailed Analysis
Revenue increased from INR 360.8 Cr in FY24 to INR 406.5 Cr in FY25 and INR 436.0 Cr in FY26, representing a FY24–FY26 CAGR of 9.9%
EBITDA increased from INR 30.9 Cr in FY24 to INR 45.3 Cr in FY25 and INR 58.1 Cr in FY26, while EBITDA Margin expanded from 8.6% to 11.1% and 13.3%
PAT increased from INR 11.5 Cr in FY24 to INR 19.3 Cr in FY25 and INR 22.4 Cr in FY26, while FY26 PAT Margin improved to 5.1%
D/E improved from 0.9x in FY24 to 0.8x in FY25 and 0.6x in FY26, while FY26 borrowings reduced to INR 88.2 Cr
ROE improved from 10.7% in FY24 to 15.4% in FY25 and remained healthy at 15.2% in FY26
Operating cash flow remained positive at INR 36.9 Cr in FY25 and INR 44.3 Cr in FY26, both above reported PAT
Industry
15.0%
2.0/5
The rigid-plastic-packaging industry is in a Growth Phase, although its expected 7.0% CAGR is moderate rather than exceptional. Demand is diversified across several essential consumer and industrial end markets, providing structural stability. Competitive intensity is High because the industry remains fragmented, while regulatory risk is also High due to tightening plastic-waste and EPR obligations
Show more
Detailed Analysis
India's rigid plastic packaging market is projected to increase from INR 98,764.0 Cr in FY24 to INR 1,38,522.0 Cr by FY29P, representing approximately 7.0% CAGR.
Rigid packaging demand continues to expand across batteries, food, dairy, paints, chemicals, FMCG and other organised end-use industries
Plastic packaging is subject to Plastic Waste Management and EPR obligations, including progressively increasing recycling and recycled-content requirements
Management
15.0%
4.0/5
Manika is led by a deeply experienced promoter family with more than two decades of sector experience, complemented by a Board with 50.0% independent representation. Promoter shares are unpledged and promoter ownership remains substantial after the IPO despite the VRIDAA Holding Trust OFS
Show more
Detailed Analysis
Promoters have 23–29+ years of RPP-industry experience; Munjal Kapadia also has listed-company Board exposure as an Independent Director of Kabra Extrusion Technik
The Board comprises 8 Directors, including 4 Independent Directors, resulting in exactly 50.0% independent representation
No promoter shares are pledged, although a historical company-secretary compliance matter involving the Company and four individual Promoters is pending for compounding
Valuation
20.0%
5.0/5
At INR 43.0, Manika is valued at approximately 22.4x FY26 PAT, representing a substantial 57.8% discount to the 53.0x disclosed peer average. Indicative EV/EBITDA of around 10.1x is also below the selected-peer average, while historical P/B of 2.8x is comparatively moderate and FY26 RoNW stands at 15.2%. The valuation is supported further by the fact that 73.7% of the issue is fresh capital
Show more
Detailed Analysis
Post-Issue Market Cap of INR 501.0 Cr divided by FY26 PAT of INR 22.4 Cr implies 22.4x P/E, approximately 57.8% below the 53.0x peer average
Conservative indicative EV/EBITDA is approximately 10.1x, versus current selected-peer average of approximately 24.7x, giving a peer/issuer ratio of around 2.4x
FY26 Return On Net Worth stood at approximately 15.2%
Merchant Banker Track Record
10.0%
4.0/5
Pantomath Capital has built a healthy recent Mainboard IPO track record, with approximately 88.9% positive listings across its 2025–2026 completed cohort and strong investor demand in its latest 2026 transactions. Recent listing performance has also been positive, with the two 2026 issues averaging more than 20.0% opening gains
Show more
Detailed Analysis
Across Pantomath's 9 completed Mainboard IPOs during 2025–2026, the weighted average listing gain is approximately 13.0%
Pantomath's two latest 2026 Mainboard IPOs, Ardee Industries and Knack Packaging, were subscribed 138.8x and 87.2x, respectively, averaging approximately 113.0x
8 of 9 recent 2025–2026 Mainboard IPOs, or approximately 88.9%, recorded positive listing performance
TOTAL
100%
3.5/5
Weighted Composite Score
Issue Price
₹40.0 to ₹43.0
As of 10 Sep 2026
GMP
₹17.0
As of 10 Sep 2026
Estimated Gain / Loss
+39.5%
Lot Size
348.0 Shares
Grey Market Premium (GMPs) are shared for knowledge purpose only. PrEqt doesn’t promote or execute the trades.
| Issue Size (in Cr) | |
|---|---|
| Overall | ₹125.5 Cr |
| Fresh Issue | ₹92.5 Cr |
| Offer for Sale | ₹33.0 Cr |
Minimum Investment
₹14,964.0 / 1,21,104 shares

Merchant Banker
Pantomath Capital Advisors Pvt.Ltd. ; MUFG Intime India Pvt Ltd
IPO Document
RHP / Anchor Document
Offer Start Date
11th Sept 2026
Offer End Date
16th Sept 2026
Valuation
₹501.0 Cr
Revenue (FY'26)
₹436.0 Cr
PAT (FY'26)
₹22.4 Cr
Issue Size (in Cr)
₹125.5 Cr
Face Value
₹ 2.0Offer Price
₹ 43.0Lot Size
348.0 sharesSale Type
Fresh capital cum OFSPAT (FY'26)
₹ 22.4 CrPAT Margin (FY'26)
5.1 %P/E Multiple
18.2xEBITDA (FY'26)
₹ 24.4 CrCAGR Growth 2Y
9.9 %ROE (FY'26)
15.2 %ROCE (FY'26)
18.8 %Price to Book Value
2.8xDebt/Equity
0.6xCompany Website
www.manikaplastech.comExplore new deals
Overview
Fund Allocation
Total: ₹0 CrSource:Company DRHP
Timeline
IPO Open Date
To Be Announced
IPO Close Date
To Be Announced
Tentative Allotment
To Be Announced
Initiation of Refunds
To Be Announced
Credit of Shares to Demat
To Be Announced
Tentative Listing Date
To Be Announced
Business
Business Model
Geographical Presence
Sales Channel
Clients
Key Risk Factor
Financial Highlights
Income Statement
Revenue growth with EBITDA and PAT margins
| Financial Metric | FY 2024 | FY 2025 | FY 2026 |
|---|---|---|---|
| Revenue (₹ Cr) | 360.8 | 406.5 | 436.0 |
| Growth (%) | - | 12.7% | 7.3% |
| EBITDA (₹ Cr) | 30.9 | 45.3 | 58.1 |
| EBITDA Margin (%) | 8.6% | 11.1% | 13.3% |
| PAT (₹ Cr) | 11.5 | 19.3 | 22.4 |
| PAT Margin (%) | 3.1% | 4.7% | 5.1% |
OBSERVATIONS & INSIGHTS
FY25 growth of 12.7% was driven by stronger battery and paint-pail demand, volumes and realizations; FY26 growth moderated to 7.3% as pails, thinwall and painting expanded while battery-casing mix reduced
EBITDA increased from INR 30.9 Cr in FY24 to INR 58.1 Cr in FY26 as revenue scaled and mix / operating efficiency improved
EBITDA Margin expanded from 8.6% to 11.1% and 13.3%; FY25 benefited from operating leverage, while FY26 also benefited from favourable raw-material pricing and better mix
PAT increased sharply in FY25 and by 15.9% in FY26 as operating-profit growth outweighed higher finance cost; FY26 growth slowed because finance cost and taxes increased with scale
PAT Margin improved from 3.1% in FY24 to 4.7% in FY25 and 5.1% in FY26 because EBITDA margin expanded faster than finance / depreciation burden, although higher interest and taxes limited the pace of improvement
Balance Sheet
| Financial Metric | FY 2024 | FY 2025 | FY 2026 |
|---|---|---|---|
| Net Worth | ₹ 108.0 Cr | ₹ 125.2 Cr | ₹ 147.6 Cr |
| Total Assets | ₹ 252.9 Cr | ₹ 321.0 Cr | ₹ 323.7 Cr |
| Total Borrowing | ₹ 93.1 Cr | ₹ 97.5 Cr | ₹ 88.2 Cr |
| Reserves & Surplus | ₹ 88.1 Cr | ₹ 105.3 Cr | ₹ 127.7 Cr |
OBSERVATIONS & INSIGHTS
PPE increased from INR 118.7 Cr in FY24 to INR 148.0 Cr in FY26 as the Company added moulding / operating capacity and related manufacturing assets
Inventory increased sharply in FY25 with scale and capacity, then reduced to INR 60.8 Cr in FY26 despite higher revenue, indicating some year-end inventory normalization
Trade receivables increased to INR 65.8 Cr as revenue scaled; the FY26 increase slightly exceeded revenue growth, consistent with the rise in debtor days
Total assets expanded materially in FY25 due to PPE, inventory and receivable growth, but were almost flat in FY26 as capex slowed and inventory / other-current-asset balances reduced
Reserves & surplus / other equity increased each year through retained earnings, lifting total equity from INR 108.0 Cr to INR 147.6 Cr
Total equity increased 18.0% in FY26 as profitable operations added to reserves; no change in share capital occurred during FY24-FY26 on the restated basis
Combined current and non-current borrowings rose to INR 97.4 Cr in FY25 during the capex cycle, then reduced to INR 88.2 Cr in FY26 through net repayment
Trade payables increased materially in FY25 alongside procurement and inventory build, then reduced to INR 26.6 Cr in FY26 as the closing supplier-credit position normalized
Cash Flow
| Financial Metric | FY 2024 | FY 2025 | FY 2026 |
|---|---|---|---|
CFO (₹ Cr) Cash generated from core business operations. | +35.4 Cr | +36.9 Cr | +44.3 Cr |
CFI (₹ Cr) Cash used for investments and long-term assets. | -53.3 Cr | -23.1 Cr | -18.7 Cr |
CFF (₹ Cr) Cash flow related to funding and borrowings. | +17.8 Cr | -13.0 Cr | -26.4 Cr |
Working Capital
| Efficiency Metric | FY 2023 | FY 2024 | FY 2025 |
|---|---|---|---|
Debtor Days Average number of days taken to collect customer payments. | - | - | - |
Creditor Days Average time taken to pay suppliers and vendors. | - | - | - |
Inventory Days Average number of days inventory remains unsold. | - | - | - |
CCC (Cash Conversion Cycle) (Debtor Days + Inventory Days - Creditor Days) | - | - | - |
Financial Ratios
Measures the company’s leverage relative to shareholder equity.
OBSERVATIONS & INSIGHTS
ROE improved sharply in FY25 as PAT grew faster than net worth; FY26 was broadly stable because equity accretion slightly outpaced PAT growth
ROCE increased to 18.8% in FY26 as EBIT expanded and borrowings reduced, indicating improving productivity of the capital base
ROA closing-balance proxy improved from 4.6% to 6.9% as PAT nearly doubled across FY24-FY26 while total assets grew much more slowly
Current Ratio improved to 1.1x in FY26 as current liabilities declined faster than current assets, providing modestly better short-term liquidity
Debt / Equity reduced from 0.9x to 0.6x as borrowings declined in FY26 and retained earnings increased total equity; this is a PrEqt calculation using borrowings less cash / bank balances
Interest Coverage improved from 1.9x to 2.9x because EBIT growth outpaced the increase in finance cost, strengthening pre-IPO debt-servicing headroom
Industry Overview
Industry Drivers
Scale-up of Rigid Plastic Packaging and Organized Consumption
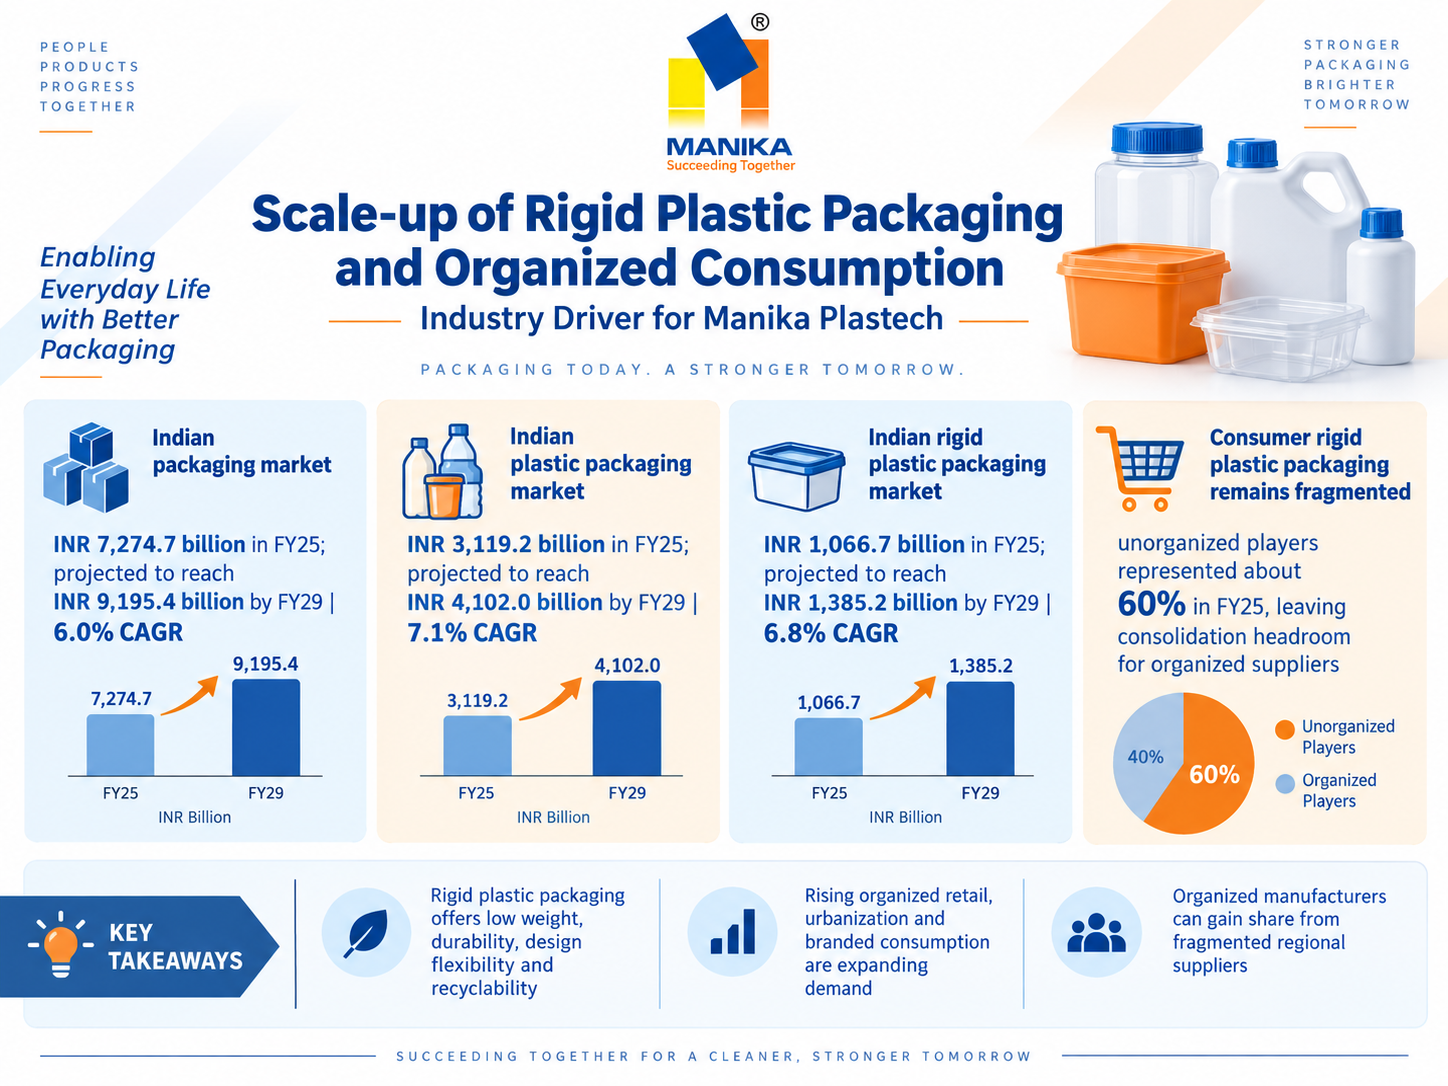
Rigid plastic packaging combines low weight, durability, design flexibility and recyclability across consumer and industrial applications. Rising organized retail, urbanization and branded consumption improve the addressable market for standardized, visually differentiated and high-quality packaging, while organized manufacturers can gain share from fragmented regional suppliers.
The key drivers are:
• Indian packaging market: INR 7,274.7 billion in FY25; projected INR 9,195.4 billion by FY29 at 6.0% CAGR
• Indian plastic packaging market: INR 3,119.2 billion in FY25; projected INR 4,102.0 billion by FY29 at 7.1% CAGR
• Indian rigid plastic packaging market: INR 1,066.7 billion in FY25; projected INR 1,385.2 billion by FY29 at 6.8% CAGR
• Consumer RPP remains fragmented: unorganized players represented about 60% in FY25, leaving consolidation headroom for organized suppliers
Battery Storage, Renewables and Automotive Demand
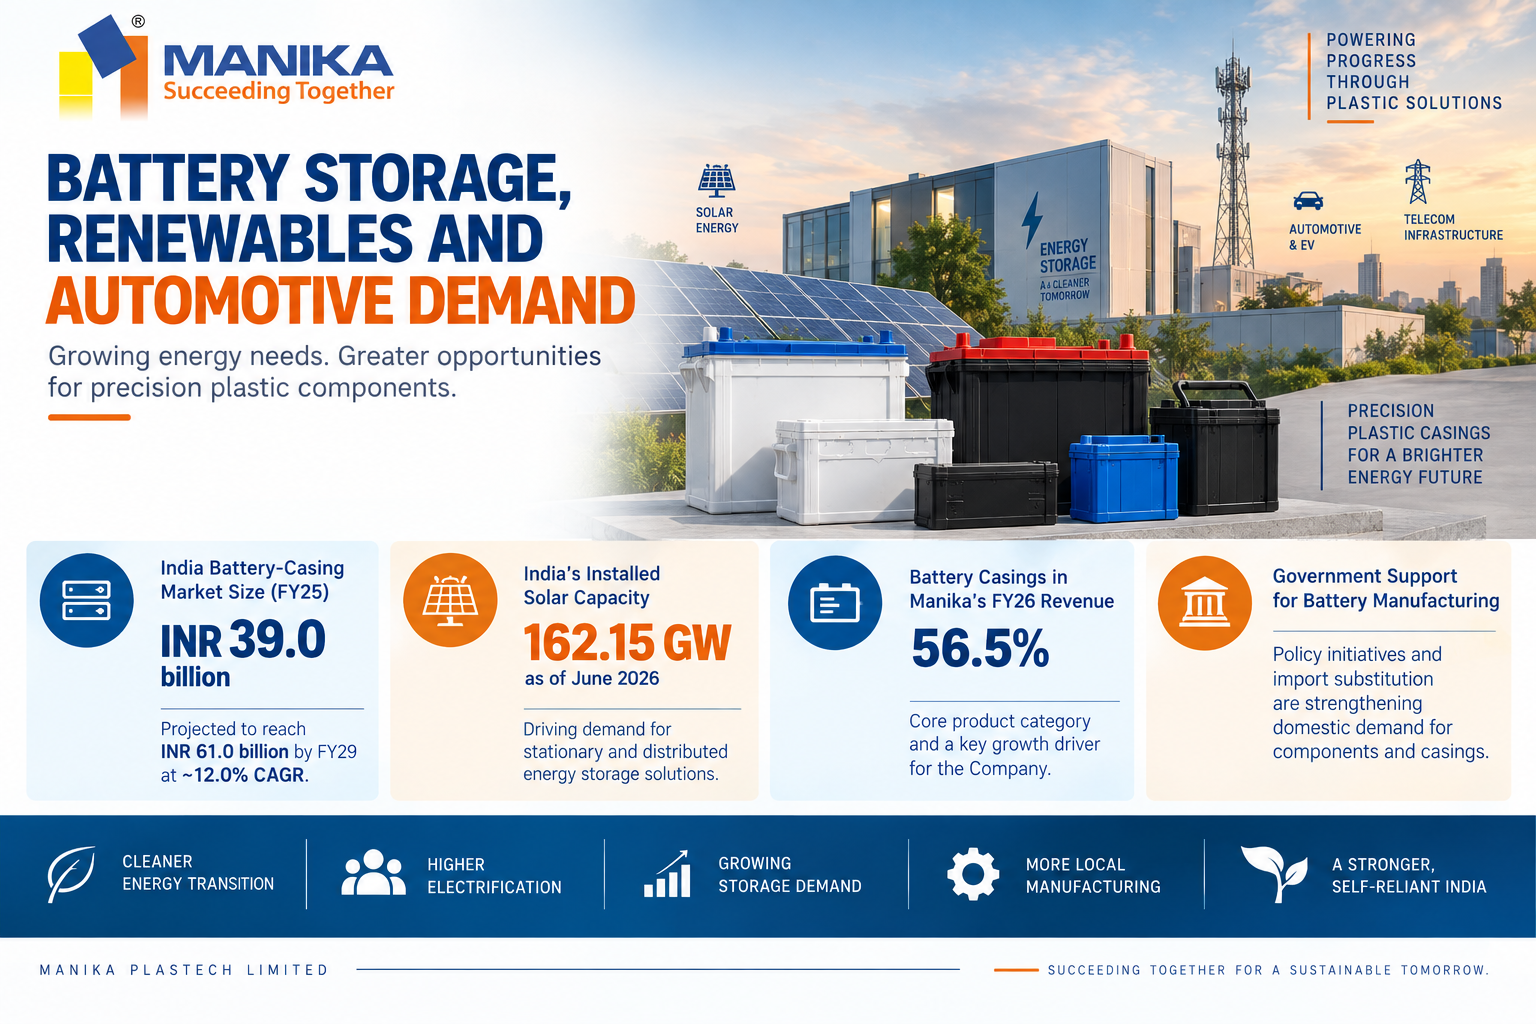
Battery casings are a core demand pool for Manika and are linked to power backup, solar, telecom, automotive and emerging energy-storage applications. Growth in renewable capacity, household electrification and battery manufacturing increases the need for safe, durable and precision-moulded casings, although technology transitions within batteries remain a monitorable factor.
The key drivers are:
• India battery-casing market: INR 39.0 billion in FY25, projected to INR 61.0 billion by FY29 at about 12.0% CAGR
• India's installed solar capacity reached 162.15 GW as of June 2026, supporting stationary and distributed storage requirements
• Battery casings contributed 56.5% of Manika's FY26 revenue, making sector growth strategically material to the issuer
• Government support for domestic battery manufacturing and lower import dependence strengthens localization demand for components and casings
Paints, FMCG and New Packaging Applications
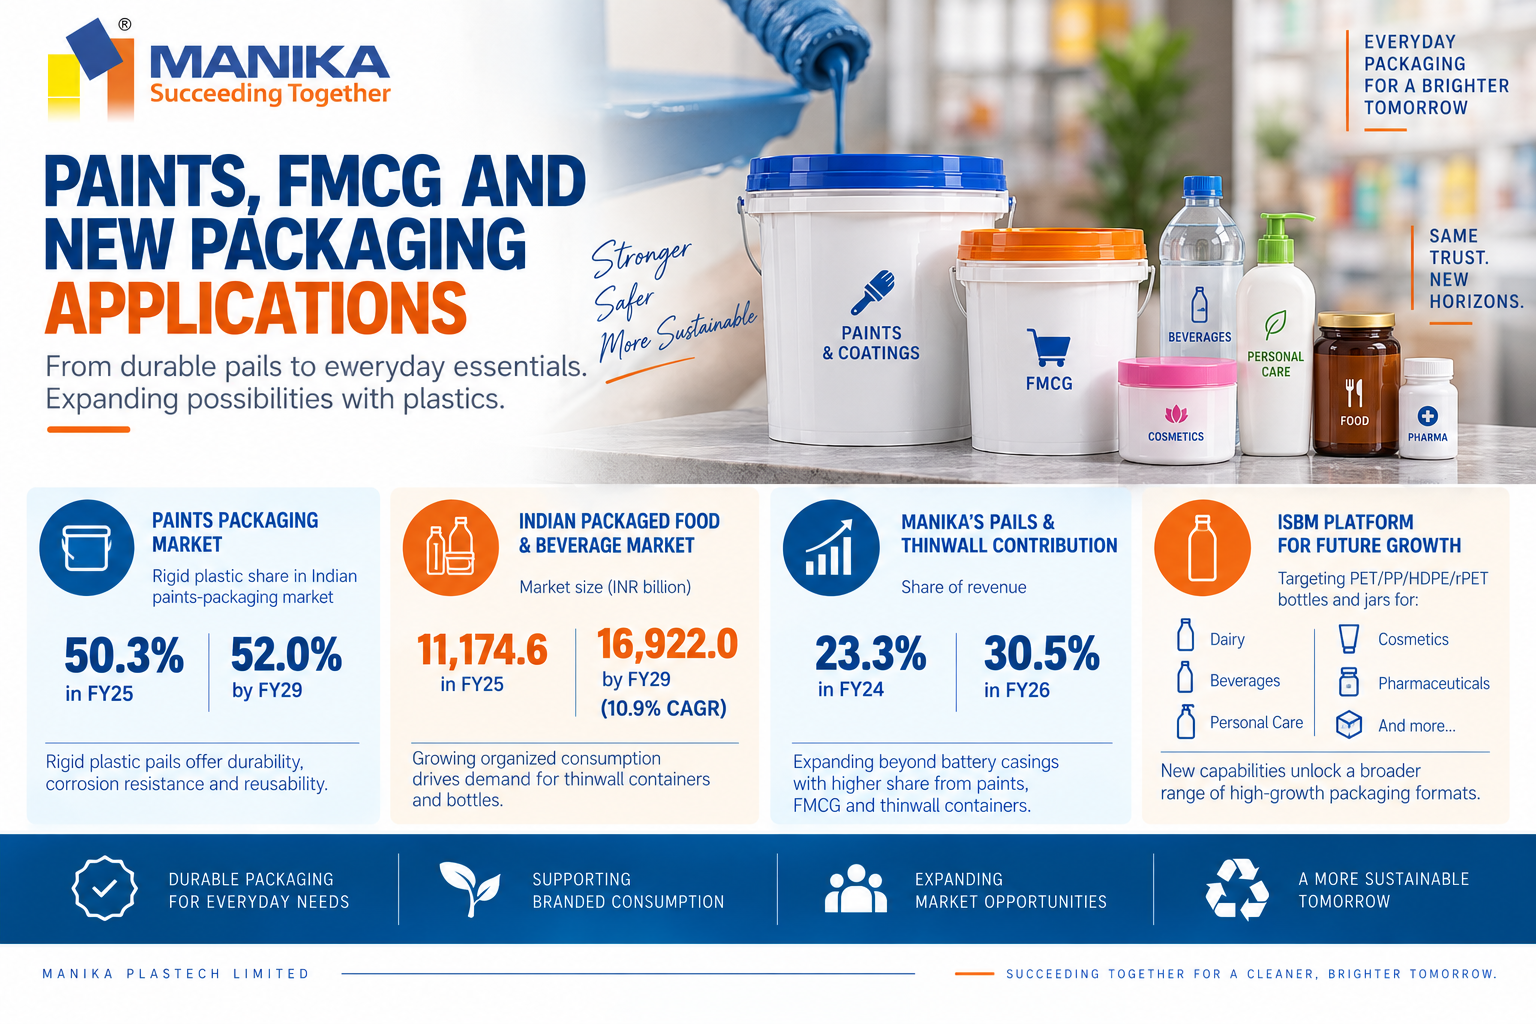
Pails, thinwall containers and future bottle formats provide a second growth engine beyond battery casings. Paints and coatings favour rigid plastic pails for corrosion resistance, handling and reusability, while packaged food, dairy and FMCG demand supports thinwall and bottle applications. Manika's planned ISBM capability broadens its addressable categories toward personal care, beverages and pharmaceuticals.
The key drivers are:
• Rigid plastic represented about 50.3% of the Indian paints-packaging market in FY25 and is projected at about 52.0% by FY29
• Indian packaged food and beverage market increased to INR 11,174.6 billion in FY25 and is projected at INR 16,922.0 billion by FY29, a 10.9% CAGR
• Manika's pails & thinwall contribution increased from 23.3% of revenue in FY24 to 30.5% in FY26
• The proposed ISBM platform targets PET/PP/HDPE/rPET bottles and jars for dairy, beverages, personal care, cosmetics and pharmaceutical applications
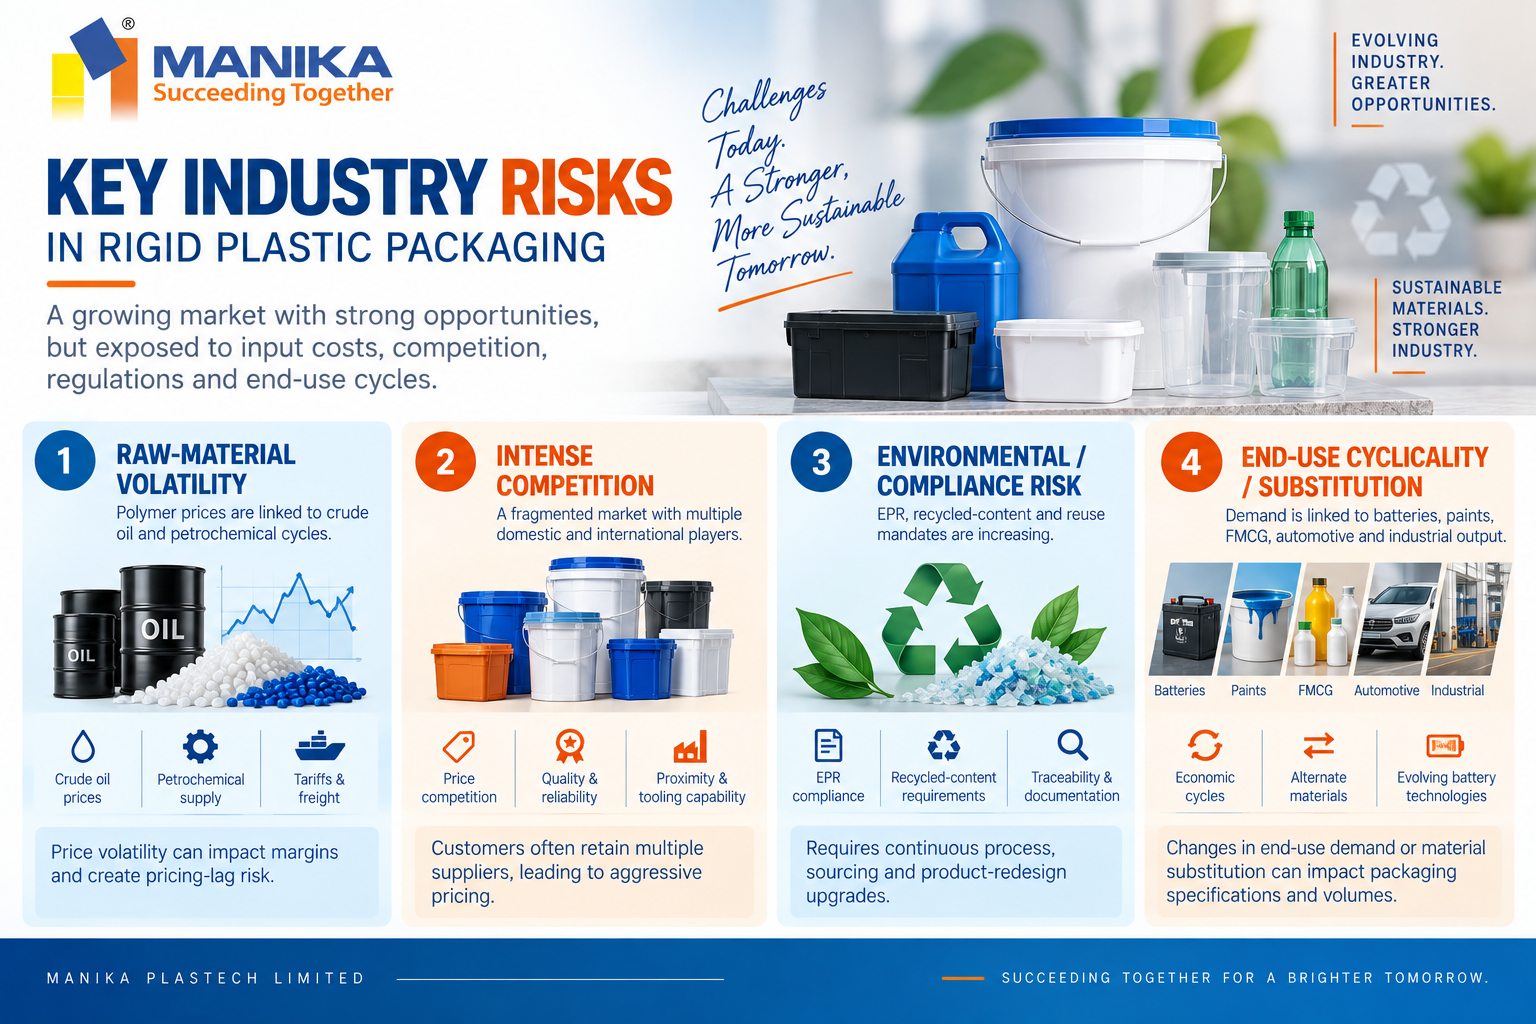
Risks in the Industry
Rigid plastic packaging economics remain exposed to feedstock volatility, regulatory tightening and intense price competition. Resin prices are linked to crude oil and petrochemical cycles, while customers often retain multiple suppliers and negotiate aggressively. Sustainability rules are structurally supportive for compliant organized players but can also increase recycled-content, traceability and product-redesign costs.
The key risks are:
• Raw-material volatility: PP, PE, PET and other polymer prices move with crude oil, petrochemical supply, tariffs and freight, creating margin and pricing-lag risk
• Competition and price pressure: domestic and international converters compete on price, proximity, quality and tooling capability; the fragmented market can encourage aggressive pricing
• Environmental / compliance risk: EPR, recycled-content and reuse mandates require continuous process, sourcing and documentation upgrades
• End-use cyclicality / substitution: demand depends on batteries, paints, FMCG, automotive and industrial output, while alternative materials and new battery technologies can shift packaging specifications
Government Policy Support
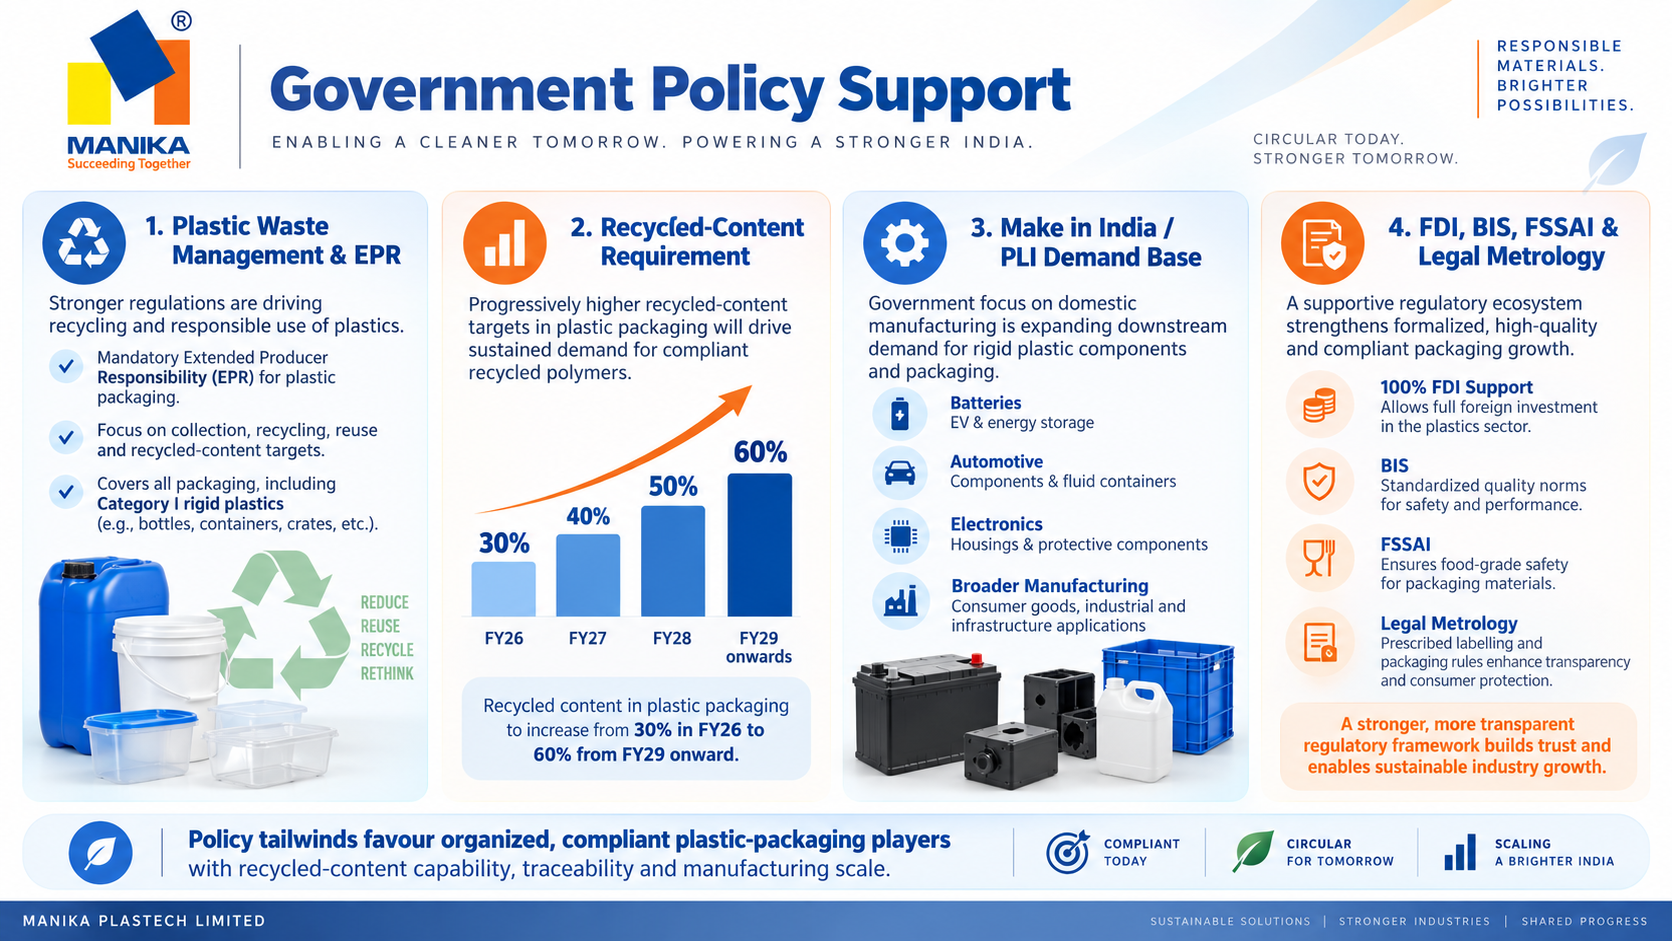
Policy support is strongest through manufacturing localization and the circular-economy framework rather than direct subsidies to packaging converters. Make in India / PLI-led expansion in batteries, automobiles and consumer manufacturing expands the downstream demand base, while Plastic Waste Management and EPR rules favour organized suppliers able to meet recycled-content, reuse and traceability requirements.
The key policies are:
• Plastic Waste Management Rules and 2022/2026 amendments: mandatory EPR, recycling, reuse and recycled-content targets apply to plastic packaging, including Category I rigid plastics
• Category I recycled-content requirement: 30% in FY26, rising progressively to 60% from FY29 onward, supporting demand for compliant recycled polymers
• Make in India / PLI programs: domestic battery, automotive, electronics and manufacturing investment expands the customer base for rigid plastic components and packaging
• FDI / manufacturing framework: the industry report notes 100% FDI through a simplified route for packaging investment, while BIS, FSSAI and Legal Metrology standards support standardized quality and labelling
Fundraise/Future Plans
Shareholding
Pre-issue shareholding
Promoter Holding 0.0%
Post-Issue Shareholding
Promoter Holding 0.0%
Category
Pre-Issue%Post-Issue%
Promoters
Nikunj Mohanlal Kapadia
0.8%0.6%
Munjal Nikunj Kapadia
0.5%0.4%
Mihir Nikunj Kapadia
0.5%0.4%
Pratik Nikunj Kapadia
0.5%0.4%
VRIDAA Holding Trust
97.0%72.5%
Total Promoter Holding
99.3%74.3%
Additional Shareholders
0.0%0.0%
Total Additional Holding
0.0%0.0%
Total Shareholding
99.3%74.3%
- Overview
- Business
- Financial Highlights
- Industry Overview
- Fundraise/Future Plans
- Documentation
Get the Preqt App and keep in touch around the clock!
 Monitor your investments in real-time.
- Receive tailored deal suggestions.
- Get real-time updates and alerts.
