


Manipal Payment & Identity Solutions (Manipal Cards)
Securing Every TransactionPowering Secure Payments
IPO Summary (PrEqT)
Manipal Payment and Identity Solutions Limited ("MPISL") is a payments, identity, secure-printing and smart-tagging solutions provider serving banks, FinTechs, NBFCs and governments in India and overseas. FY26 revenue from operations increased 5.6% to INR 1,326.8 Cr and EBITDA increased 11.5% to INR 455.8 Cr, lifting EBITDA margin to 33.6%; PAT declined 10.2% to INR 253.5 Cr because FY25 included an INR 110.0 Cr exceptional gain, while FY26 underlying operating profitability improved. The Company billed 86.2 million banking cards in FY26, held estimated Indian issuance-market shares of 36.4% in credit cards and 30.9% in debit cards, and generated 7.2% of revenue from exports versus 1.4% in FY24. The IPO comprises INR 320.0 Cr of fresh capital and an approximately INR 485.0 Cr OFS at the cap price; INR 238.4 Cr, or 74.5% of the fresh issue, is proposed for equipment capex. At INR 322.0-INR 339.0 per share, the issue implies P/E of 31.0x and post-issue market capitalization of INR 7,464.1-INR 7,858.2 Cr.
IPO Review Rating
Average
MainboardConnecting Payments, Identity, and Technology Through Secure Innovation
The Company has delivered modest topline growth, with Revenue increasing from INR 1,247.5 Cr in FY24 to INR 1,326.8 Cr in FY26, representing a 3.1% CAGR, while FY26 Revenue grew 5.6% YoY. Profitability remains a major strength, with EBITDA increasing from INR 355.6 Cr in FY24 to INR 455.8 Cr in FY26 and EBITDA Margin expanding from 28.0% to 33.6%. FY26 PAT stood at INR 253.5 Cr, down 10.2% YoY from INR 282.2 Cr in FY25; however, FY25 included approximately INR 110.0 Cr of exceptional income, making the headline decline less reflective of underlying operating performance. The financial position is comfortable, with low leverage, strong FY26 ROE of 29.4% and positive operating cash generation, supporting the quality of the Company's underlying profitability. Customer diversification is healthy, with the largest customer contributing only 9.9% of FY26 Revenue, although the Top-10 customers still represented 58.7% of Revenue. The Company benefits from a differentiated position in payment cards, personalisation and secure identity solutions, supported by certifications across major payment networks and an expanding international presence across Asia-Pacific, the Middle East, Africa, Europe and the UK. Governance requires closer monitoring because the IPO has a 60.2% OFS, historical related-party activity is material, and outstanding promoter/company litigation creates additional risk despite the strength of the operating business.
PARAMETER
WEIGHT
SCORE
KEY FACTORS
Financial Performance
40.0%
4.0/5
Profitability, leverage, cash generation and customer diversification are all strong. The clear weakness is low underlying Revenue growth, while FY26 OCF and RoE have moderated from earlier levels.
Show more
Detailed Analysis
Revenue increased only modestly from INR 1,247.5 Cr in FY24 to INR 1,256.1 Cr in FY25 and INR 1,326.8 Cr in FY26, giving a FY24–FY26 CAGR of just 3.1%
EBITDA increased to INR 455.8 Cr with a 33.6% margin, while FY26 PAT stood at INR 253.5 Cr with an 18.7% margin
FY26 PAT was below FY25 PAT of INR 282.2 Cr, although FY25 included a significant exceptional item
FY26 Debt/Equity was effectively 0.0x, versus 0.8x in FY25 and 1.1x in FY24
FY26 RoE remained strong at 29.4%
Operating cash flow was INR 207.7 Cr in FY26 and INR 284.4 Cr in FY25, although FY26 saw materially higher investment in inventory, receivables and other working-capital assets
Customer concentration is relatively comfortable for a B2B company: the largest customer accounted for only 9.9% of FY26 Revenue
Industry
15.0%
3.0/5
This is an attractive structural market with 20%+ value growth, low penetration and premiumisation toward credit/metal cards.
Show more
Detailed Analysis
India's total card-issuance market to reach 575.0 million units by FY30, with units growing at 12.9% CAGR and market value growing at 20.8% CAGR during FY26–FY30.
India has approximately 1 payment card per person aged 15+, versus 7.2 in the US, 8.0 in China and 2.3 in Europe, giving a long runway for card issuance despite UPI growth
Manipal is a significant participant. Frost & Sullivan estimates its share at approximately 31.7% of India's FY26 credit and debit card issuance market, while it ranked 11th globally in chip-card shipments in the Nilson data reproduced in the report
Payment manufacturing and personalization require stringent security, network and infrastructure certifications. Manipal itself holds certifications across Visa, Mastercard, RuPay and several global networks, creating barriers to entry but also increasing compliance risk
Management
15.0%
3.0/5
Operational experience and Board composition are credible, but the combination of large promoter OFS, material promoter litigation and related-party complexity creates another perspective.
Show more
Detailed Analysis
CEO Kukkundoor Girish Kini has 28+ years of payment-card industry experience, while promoter and Non-Executive Director Tonse Gautham Pai has 18+ years across payment cards, printing, publication and packaging
The Board has eight Directors, comprising one Executive Director, three Non-Executive Directors and four Independent Directors, giving exactly 50.0% independent representation
Tonse Gautham Pai had provided a personal guarantee relating to MVP Group International's Bank of Baroda facilities; the bank invoked the guarantee for USD 77.5 million plus interest, and related proceedings remain pending. The RHP itself identifies the monetary exposure and associated reputation/business risk as material. The Company also has 16 tax proceedings involving approximately INR 143.3 Cr of disputed amounts.
Related-party transactions were INR 201.9 Cr or 15.2% of FY26 Revenue.
Valuation
20.0%
2.0/5
31.0x P/E, 17.2x EV/EBITDA and 6.9x P/B are demanding, particularly when the directly disclosed listed peer trades at a lower P/E and EV/EBITDA. Strong RoNW supports some premium, but not enough to make the issue appear cheap.
Show more
Detailed Analysis
Manipal is trading at a P/E of 31.0x, the RHP identifies Seshaasai Technologies as the only listed industry peer, with a P/E of 25.0x. Therefore, Manipal is being offered at approximately a 24.2% P/E premium to its disclosed peer
Manipal is trading at a 17.2x EV/EBITDA, Seshaasai currently trades around 14.8x EV/EBITDA, making Manipal roughly 17% richer on this measure as well.
At INR 339.0 versus FY26 NAV of INR 48.8 per share, P/B works out to a high 6.9x.
FY26 RoNW of 22.9%
Merchant Banker Track Record
10.0%
4.0/5
Manipal Payment and Identity Solutions is backed by a strong institutional BRLM consortium comprising Motilal Oswal Investment Advisors, Axis Capital, ICICI Securities, IIFL Capital Services and Nuvama Wealth Management.
Show more
Detailed Analysis
Across the latest 10 IPOs disclosed for each of the five BRLMs, average listing-day opening return of approximately 14.2%
Across the latest 10 IPOs disclosed for each of the five BRLMs, with 35 of 50 observations, or 70.0%, opening above their respective issue prices
Across the current fiscal and preceding two fiscals, Motilal Oswal disclosed 37 IPOs, Axis Capital 53 IPOs, ICICI Securities 53 IPOs, IIFL Capital 52 IPOs and Nuvama 27 IPOs
TOTAL
100%
3.3/5
Weighted Composite Score
Issue Price
₹322.0 to ₹339.0
As of 5 Sep 2026
GMP
₹29.0
As of 5 Sep 2026
Estimated Gain / Loss
+8.5%
Lot Size
44.0 Shares
Grey Market Premium (GMPs) are shared for knowledge purpose only. PrEqt doesn’t promote or execute the trades.
| Issue size | |
|---|---|
| Overall | ₹805.0 Cr |
| Fresh Issue | ₹320.0 Cr |
| Offer for Sale | ₹485.0 Cr |
Minimum Investment
₹14,916.0 / 1,936 shares

Merchant Banker
Motilal Oswal Investment Advisors Ltd.; Axis Capital; ICICI Securities; IIFL Capital; Nuvama
IPO Document
RHP / Anchor Document
Offer Start Date
9th Sept 2026
Offer End Date
11th Sept 2026
Valuation
₹7,858.2 Cr
Revenue (FY'26)
₹1,356.6 Cr
PAT (FY'26)
₹253.5 Cr
Issue Size
₹805.0 Cr
Face Value
₹ 2.0Offer Price
₹ 339.0Lot Size
44.0 sharesSale Type
Fresh capital cum OFSPAT (FY'26)
₹ 253.5 CrPAT Margin (FY'26)
18.7 %P/E Multiple
31.0xEBITDA (FY'26)
₹ 455.8 CrCAGR Growth 2Y
3.1 %ROE (FY'26)
29.4 %ROCE (FY'26)
32.7 %Price to Book Value
6.9xDebt/Equity
0.0xCompany Website
mpimanipal.comExplore new deals
Overview
Fund Allocation
Total: ₹0 CrSource:Company DRHP
Timeline
IPO Open Date
To Be Announced
IPO Close Date
To Be Announced
Tentative Allotment
To Be Announced
Initiation of Refunds
To Be Announced
Credit of Shares to Demat
To Be Announced
Tentative Listing Date
To Be Announced
Business
Business Model
Geographical Presence
Sales Channel
Key Risk Factor
Financial Highlights
Income Statement
Revenue growth with EBITDA and PAT margins
| Financial Metric | FY 2024 | FY 2025 | FY 2026 |
|---|---|---|---|
| Revenue (₹ Cr) | 1,268.0 | 1,277.1 | 1,356.6 |
| Growth (%) | - | 0.7% | 5.6% |
| EBITDA (₹ Cr) | 355.6 | 408.8 | 455.8 |
| EBITDA Margin (%) | 28.0% | 32.0% | 33.6% |
| PAT (₹ Cr) | 249.2 | 282.2 | 253.5 |
| PAT Margin (%) | 19.7% | 22.1% | 18.7% |
OBSERVATIONS & INSIGHTS
Revenue FY26 grew 5.6%, led by secure logistics and tax stamps / holograms / thermal / RFID products; banking-card volume remained broadly flat
EBITDA increased 11.5% as material cost intensity reduced and higher-value secure / premium products improved mix. EBITDA Margin expanded to 33.6% from 32.0%; material cost was 31.6% of revenue in FY26 versus 34.1% in FY25 and 43.5% in FY24
PAT declined 10.2% because FY25 included an INR 110.0 Cr exceptional gain; underlying profit before exceptional items improved materially in FY26
Balance Sheet
| Financial Metric | FY 2024 | FY 2025 | FY 2026 |
|---|---|---|---|
| Net Worth | ₹ 89.6 Cr | ₹ 304.2 Cr | ₹ 791.9 Cr |
| Total Assets | ₹ 1,102.7 Cr | ₹ 1,409.7 Cr | ₹ 1,160.9 Cr |
| Total Borrowing | ₹ 449.5 Cr | ₹ 472.9 Cr | ₹ 0.4 Cr |
| Reserves & Surplus | ₹ 48.3 Cr | ₹ 262.9 Cr | ₹ 747.4 Cr |
OBSERVATIONS & INSIGHTS
Total Equity increased to INR 791.9 Cr through retained earnings, capital restructuring and conversion of OCDs into equity
Total assets fell to INR 1,160.9 Cr in FY26 as the FY25 investment / receivable balances were realized, even as the operating asset base expanded
Cash Flow
| Financial Metric | FY 2023 | FY 2024 | FY 2025 |
|---|---|---|---|
CFO (₹ Cr) Cash generated from core business operations. | +308.6 Cr | +284.4 Cr | +207.7 Cr |
CFI (₹ Cr) Cash used for investments and long-term assets. | -75.9 Cr | -586.1 Cr | +243.1 Cr |
CFF (₹ Cr) Cash flow related to funding and borrowings. | +267 Cr | -172.8 Cr | -327.5 Cr |
Working Capital
| Efficiency Metric | FY 2023 | FY 2024 | FY 2025 |
|---|---|---|---|
Debtor Days Average number of days taken to collect customer payments. | - | - | - |
Creditor Days Average time taken to pay suppliers and vendors. | - | - | - |
Inventory Days Average number of days inventory remains unsold. | - | - | - |
CCC (Cash Conversion Cycle) (Debtor Days + Inventory Days - Creditor Days) | - | - | - |
Financial Ratios
Measures the company’s leverage relative to shareholder equity.
OBSERVATIONS & INSIGHTS
ROE fell to 29.4% as the equity base expanded sharply through retained earnings, capital changes and debenture conversion
ROCE remained strong at 32.7% despite a larger fixed / leased asset base and continued operating investment
Debt / Equity reduced to near zero after debenture redemption / conversion and repayment of funded borrowings
Interest Coverage Ratio recovered to 8.3x as finance cost fell sharply in FY26; FY25 coverage was compressed by the debenture-related interest spike
Current Ratio recovered to 2.9x as current borrowings and other financial liabilities unwound in FY26
ROA remained around the low-20s as lower closing assets offset the decline in PAT
Industry Overview
Industry Drivers
Rising Card Issuance, Banking Penetration and a Low Per-Capita Base
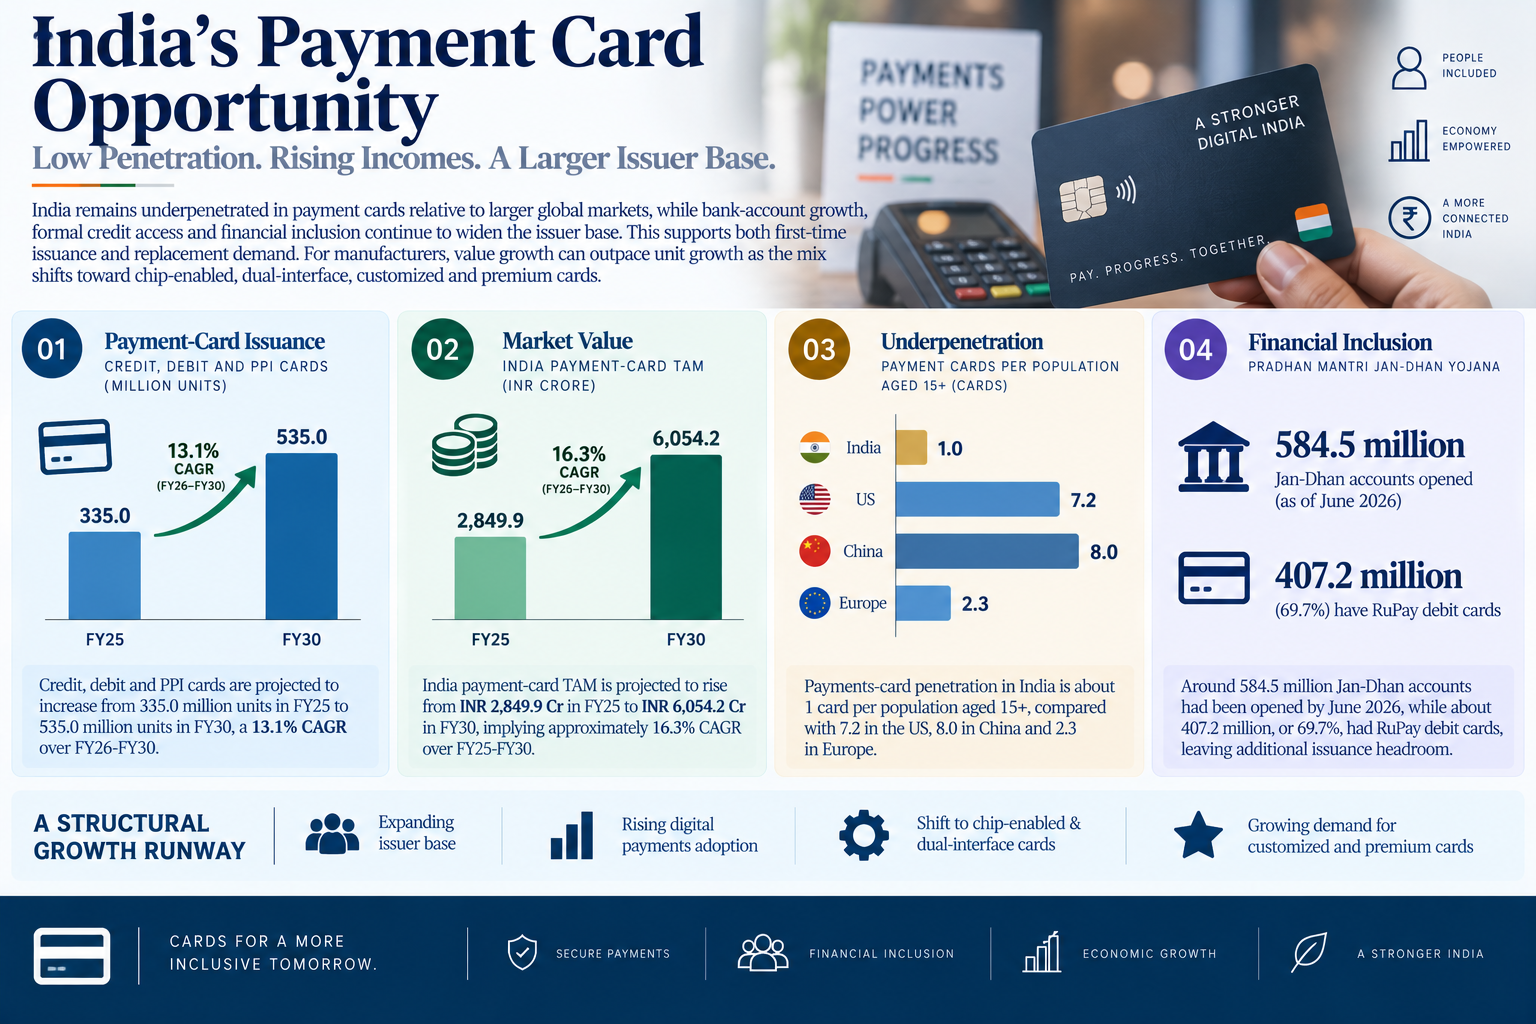
India remains underpenetrated in payment cards relative to larger global markets, while bank-account growth, formal credit access and financial inclusion continue to widen the issuer base. This supports both first-time issuance and replacement demand. For manufacturers, value growth can outpace unit growth as the mix shifts toward chip-enabled, dual-interface, customized and premium cards.
The key drivers are:
Payment-card issuance: Credit, debit and PPI cards are projected to increase from 335.0 million units in FY25 to 535.0 million in FY30, a 13.1% CAGR over FY26-FY30
Market value: India payment-card TAM is projected to rise from INR 2,849.9 Cr in FY25 to INR 6,054.2 Cr in FY30, implying approximately 16.3% CAGR over FY25-FY30
Underpenetration: Payments-card penetration in India is about 1 card per population aged 15+, compared with 7.2 in the US, 8.0 in China and 2.3 in Europe
Financial inclusion: Around 584.5 million Jan-Dhan accounts had been opened by June 2026, while about 407.2 million, or 69.7%, had RuPay debit cards, leaving additional issuance headroom
Premiumization, Credit-Card Growth and Higher-Value Physical-Card Use Cases
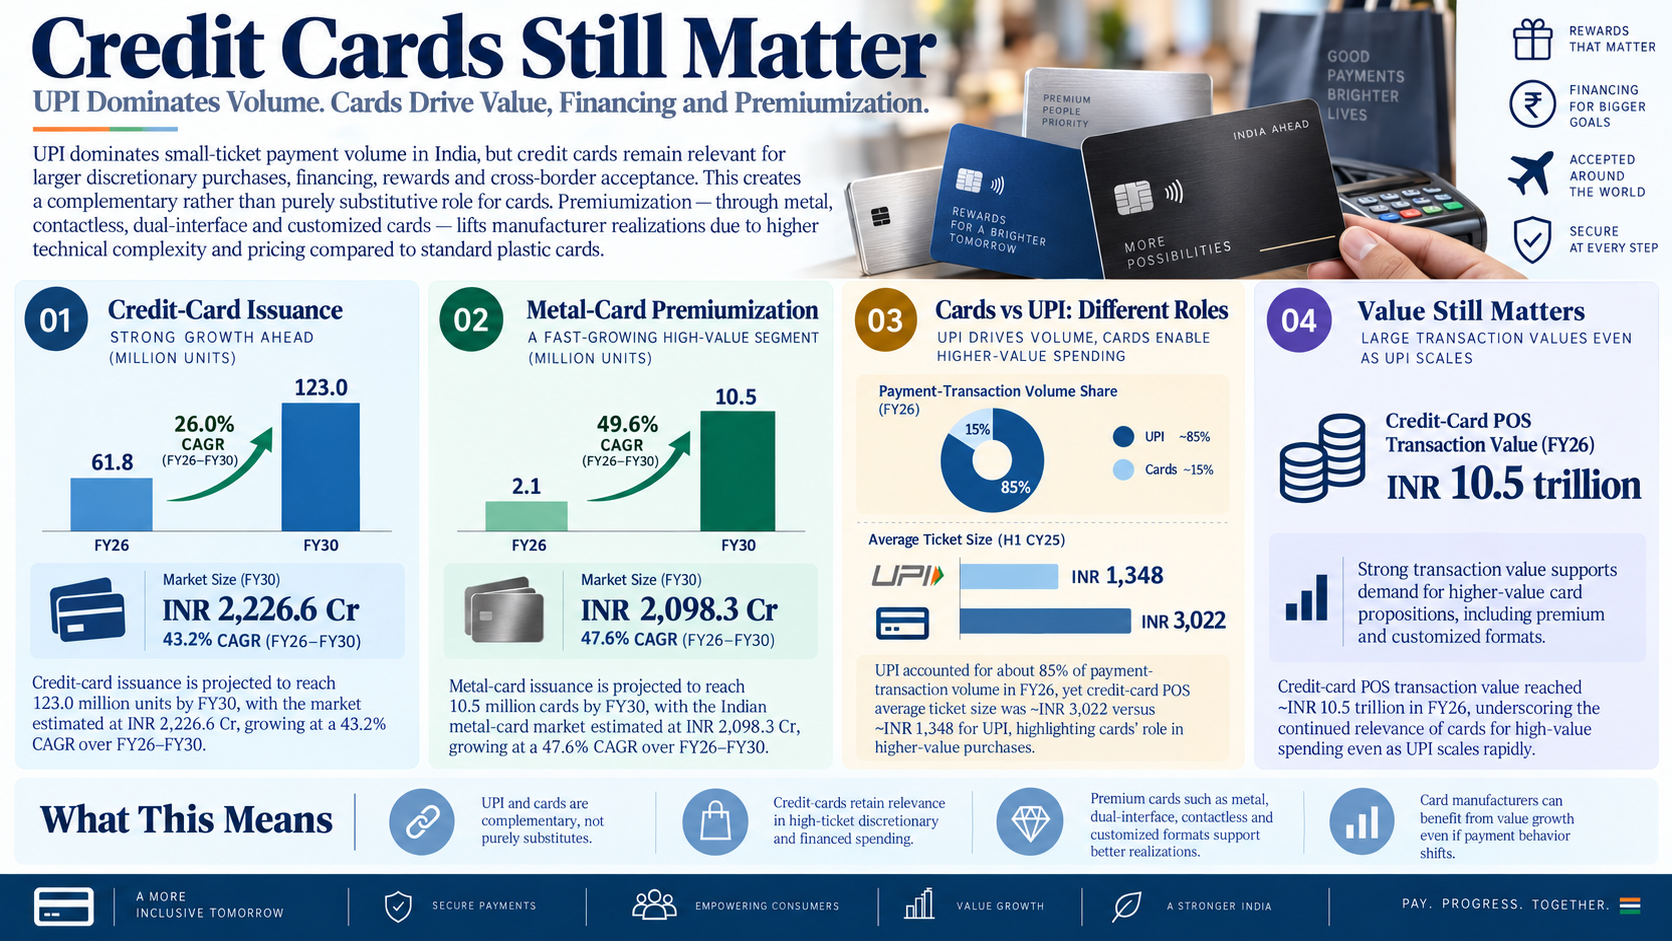
UPI dominates small-ticket payment volume, but credit cards remain relevant for larger discretionary purchases, financing, rewards and cross-border acceptance. This creates a complementary rather than purely substitutive role for cards. Premiumization further lifts manufacturer realizations because metal, contactless, dual-interface and customized cards carry greater technical complexity and pricing than standard plastic cards.
The key drivers are:
Credit-card issuance is projected to reach 123.0 million units by FY30; the corresponding market is projected at INR 2,226.6 Cr, with FY26-FY30 market CAGR of 43.2%
Metal-card issuance is projected to reach 10.5 million cards by FY30 and the Indian metal-card market INR 2,098.3 Cr, with FY26-FY30 market CAGR of 47.6%
UPI accounted for about 85% of payment-transaction volume in FY26, yet H1 CY25 credit-card POS average ticket size was about INR 3,022 versus INR 1,348 for UPI
Credit-card POS transaction value reached approximately INR 10.5 trillion in FY26, supporting demand for higher-value card propositions even as UPI scales
Government Identity, Mobility and Secure-Credential Digitization
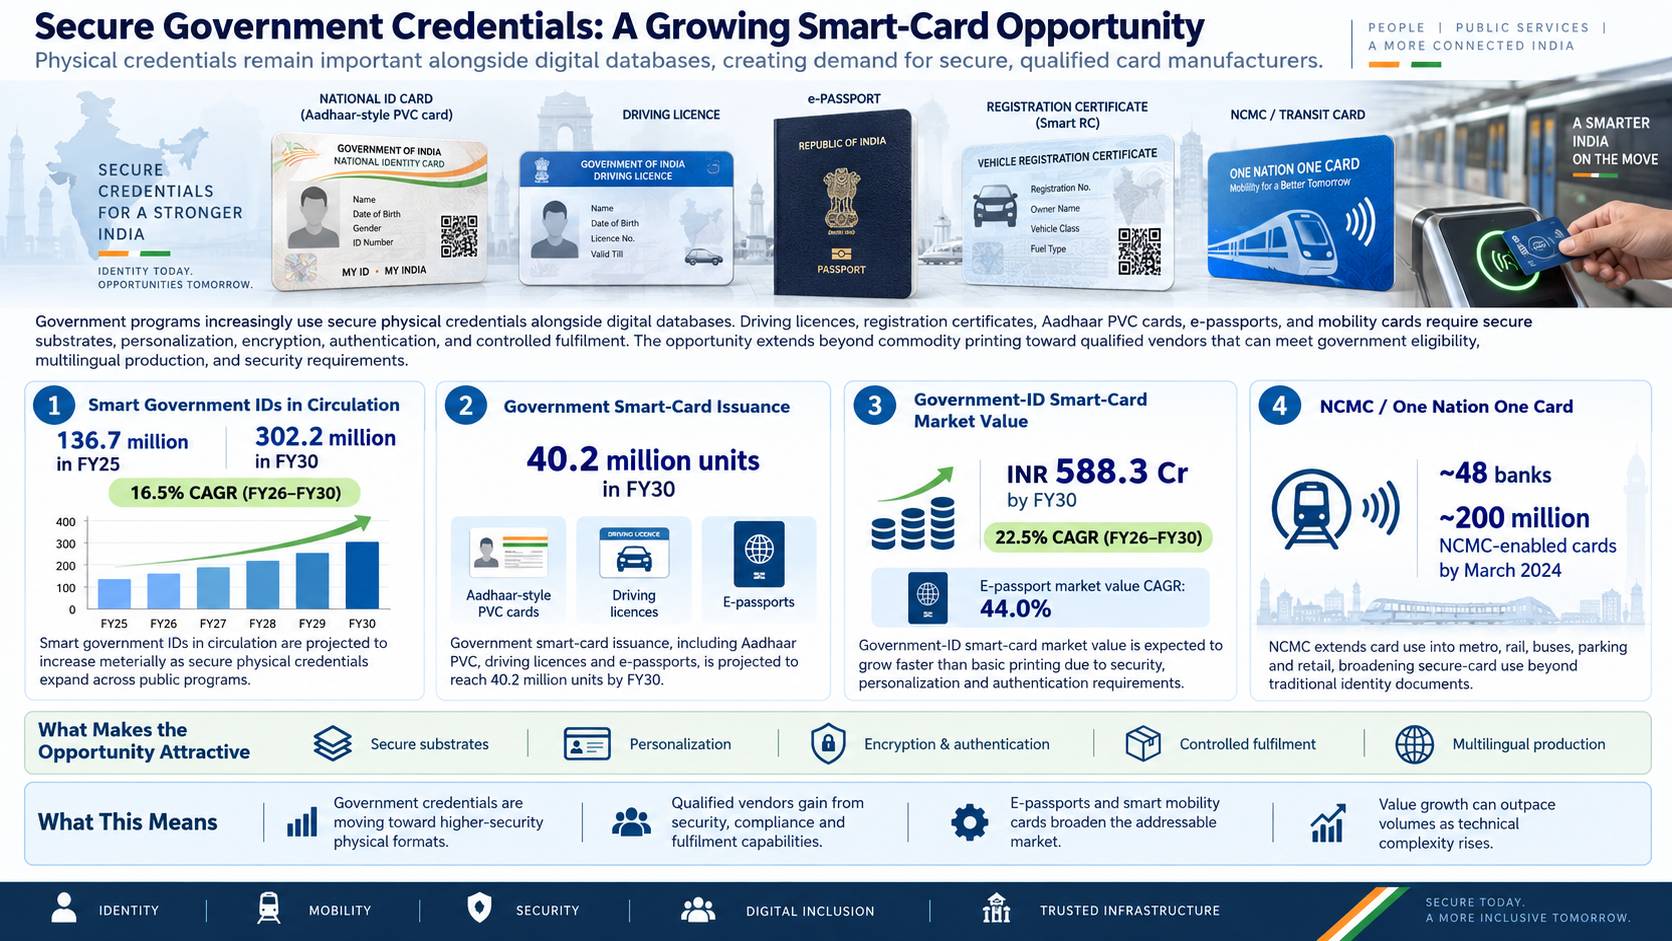
Government programs increasingly use secure physical credentials alongside digital databases. Driving licences, registration certificates, Aadhaar PVC cards, e-passports and mobility cards require secure substrates, personalization, encryption, authentication and controlled fulfilment. The opportunity therefore extends beyond commodity printing toward qualified vendors that can meet government eligibility, multilingual production and security requirements.
The key drivers are:
Smart government IDs in circulation are projected to increase from 136.7 million in FY25 to 302.2 million in FY30, with a 16.5% CAGR over FY26-FY30
Government smart-card issuance, including Aadhaar, driving licences and e-passports, is projected to reach 40.2 million units in FY30
Government-ID smart-card market value is projected to reach INR 588.3 Cr by FY30, growing at 22.5% CAGR over FY26-FY30; e-passport market value alone is projected to grow at 44.0%
NCMC / One Nation One Card extends card use into metro, rail, buses, parking and retail; around 48 banks had issued approximately 200 million NCMC-enabled cards by March 2024
Risks in the Industry
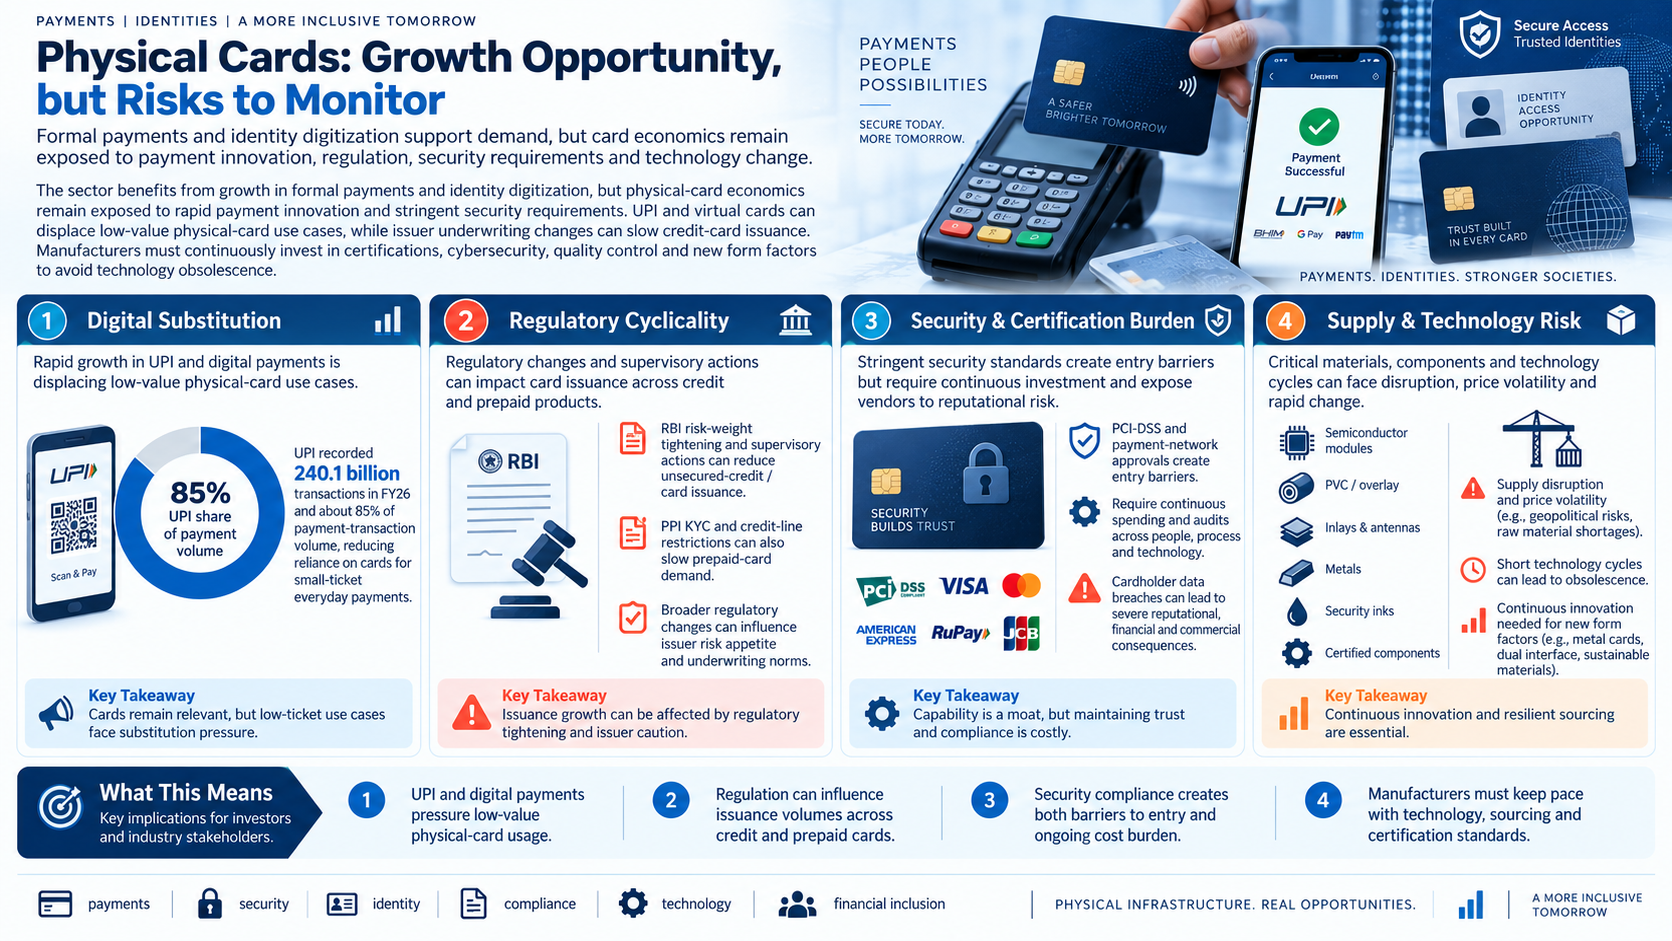
The sector benefits from growth in formal payments and identity digitization, but physical-card economics remain exposed to rapid payment innovation and stringent security requirements. UPI and virtual cards can displace low-value physical-card use cases, while issuer underwriting changes can slow credit-card issuance. At the same time, manufacturers must continuously invest in certifications, cybersecurity, quality control and new form factors to avoid technology obsolescence.
The key risks are:
Digital substitution: UPI recorded 240.1 billion transactions in FY26 and about 85% of payment-transaction volume, reducing reliance on cards for small-ticket everyday payments
Regulatory cyclicality: RBI risk-weight tightening and supervisory actions can reduce unsecured-credit / card issuance; PPI KYC and credit-line restrictions can also slow prepaid-card demand
Security / certification burden: PCI-DSS and payment-network approvals create entry barriers but require continuous spending and expose vendors to severe reputational risk if cardholder data is compromised
Supply / technology risk: Semiconductor modules, PVC / overlay, inlays, metals, security inks and certified components can face supply disruption, price volatility and short technology cycles
Government Policy Support
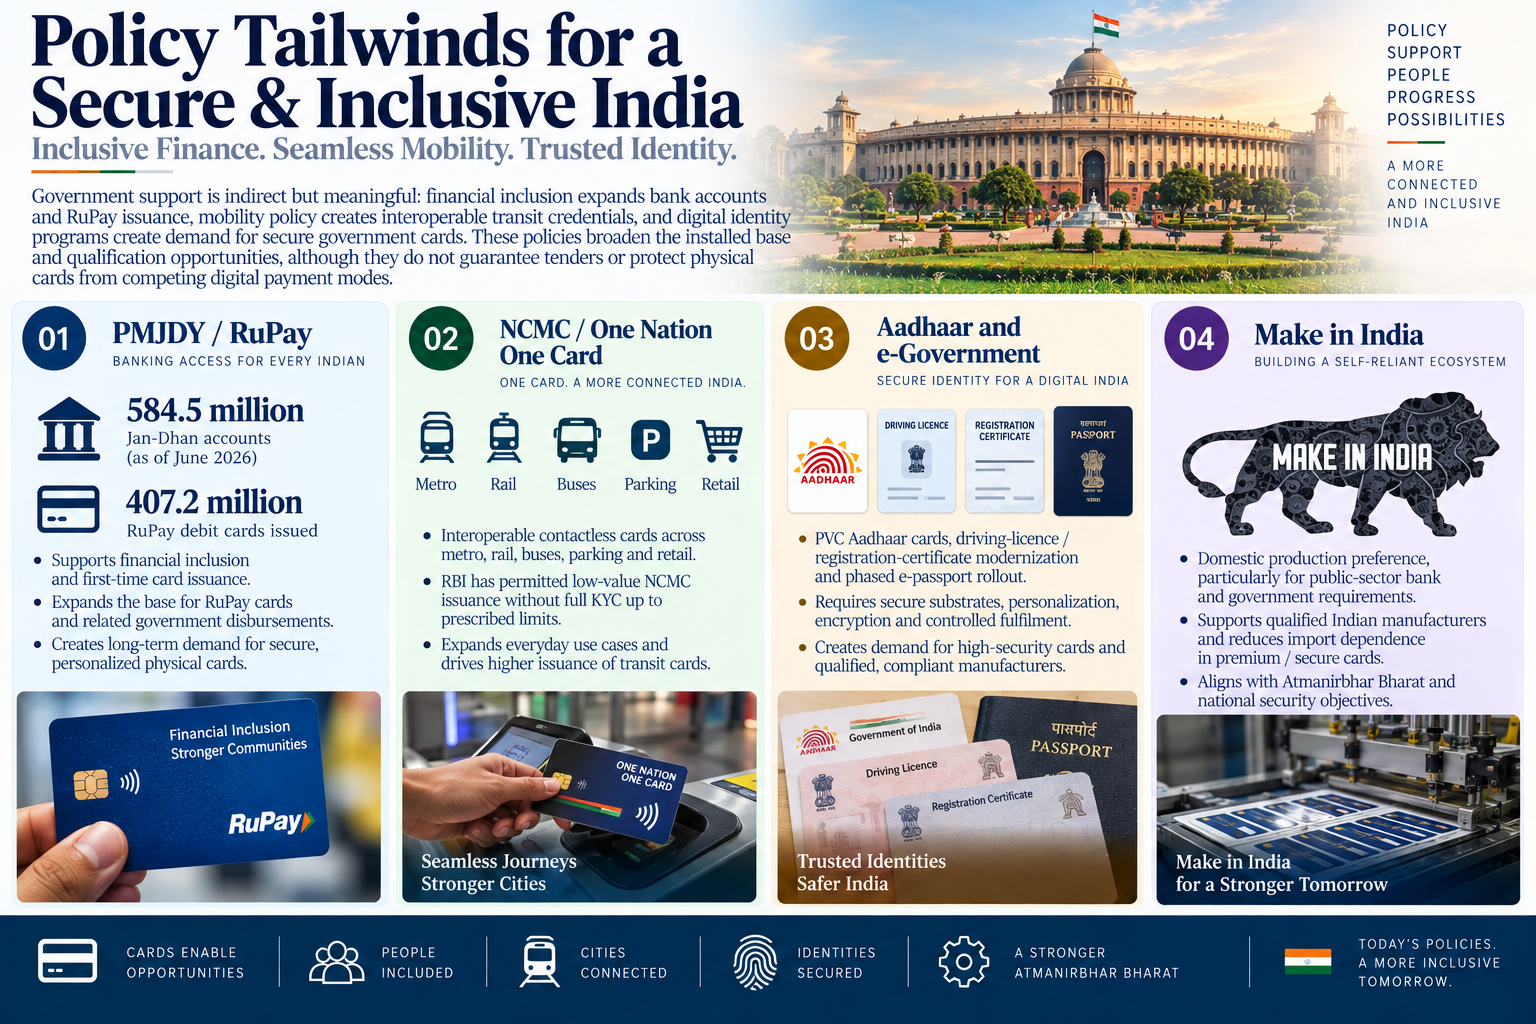
Government support is indirect but meaningful: financial inclusion expands bank accounts and RuPay issuance, mobility policy creates interoperable transit credentials, and digital identity programs create demand for secure government cards. These policies broaden the installed base and qualification opportunities, although they do not guarantee tenders or protect physical cards from competing digital payment modes.
The key policies are:
PMJDY / RuPay: Approximately 584.5 million Jan-Dhan accounts existed by June 2026 and about 407.2 million RuPay debit cards had been issued, supporting continued financial-inclusion issuance
NCMC / One Nation One Card: Interoperable contactless cards across metro, rail, buses, parking and retail expand transit use cases; RBI has permitted low-value NCMC issuance without full KYC up to prescribed limits
Aadhaar and e-government: PVC Aadhaar, driving-licence / registration-certificate modernization and phased e-passport rollout expand secure identity-card demand
Make in India: domestic production preference, particularly for public-sector bank and government requirements, can support qualified Indian manufacturers and reduce import dependence in premium / secure cards
Fundraise/Future Plans
Shareholding
Pre-issue shareholding
Promoter Holding 0.0%
Post-Issue Shareholding
Promoter Holding 0.0%
Category
Pre-Issue%Post-Issue%
Promoters
Manipal Technologies Limited
62.6%53.9%
Total Promoter Holding
62.6%53.9%
Additional Shareholders
0.0%0.0%
Total Additional Holding
0.0%0.0%
Total Shareholding
62.6%53.9%
- Overview
- Business
- Financial Highlights
- Industry Overview
- Fundraise/Future Plans
- Documentation
Get the Preqt App and keep in touch around the clock!
 Monitor your investments in real-time.
- Receive tailored deal suggestions.
- Get real-time updates and alerts.
