


Molbio Diagnostics
Precision at Point-of-CareDiagnostics Without Boundaries
IPO Summary (PrEqt)
IPO Review Rating
Buy
MaiboardTransforming Healthcare Through Accessible Point-of-Care Molecular Diagnostics
Molbio Diagnostics is a stronger business than its 74.2 score may initially suggest, but it carries unusually high concentration risk and a demanding valuation. The biggest issue is concentration, not growth. A single customer contributed 56.5% of FY26 finished-goods revenue, top ten customers contributed 83.3%, public health/government agencies contribute the vast majority of sales, and TB test kits alone generated 70.2% of finished-goods revenue. FY26 cash conversion also weakened sharply despite strong accounting earnings.
PARAMETER
WEIGHT
SCORE
KEY FACTORS
Financial Performance
40.0%
4.0/5
The Company had a 31.5% revenue CAGR, 22.6% EBITDA margin and moderate leverage are attractive, but the score is restrained by very high customer concentration and the sharp FY26 deterioration in operating cash conversion.
Show more
Detailed Analysis
Revenue increased from ₹836.6 Cr in FY24 to ₹1,445.7 Cr in FY26, a 31.5% CAGR.
FY26 EBITDA was ₹328.2 Cr, with margin of 22.6%
FY26 PAT was ₹164.1 Cr, with PAT margin of 11.3%
Total borrowings/equity stood at 0.32x as of FY26
FY26 ROE was 15.6%, compared with 16.2% in FY25
OCF was positive at ₹287.1 Cr in FY25 and ₹50.4 Cr in FY26
The largest customer contributed 56.5% of FY26 finished-goods revenue; top 10 contributed 83.3%
Industry
15.0%
3.0/5
India's overall molecular-diagnostics segment to grow at 12.0% CAGR through FY31. The subsegment most relevant to Truenat is considerably faster: India's molecular point-of-care infectious-disease testing market is projected to rise from ₹6,160 Cr in FY26 to ₹15,210 Cr in FY31, a 19.8% CAGR.
Show more
Detailed Analysis
India's molecular diagnostics segment is forecast to grow at 12.0% CAGR during FY26–FY31
Molecular diagnostics adoption is expanding rapidly, particularly point-of-care testing
IVD products are regulated by CDSCO under the Medical Devices Rules, 2017, with licensing and quality requirements
Management
15.0%
4.0/5
Promoter experience is exceptionally strong. Sriram Natarajan has 35 years in diagnostic-device development, manufacturing and marketing and earlier co-founded Tulip Diagnostics; Dr. Chandrasekhar Nair has 34 years of translational R&D experience
Show more
Detailed Analysis
CEO Sriram Natarajan has 35 years of diagnostic-industry experience; CTO Dr. Chandrasekhar Nair has 34 years
Board has 6 directors, of whom 3 are independent, or exactly 50%
No promoter shares are pledged, but material tax proceedings exist at Company and promoter level
Valuation
20.0%
3.0/5
Valuation is reasonable relative to P/E peers but not outright inexpensive. The P/E discount looks attractive at first glance, but EV/EBITDA is broadly in line with peers, P/B is almost 8x, and nearly 79% of the IPO is OFS.
Show more
Detailed Analysis
At INR 807, Molbio is priced at 54.6x FY26 earnings versus RHP peer average of 64.9x, a 15.8% discount
Molbio is approximately 28.6x EV/EBITDA, versus an indicative peer average around 29.8x
INR 807 represents approximately 7.9x FY26 book value
FY26 RoNW is 14.5%; weighted three-year RoNW is 14.5%
Merchant Banker Track Record
10.0%
5.0/5
This is a clear strength of the IPO. The consortium is strong, and the recent IPO sample has delivered both strong subscription and positive listing outcomes.
Show more
Detailed Analysis
Five-IPO average is approximately +22.5%
Average subscription is approximately 59.6x
5/5 selected issues listed positively
5/5 selected issues listed positively
TOTAL
100%
3.8/5
Weighted Composite Score
Issue Price
₹768.0 to ₹807.0
As of 29 Aug 2026
GMP
₹156.0
As of 29 Aug 2026
Estimated Gain / Loss
+19.3%
Lot Size
18.0 Shares
Grey Market Premium (GMPs) are shared for knowledge purpose only. PrEqt doesn’t promote or execute the trades.
| Issue size | |
|---|---|
| Overall | ₹940.0 Cr |
| Fresh Issue | ₹200.0 Cr |
| Offer for Sale | ₹740.0 Cr |
Minimum Investment
₹14,526.0 / 324 shares

Merchant Banker
Kotak Mahindra Capital Co.Ltd.
IPO Document
RHP / Anchor Document
Offer Start Date
10th Aug 2026
Offer End Date
12th Aug 2026
Valuation
₹9,299.9 Cr
Revenue (FY'26)
₹1,455.2 Cr
PAT (FY'26)
₹164.1 Cr
Issue Size
₹940.0 Cr
Face Value
₹ 1.0Offer Price
₹ 807.0Lot Size
18.0 sharesSale Type
Fresh capital cum OFSPAT (FY'26)
₹ 164.1 CrPAT Margin (FY'26)
11.3 %EBITDA (FY'26)
₹ 328.2 CrCAGR Growth 2Y
31.6 %ROE (FY'26)
15.6 %ROCE (FY'26)
17.6 %Price to Book Value
7.9xDebt/Equity
0.3xCompany Website
www.molbiodiagnostics.comExplore new deals
Overview
Fund Allocation
Total: ₹0 CrSource:Company DRHP
Timeline
IPO Open Date
To Be Announced
IPO Close Date
To Be Announced
Tentative Allotment
To Be Announced
Initiation of Refunds
To Be Announced
Credit of Shares to Demat
To Be Announced
Tentative Listing Date
To Be Announced
Business
Business Model
Geographical Presence
Sales Channel
Financial Highlights
Income Statement
Revenue growth with EBITDA and PAT margins
| Financial Metric | FY 2024 | FY 2025 | FY 2026 |
|---|---|---|---|
| Revenue (₹ Cr) | 840.7 | 1,027.9 | 1,455.2 |
| Growth (%) | - | 22.0% | 41.7% |
| EBITDA (₹ Cr) | 185.1 | 256.6 | 328.2 |
| EBITDA Margin (%) | 22.0% | 25.0% | 22.6% |
| PAT (₹ Cr) | 83.5 | 138.6 | 164.1 |
| PAT Margin (%) | 9.9% | 13.5% | 11.3% |
OBSERVATIONS & INSIGHTS
Revenue increased 22.0% in FY25 and 41.7% in FY26. FY26 growth was driven principally by test-kit revenue increasing from INR 731.0 Cr to INR 1,034.8 Cr, while Truenat device revenue was broadly unchanged near INR 203.0 Cr
EBITDA increased from INR 185.1 Cr in FY24 to INR 328.2 Cr in FY26, but margin moderated from 25.0% in FY25 to 22.6% in FY26 as employee costs, sales commissions, depreciation and other expansion-related expenses rose
PAT increased from INR 83.5 Cr in FY24 to INR 164.1 Cr in FY26. FY26 PAT growth lagged revenue growth because finance cost rose 89.5% and D&A rose 42.8%, including effects from the OptraScan acquisition and expanded borrowing.
Balance Sheet
| Financial Metric | FY 2024 | FY 2025 | FY 2026 |
|---|---|---|---|
| Net Worth | ₹ 828.8 Cr | ₹ 967.3 Cr | ₹ 1,308.8 Cr |
| Total Assets | ₹ 1,221.1 Cr | ₹ 1,461.6 Cr | ₹ 2,148.4 Cr |
| Total Borrowing | ₹ 174.6 Cr | ₹ 123.2 Cr | ₹ 412.6 Cr |
| Reserves & Surplus | ₹ 826.6 Cr | ₹ 965.0 Cr | ₹ 1,297.5 Cr |
OBSERVATIONS & INSIGHTS
Total assets increased 47.0% in FY26 to INR 2,148.4 Cr, reflecting acquisition-driven goodwill/intangibles, higher cash, receivables and continued plant investment
Total equity increased to INR 1,308.8 Cr from INR 967.3 Cr in FY25; FY26 also included a material increase in non-controlling interest following group changes
Non-current borrowings increased to INR 212.4 Cr and current borrowings to INR 200.2 Cr in FY26, principally reflecting acquisition financing and working-capital needs
Cash Flow
| Financial Metric | FY 2024 | FY 2025 | FY 2026 |
|---|---|---|---|
CFO (₹ Cr) Cash generated from core business operations. | +9.6 Cr | +287.1 Cr | +50.4 Cr |
CFI (₹ Cr) Cash used for investments and long-term assets. | -45 Cr | -122.7 Cr | -93.2 Cr |
CFF (₹ Cr) Cash flow related to funding and borrowings. | -31.6 Cr | -26.1 Cr | +276.1 Cr |
Working Capital
| Efficiency Metric | FY 2023 | FY 2024 | FY 2025 |
|---|---|---|---|
Debtor Days Average number of days taken to collect customer payments. | - | - | - |
Creditor Days Average time taken to pay suppliers and vendors. | - | - | - |
Inventory Days Average number of days inventory remains unsold. | - | - | - |
CCC (Cash Conversion Cycle) (Debtor Days + Inventory Days - Creditor Days) | - | - | - |
Financial Ratios
Measures the company’s leverage relative to shareholder equity.
OBSERVATIONS & INSIGHTS
Total borrowings increased sharply to INR 412.6 Cr in FY26, lifting derived debt/equity to ~0.3x from ~0.1x in FY25. The RHP attributes the higher finance burden largely to the OptraScan acquisition and increased working-capital utilisation
Current ratio remained comfortable at ~2.5x in FY26 and the Group held INR 355.5 Cr of balance-sheet cash, which kept net debt modest despite higher gross borrowings
Interest coverage declined to ~7.9x in FY26 from ~12.0x in FY25 as finance cost nearly doubled; coverage remains positive but the direction reflects acquisition and working-capital financing
ROCE and ROE improved in FY24 and in FY25 and then moderated to 17.6% and 15.6% respectively in FY26 as capital employed and borrowings expanded faster than operating profit
Industry Overview
Industry Drivers
Industry Tailwind: Rapid Molecular-Diagnostics and Point-of-Care Adoption
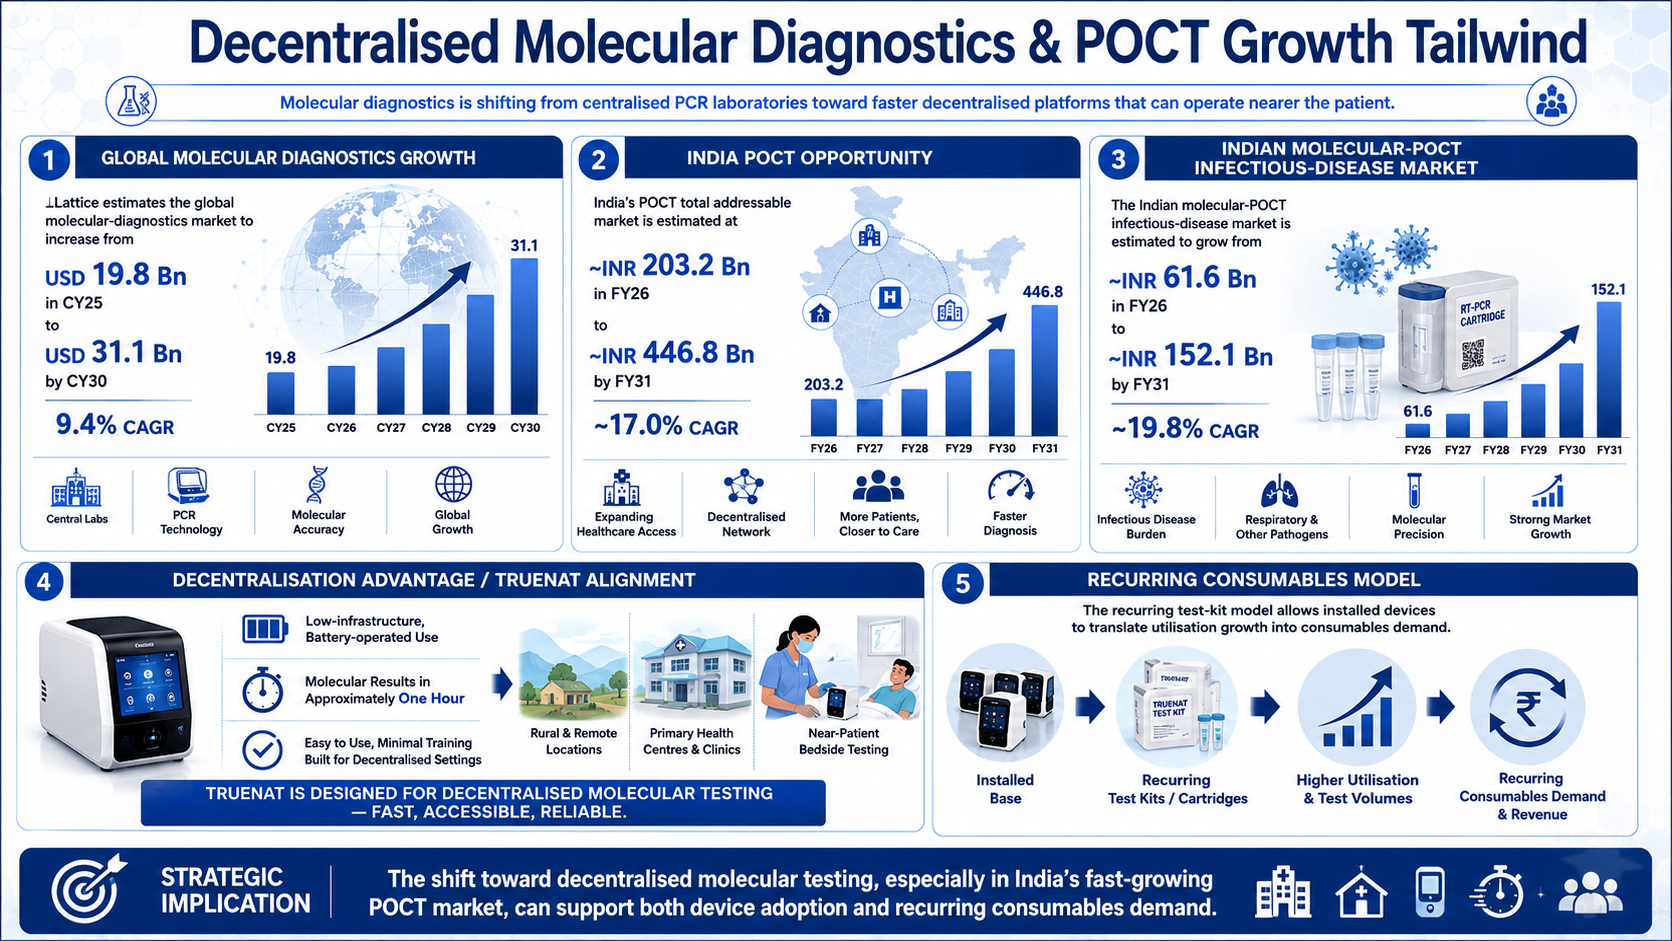
Molecular diagnostics is shifting from centralised PCR laboratories toward faster decentralised platforms that can operate nearer the patient. 1Lattice estimates the global molecular-diagnostics market to increase from USD 19.8 Bn in CY25 to USD 31.1 Bn by CY30 at 9.4% CAGR, while global POCT is expected to grow faster as healthcare systems prioritise speed, decentralisation and access
The key tailwinds are:
India’s POCT total addressable market is estimated by 1Lattice at approximately INR 203.2 Bn in FY26 and INR 446.8 Bn by FY31, implying ~17.0% CAGR
The Indian molecular-POCT infectious-disease market is estimated to grow from INR 61.6 Bn in FY26 to INR 152.1 Bn by FY31 at ~19.8% CAGR
Truenat is designed for low-infrastructure, battery-operated use and returns molecular results in approximately one hour, aligning directly with the decentralisation trend
The recurring test-kit model allows installed devices to translate utilisation growth into consumables demand.
TB Burden, Under-Diagnosis and the Shift from Smear Testing to Molecular Testing
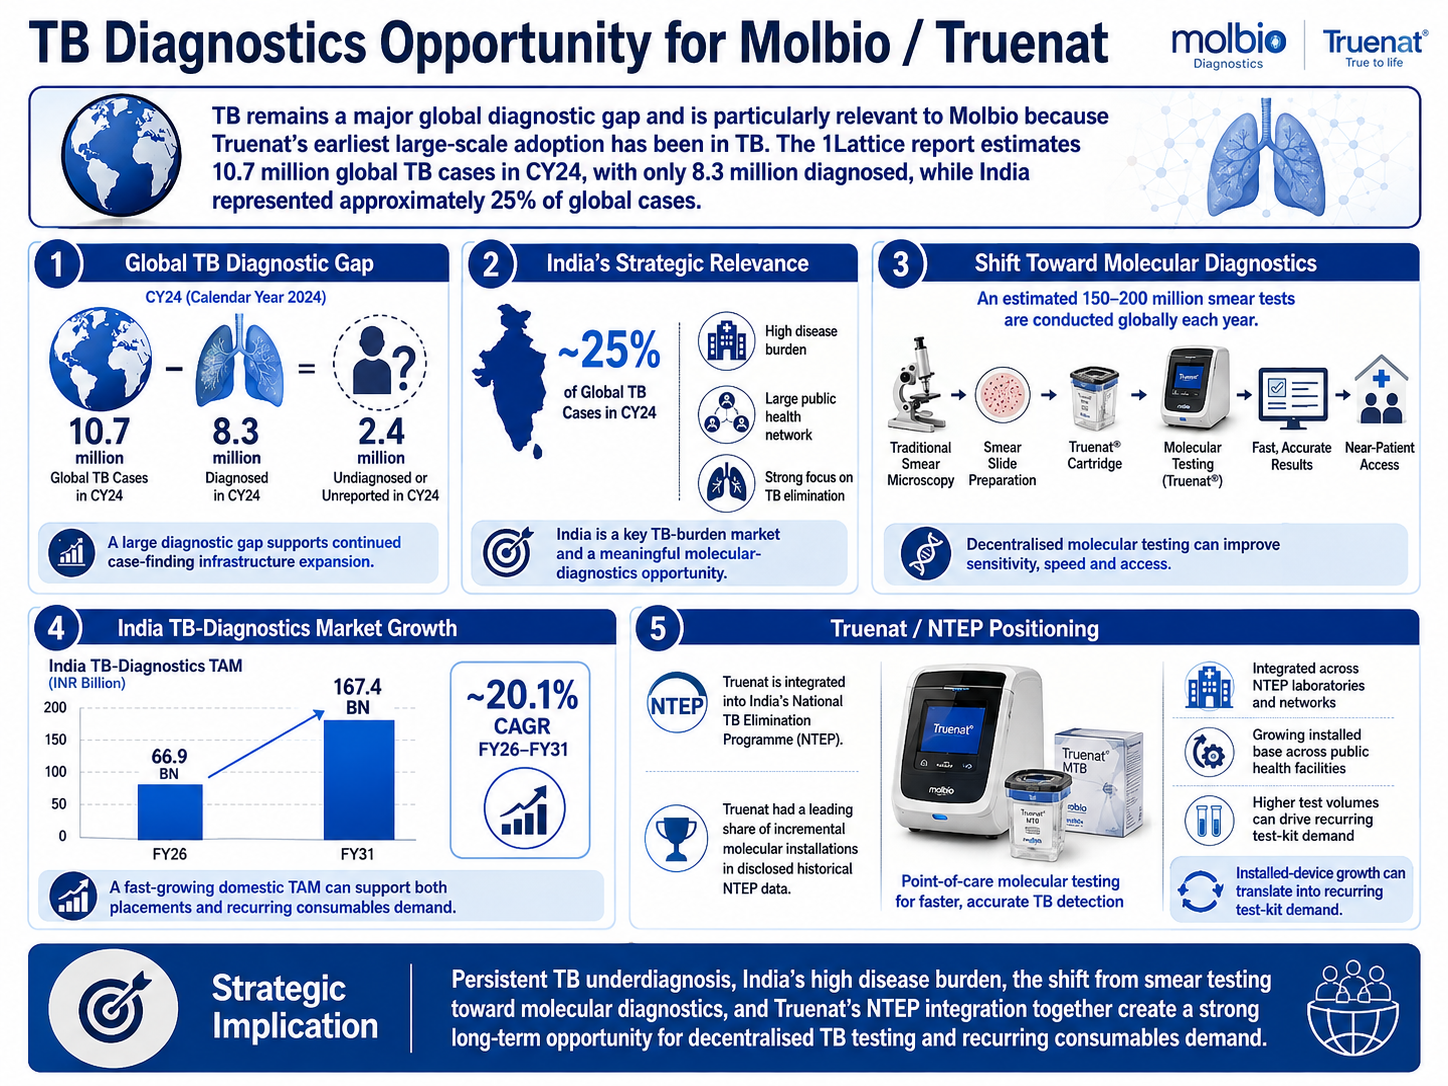
TB remains a major global diagnostic gap and is particularly relevant to Molbio because Truenat’s earliest large-scale adoption has been in TB. The 1Lattice report estimates 10.7 million global TB cases in CY24, with only 8.3 million diagnosed, while India represented approximately 25% of global cases.
The key details are:
Around 2.4 million global TB cases were undiagnosed or unreported in CY24, supporting continued expansion of case-finding infrastructure
An estimated 150-200 million smear tests are conducted globally each year and may progressively shift toward molecular diagnostics
India’s TB-diagnostics TAM is estimated to grow from INR 66.9 Bn in FY26 to INR 167.4 Bn by FY31 at ~20.1% CAGR
Truenat has been integrated into India’s NTEP and had a leading share of incremental molecular installations in disclosed historical NTEP data.
Expansion of Decentralised Public-Health Infrastructure and Formalisation
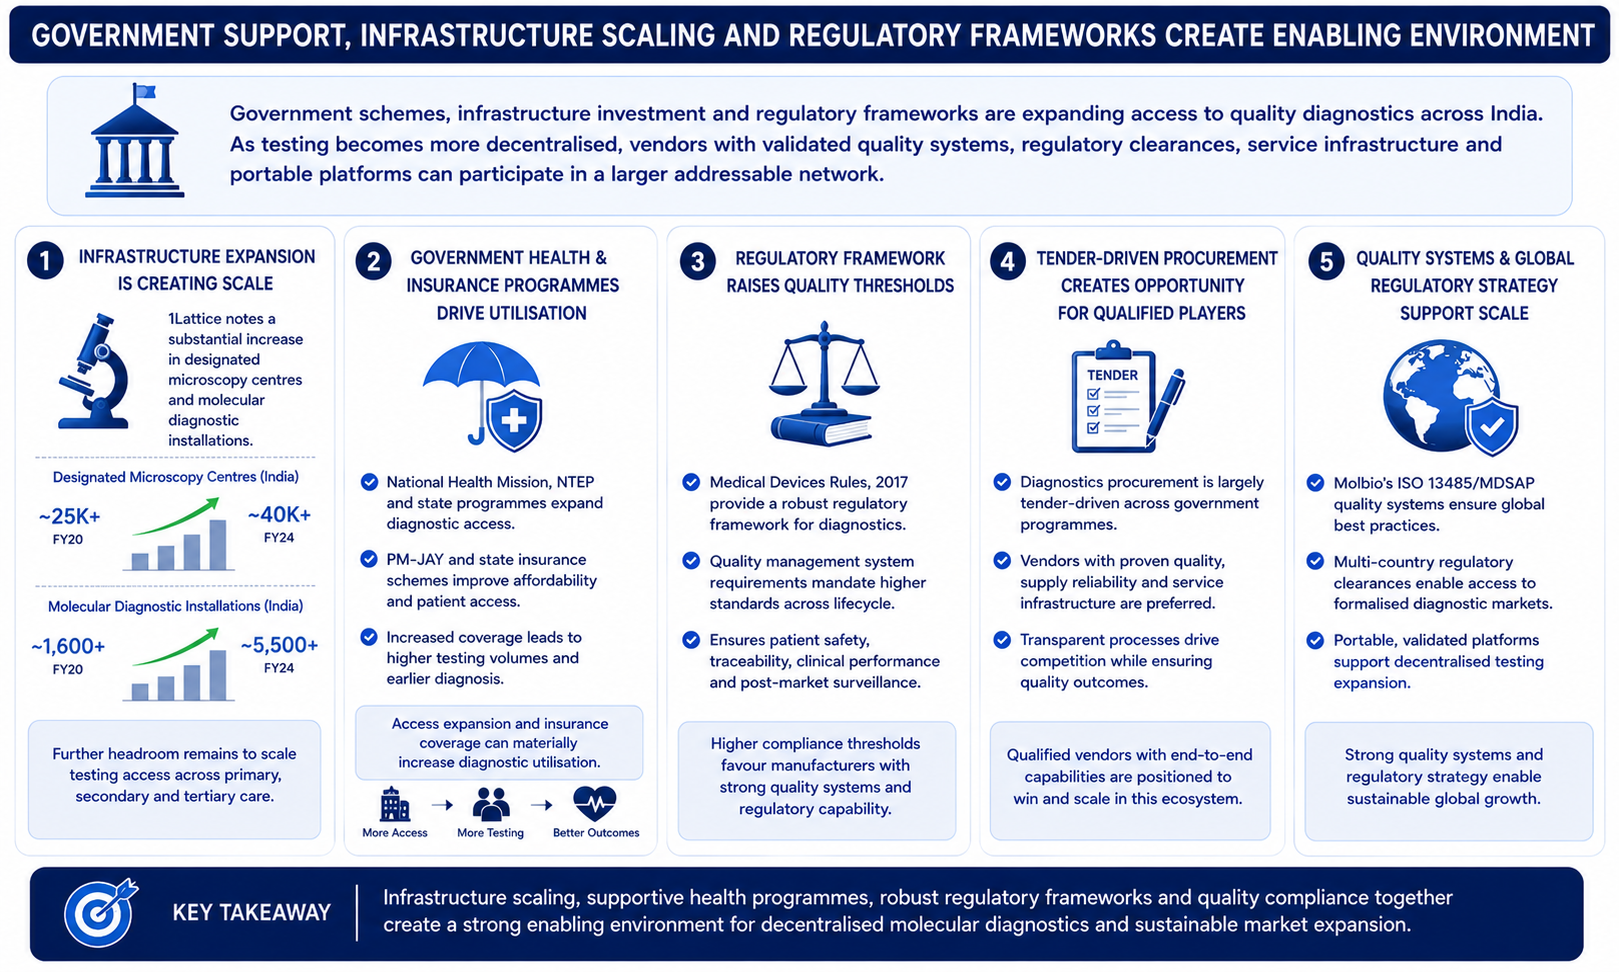
India continues to build testing capacity through TB programmes, integrated public-health laboratories and broader health-infrastructure schemes. As testing becomes more decentralised, vendors with validated quality systems, regulatory clearances, service infrastructure and portable platforms can participate in a larger addressable network.
The key details are:
1Lattice notes a substantial increase in designated microscopy centres and molecular diagnostic installations, with further headroom to scale testing access
Government health infrastructure and insurance programmes can increase patient access and diagnostic utilisation, although procurement remains tender-driven
The Medical Devices Rules, 2017 and quality-system requirements raise formal compliance thresholds and favour manufacturers able to obtain and maintain approvals
Molbio’s ISO 13485/MDSAP quality systems and multi-country regulatory strategy support expansion into more formalised diagnostic markets.
Risks in the Industry
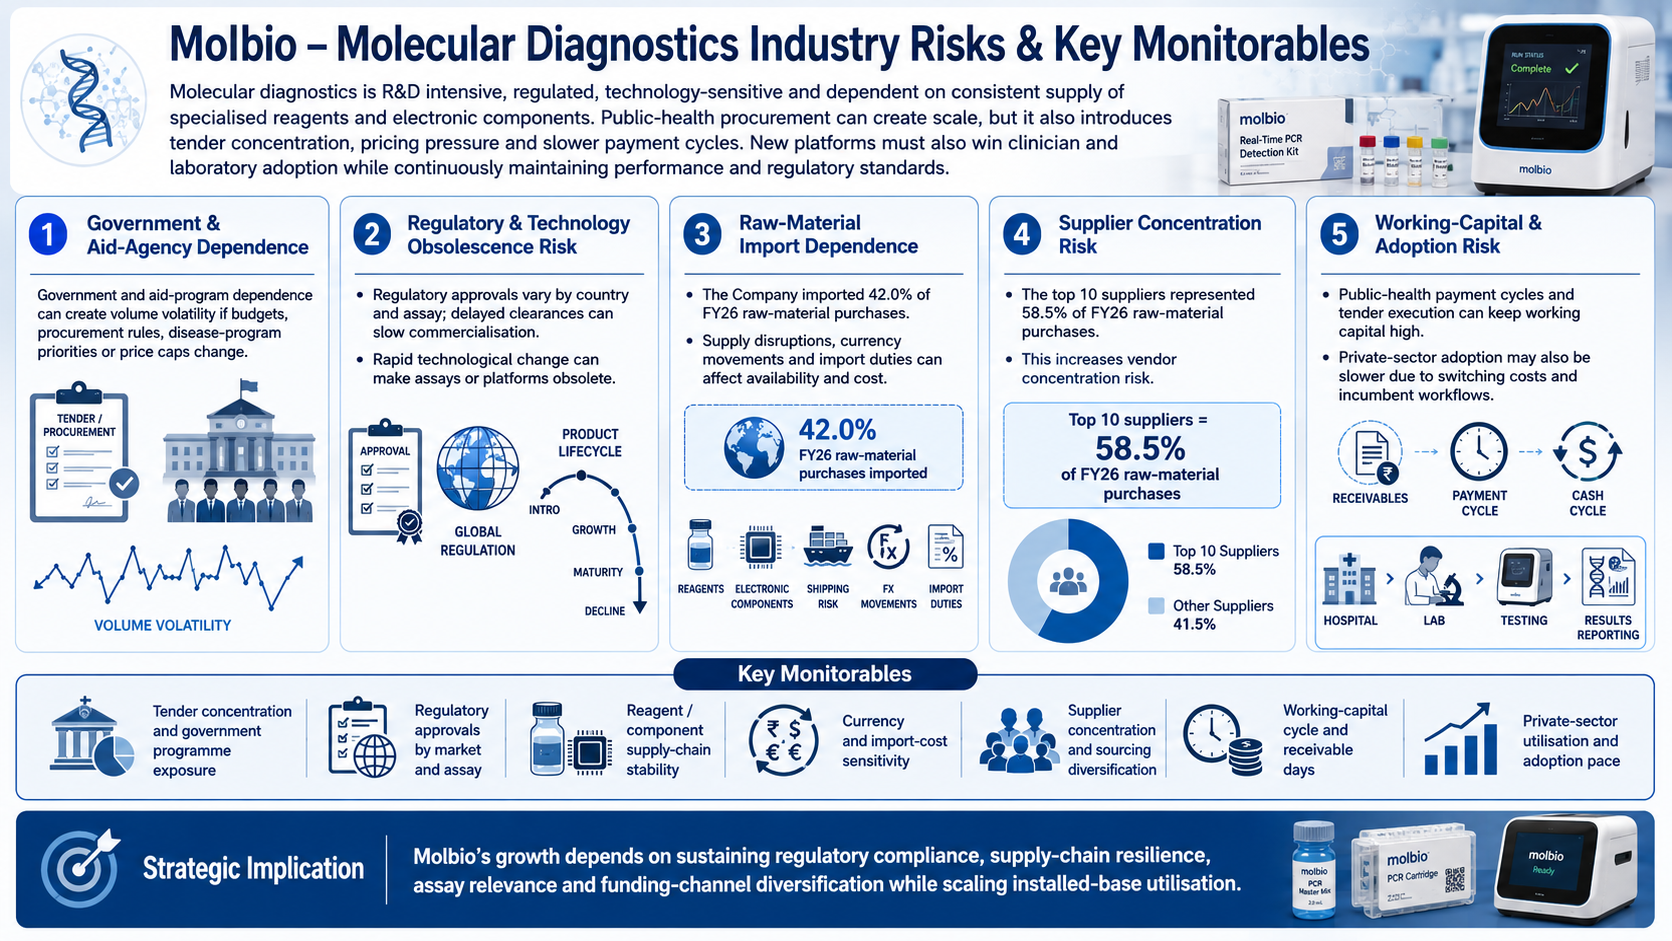
Molecular diagnostics is R&D intensive, regulated, technology-sensitive and dependent on consistent supply of specialised reagents and electronic components. Public-health procurement can create scale, but also introduces tender concentration, pricing pressure and slower payment cycles. New platforms must also win clinician and laboratory adoption while continuously maintaining performance and regulatory standards.
The key risks are:
Government and aid-program dependence can create volume volatility if budgets, procurement rules, disease-program priorities or price caps change
Regulatory approvals vary by country and assay; delayed clearances can slow commercialisation, while rapid technological change can make assays or platforms obsolete
Molbio imported 42.0% of FY26 raw-material purchases; supply disruptions, currency moves and import duties can affect availability and cost
The top 10 suppliers represented 58.5% of FY26 raw-material purchases, increasing vendor concentration risk
Public-health payment cycles and tender execution can keep working capital high; private-sector adoption may also be slower due to switching costs and incumbent workflows.
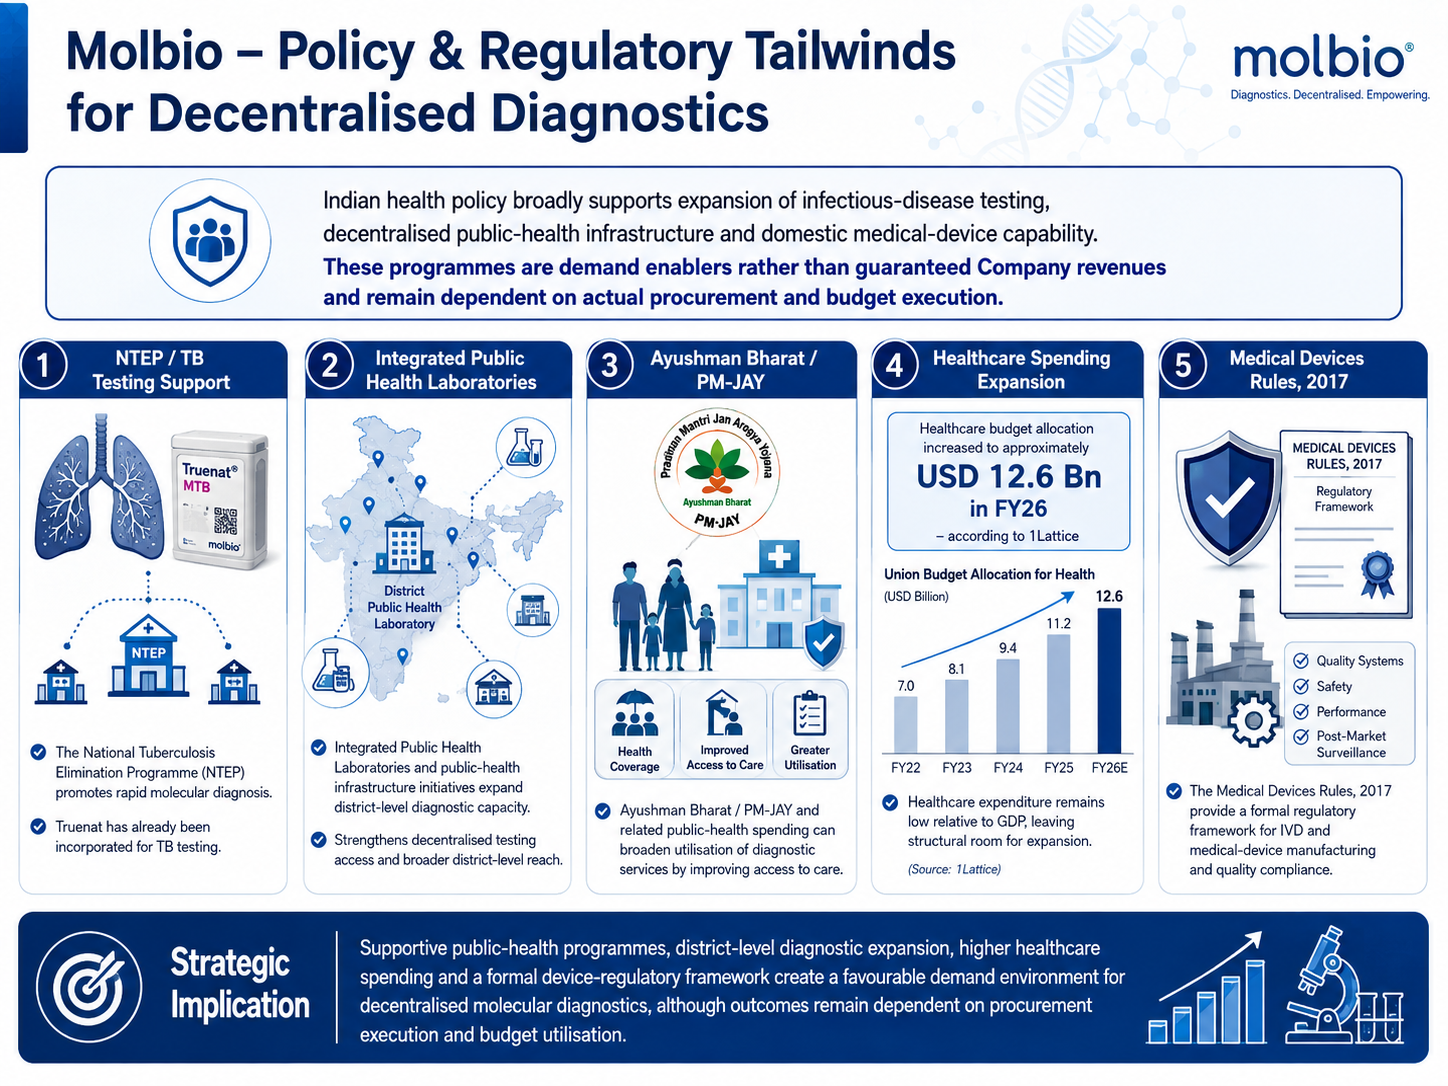
Government Policy Support
Indian health policy broadly supports expansion of infectious-disease testing, decentralised public-health infrastructure and domestic medical-device capability. These programmes are demand enablers rather than guaranteed Company revenues and remain dependent on actual procurement and budget execution
The key policies are:
The National Tuberculosis Elimination Programme promotes rapid molecular diagnosis and has already incorporated Truenat for TB testing
Integrated Public Health Laboratories under public-health infrastructure initiatives expand district-level diagnostic capacity
Ayushman Bharat / PM-JAY and related public-health spending can broaden utilisation of diagnostic services by improving access to care
India’s healthcare budget allocation increased to approximately USD 12.6 Bn in FY26 according to 1Lattice, while healthcare expenditure remains low relative to GDP, leaving structural room for expansion
The Medical Devices Rules, 2017 provide a formal regulatory framework for IVD and medical-device manufacturing and quality compliance.
Fundraise/Future Plans
Shareholding
Pre-issue shareholding
Promoter Holding 0.0%
Post-Issue Shareholding
Promoter Holding 0.0%
Category
Pre-Issue%Post-Issue%
Promoters
Exxora Trading LLP
41.2%38.8%
India Business Excellence Fund III
12.7%11.5%
V Sciences Investments Pte. Ltd
8.9%8.7%
Gopalkrishna Mangalore Kini
6.7%5.6%
Dr. Chandrasekhar Bhaskaran Nair
5.4%4.2%
Gopalakrishna Sampathgiri
5.4%4.5%
Total Promoter Holding
80.3%73.3%
Additional Shareholders
0.0%0.0%
Total Additional Holding
0.0%0.0%
Total Shareholding
80.3%73.3%
- Overview
- Business
- Financial Highlights
- Industry Overview
- Fundraise/Future Plans
- Documentation
Get the Preqt App and keep in touch around the clock!
 Monitor your investments in real-time.
- Receive tailored deal suggestions.
- Get real-time updates and alerts.
