


NCL BUILDTEK Ltd.
Building Better SpacesMaterials for Modern Living
IPO Review and Rating
Speculative
Overall Recommendation
At 0.4x sales, 0.7x book and approximately 9.9x EV/EBITDA, the shares are not expensive. The Company also has a tangible manufacturing base, diversified building-material portfolio, more than three decades of operating history, manageable 0.4x D/E, 54.9% promoter ownership and exposure to structurally growing markets. The problem is earnings quality and direction. Core PBT has deteriorated from INR 23.6 Cr in FY24 → INR 12.3 Cr in FY25 → INR 1.5 Cr in FY26. EBITDA margin has fallen from 11.6% → 9.4% → 6.2%, operating cash flow has declined to INR 8.9 Cr, DSCR is only 0.7x, ROCE is down to 4.3%, and the Company's largest division—Windows—earned only around a 0.3% segment margin in FY26
PARAMETER
WEIGHT
SCORE
KEY FACTORS
Financial Performance
25.0%
2.0/5
NCL Buildtek has a manageable balance sheet and positive operating cash flow, but the deterioration in margins, DSCR, ROE, ROCE and segment profitability is too significant
Show more
Detailed Analysis
FY26 revenue recovered 6.6%, but FY22-FY26 CAGR is only 1.4%
EBITDA margin declined from 11.6% in FY24 → 9.4% in FY25 → 6.2% in FY26
Final consolidated PAT turned marginally negative in FY26
D/E remains manageable at 0.4x, but DSCR fell sharply to only 0.7x
ROE fell from 18.9% to approximately 0.0%, reflecting the collapse in earnings
CFO remained positive at INR 8.9 Cr, but declined materially from INR 33.8 Cr
Industry
25.0%
3.0/5
NCL operates in several structurally growing categories; the key question is whether it can restore pricing discipline and margins
Show more
Detailed Analysis
Core categories such as uPVC windows, AAC blocks and coatings have attractive medium-term growth prospects
Formalization, urban construction, renovation and energy-efficient building products support organized manufacturers
uPVC and paints are intensely competitive, with pricing pressure already materially affecting NCL
Exposure to PVC, aluminium, steel, cement and construction cycles creates margin volatility
Multiple building-product categories reduce dependence on one end market, though Windows remain >50% of revenue
Management
25.0%
3.2/5
Governance and audit quality are reasonable, promoter ownership is meaningful and the business has long operating history
Show more
Detailed Analysis
Approximately four decades of operating history and experienced promoter management
Independent representation and an independent-majority Audit Committee provide governance oversight
Clean statutory audit and adequate internal controls; minor IEPF filing delays were subsequently regularized
RPT exposure and dividend despite weak FY26 earnings warrant monitoring; IPO deferral appears financially prudent
Valuation Metrics
25.0%
2.8/5
NCL is unquestionably inexpensive on asset and revenue multiples. However, the discount is partly deserved because profitability and ROCE have collapsed and the shares remain unlisted
Show more
Detailed Analysis
Approximately 9.9x is reasonable to inexpensive relative to relevant listed anchors
FY26 earnings are negative, making P/E unusable and eliminating earnings support for valuation
A P/B of 0.7x is compelling, particularly for a business with substantial manufacturing assets
TOTAL
100%
2.8/5
Weighted Composite Score
Per Share Price
₹135.0
As of 25 Oct 2026
Lot Size
35.0 Shares
Minimum Investment
₹4,725.0 / 35 shares
Market Cap. (₹ Cr)
Revenue FY’26
PAT FY’26
P/E Multiple
Face Value
₹ 10.0Lot Size
35.0 sharesPAT FY’26
₹ 0.0 CrP/E Multiple
-3,625.0xCAGR Growth 3Y
1.6 %ROCE (FY’26)
4.3 %Price to Book Value ratio
0.7xDebt/Equity (FY’26)
0.4xMerchant banker appointed
❌ NoCompany Website
nclbuildtek.comDisclaimer: Unlisted shares are unregulated & illiquid. This is NOT investment advice. Please do your own due diligence before investing.
Minimum Investment
₹4,725.0 / 35 sharesShares Lot 35 X 1
Investment amount
₹4,725.0
Overview
Business
Products
Business Model
Geographical Presence
Sales Channel
Financial Highlights
Income Statement
Revenue growth with EBITDA and PAT margins
| Financial Metric | FY 2024 | FY 2025 | FY 2026 |
|---|---|---|---|
| Revenue (₹ Cr) | 435.5 | 404.2 | 431.0 |
| Growth (%) | -3.3% | -7.2% | 6.6% |
| EBITDA (₹ Cr) | 48.8 | 34.8 | 22.7 |
| EBITDA Margin (%) | 11.2% | 8.6% | 5.3% |
| PAT (₹ Cr) | 24.3 | 43.3 | 0.0 |
| PAT Margin (%) | 5.6% | 10.7% | - |
OBSERVATIONS & INSIGHTS
Sales increased 6.6% after two years of contraction, reaching INR 431.0 Cr. The recovery is positive, but FY26 revenue remained slightly below the FY24 level of INR 435.5 Cr
EBITDA fell from INR 48.8 Cr in FY24 to INR 34.8 Cr in FY25 and INR 22.7 Cr in FY26. Margin contracted from 11.2% to 5.3% in two years, consistent with management’s commentary on pricing pressure
A ₹45.7 Cr exceptional item substantially increased FY25 reported PBT and PAT. On a preexceptional basis, operating profitability had already weakened in FY25 before deteriorating further in FY26
The Group earned INR 0.85 Cr before the share of the joint venture, but a JV loss contribution pushed consolidated PAT slightly negative. The amount is small, yet it makes the headline P/E unusable and highlights weak earnings coverage
For the next 12-24 months, a clean improvement would require higher segment margins, interest coverage above 1.0x and stronger operating cash conversion without relying on exceptional gains
Balance Sheet
| Financial Metric | FY 2024 | FY 2025 | FY 2026 |
|---|---|---|---|
| EQUITY & LIABILITIES | ₹ 416.4 Cr | ₹ 463.3 Cr | ₹ 449.2 Cr |
| Net Worth | ₹ 192.6 Cr | ₹ 231.3 Cr | ₹ 227.4 Cr |
| Share Capital | ₹ 11.6 Cr | ₹ 11.6 Cr | ₹ 11.6 Cr |
| Reserves & Surplus | ₹ 181.0 Cr | ₹ 219.7 Cr | ₹ 215.8 Cr |
| Total Liabilities | ₹ 223.8 Cr | ₹ 232.0 Cr | ₹ 221.8 Cr |
| Current Liabilities | ₹ 173.7 Cr | ₹ 186.7 Cr | ₹ 178.4 Cr |
| Borrowings | ₹ 89.6 Cr | ₹ 79.8 Cr | ₹ 74.1 Cr |
| Trade Payables | ₹ 34.1 Cr | ₹ 58.0 Cr | ₹ 54.6 Cr |
| Other Current Liabilities | ₹ 50.0 Cr | ₹ 48.9 Cr | ₹ 49.7 Cr |
| Non-Current Liabilities | ₹ 50.1 Cr | ₹ 45.3 Cr | ₹ 43.4 Cr |
| Borrowings | ₹ 26.4 Cr | ₹ 23.7 Cr | ₹ 24.0 Cr |
| Other Non-Current Liabilities | ₹ 23.7 Cr | ₹ 21.6 Cr | ₹ 19.4 Cr |
| ASSETS | ₹ 416.4 Cr | ₹ 463.4 Cr | ₹ 449.1 Cr |
| Current Assets | ₹ 196.0 Cr | ₹ 245.5 Cr | ₹ 231.4 Cr |
| Trade Receivables | ₹ 87.1 Cr | ₹ 96.0 Cr | ₹ 90.0 Cr |
| Inventory | ₹ 61.4 Cr | ₹ 75.9 Cr | ₹ 88.9 Cr |
| Cash & Cash Equivalents | ₹ 2.7 Cr | ₹ 2.6 Cr | ₹ 1.3 Cr |
| Other Current Assets | ₹ 44.8 Cr | ₹ 71.0 Cr | ₹ 51.2 Cr |
| Non-Current Assets | ₹ 220.4 Cr | ₹ 217.9 Cr | ₹ 217.7 Cr |
| Fixed Assets | ₹ 170.8 Cr | ₹ 194.2 Cr | ₹ 193.2 Cr |
| Other Non-Current Assets | ₹ 49.6 Cr | ₹ 23.7 Cr | ₹ 24.5 Cr |
OBSERVATIONS & INSIGHTS
Shareholders’ wealth was INR 227.4 Cr at FY26, only modestly below INR 231.3 Cr in FY25 and well above FY24. The balance sheet therefore has a meaningful equity buffer relative to the current unlisted market capitalisation
Combined current and non-current borrowings, including current maturities, fell from roughly INR 115.9 Cr in FY24 to INR 98.1 Cr in FY26. This supports the decline in debt/equity
Inventory rose to INR 88.9 Cr in FY26 from INR 75.9 Cr, while current trade receivables declined to INR 90.0 Cr from INR 96.0 Cr. The working-capital mix therefore shifted toward stock rather than customer credit
FY25 carried unusually high bank deposits following investment-sale proceeds. By FY26, some of that liquidity was redeployed into commercial paper and other financial assets while cash and bank deposits reduced
Cash Flow
| Financial Metric | FY 2024 | FY 2025 | FY 2026 |
|---|---|---|---|
CFO (₹ Cr) Cash generated from core business operations. | +40.1 Cr | +33.8 Cr | +8.9 Cr |
CFI (₹ Cr) Cash used for investments and long-term assets. | -15.2 Cr | +41.9 Cr | -28.5 Cr |
CFF (₹ Cr) Cash flow related to funding and borrowings. | -25.8 Cr | -28.6 Cr | -21.5 Cr |
Working Capital
| Efficiency Metric | FY 2023 | FY 2024 | FY 2025 |
|---|---|---|---|
Debtor Days Average number of days taken to collect customer payments. | - | - | - |
Creditor Days Average time taken to pay suppliers and vendors. | - | - | - |
Inventory Days Average number of days inventory remains unsold. | - | - | - |
CCC (Cash Conversion Cycle) (Debtor Days + Inventory Days - Creditor Days) | - | - | - |
Financial Ratios
Measures the company’s leverage relative to shareholder equity.
OBSERVATIONS & INSIGHTS
ROCE fell to 4.3% from 20.7% in FY25 and 15.7% in FY24. The FY25 figure benefited from stronger pre-tax earnings and the investment-exit year, while FY26 reflects much weaker operating profit
The current ratio held at about 1.3x in FY26, above FY24’s 1.1x. This provides a working-capital cushion, although a large portion of current assets is inventory and receivables rather than unrestricted cash
Reported debt/equity improved from 0.6x in FY24 to 0.4x in FY26
Interest coverage fell to roughly 0.8x on an analytical operating basis. This is more concerning than the absolute debt/equity ratio because it shows current operating earnings were not sufficient to cover finance cost
Industry Overview
Industry Drivers
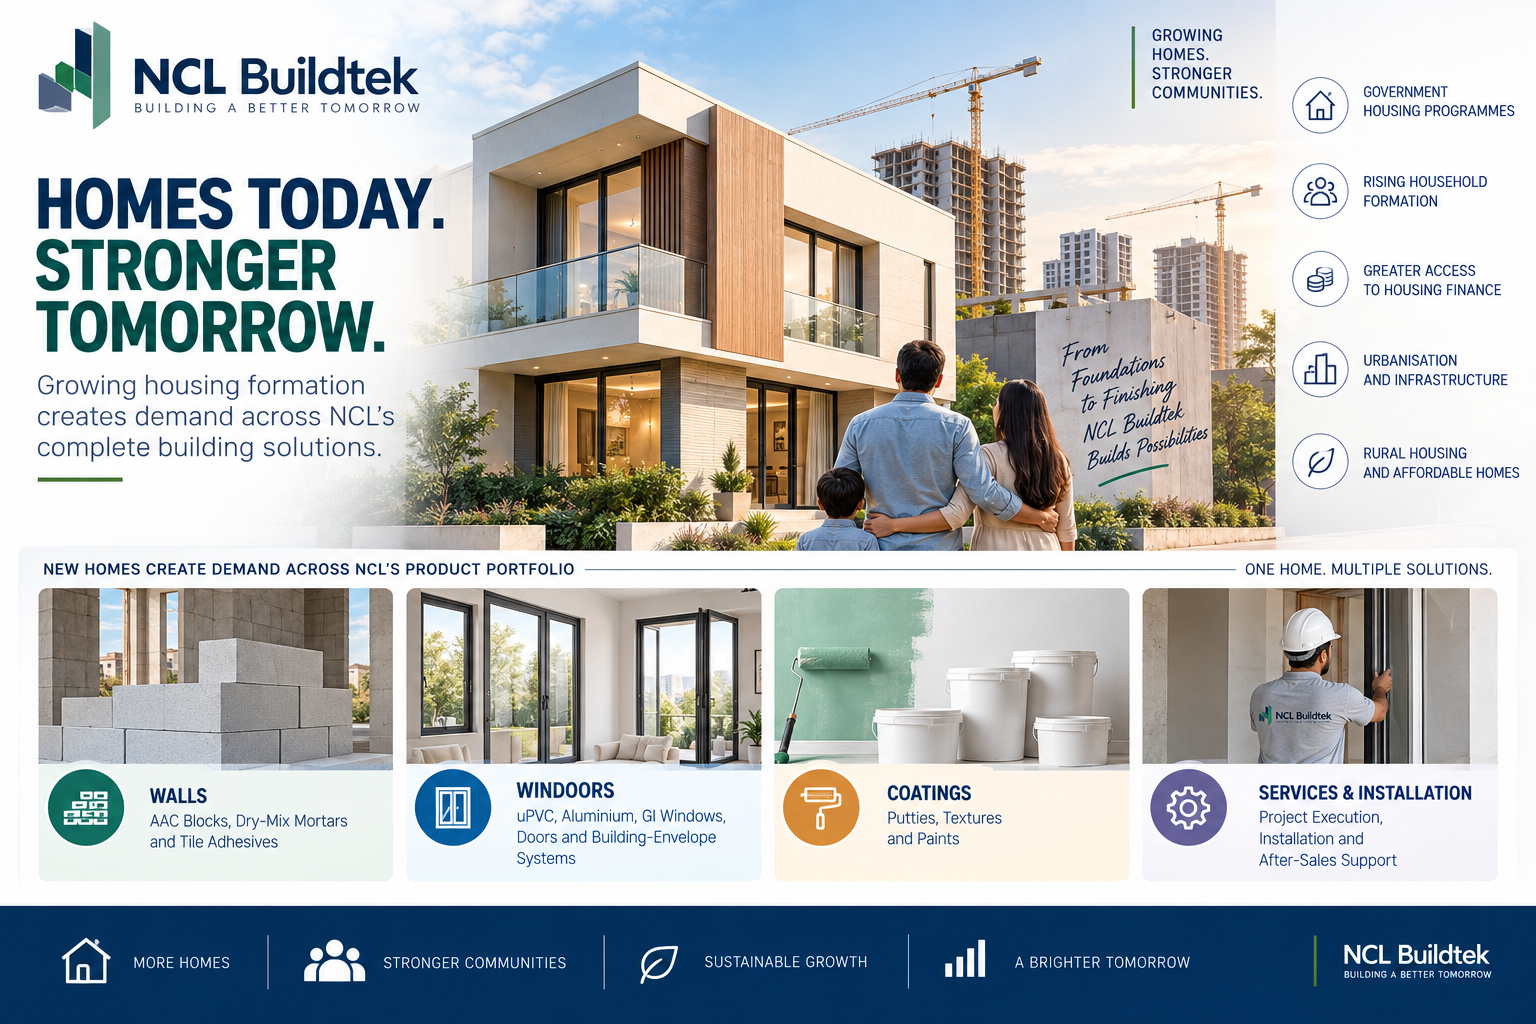
Housing Formation and Residential Construction
Urban and rural housing programmes, household formation and formal housing finance expand the underlying stock of homes requiring blocks, windows, doors, wall finishes and paints
Because NCL Buildtek touches both structural / envelope products and finishing products, new-home activity can drive demand across multiple divisions
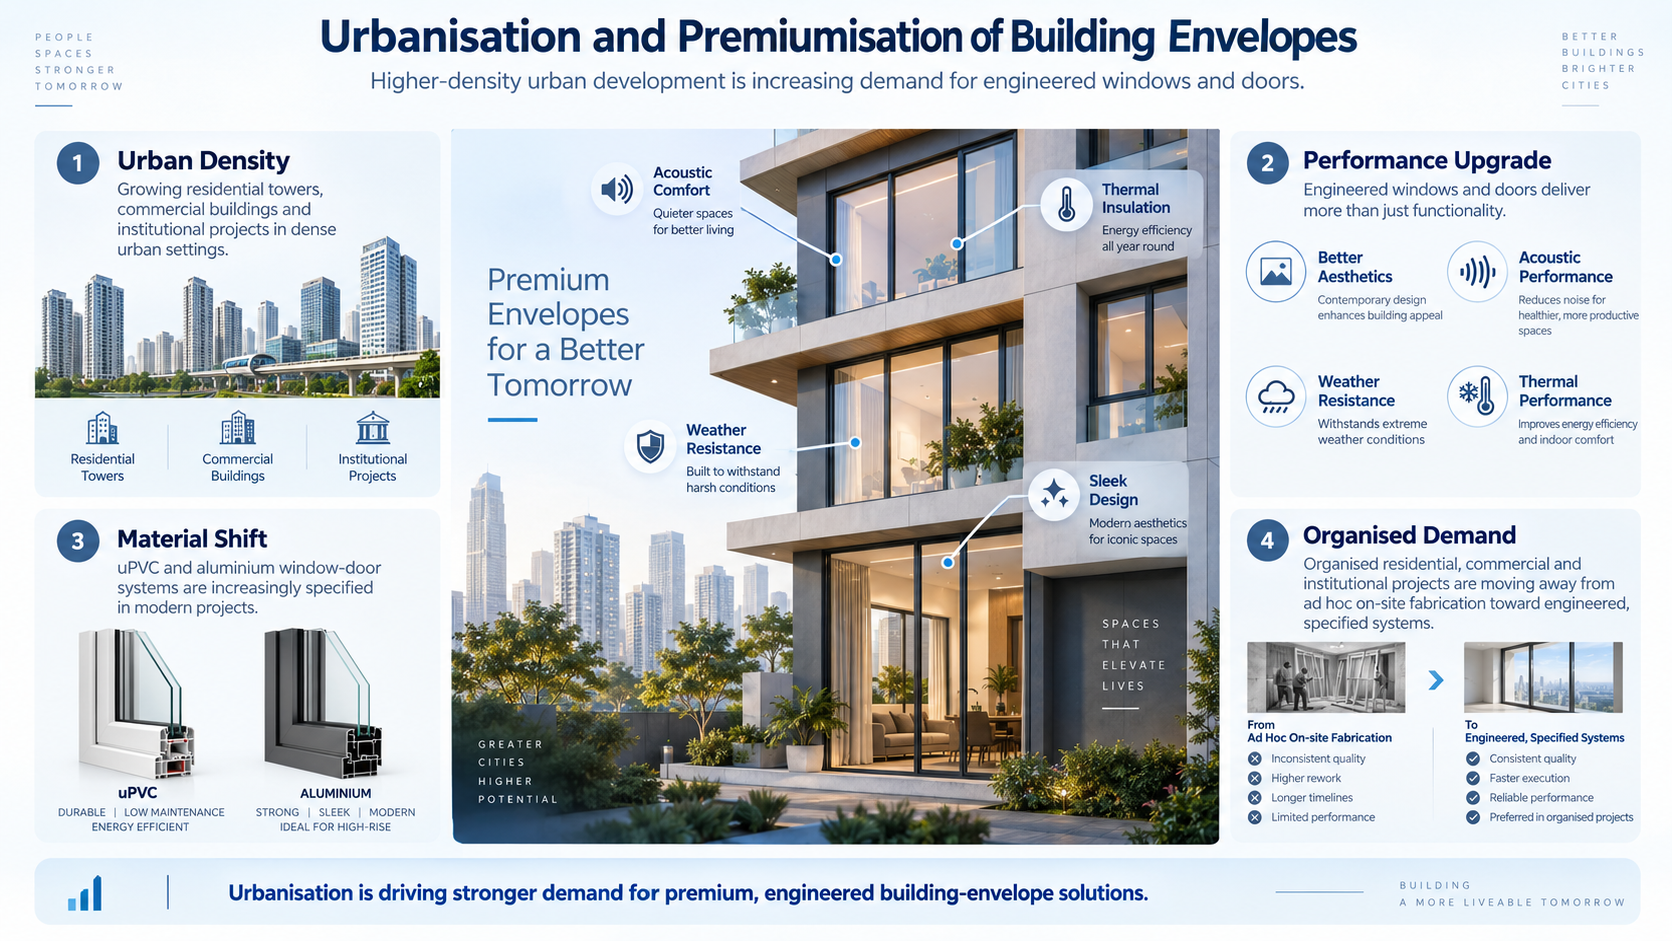
Urbanisation and Premiumisation of Building Envelopes
Higher-density urban development increases the need for engineered windows and doors with better aesthetics, acoustic performance, weather resistance and thermal performance
uPVC and aluminium systems are increasingly specified in organised residential, commercial and institutional projects rather than fabricated ad hoc at site
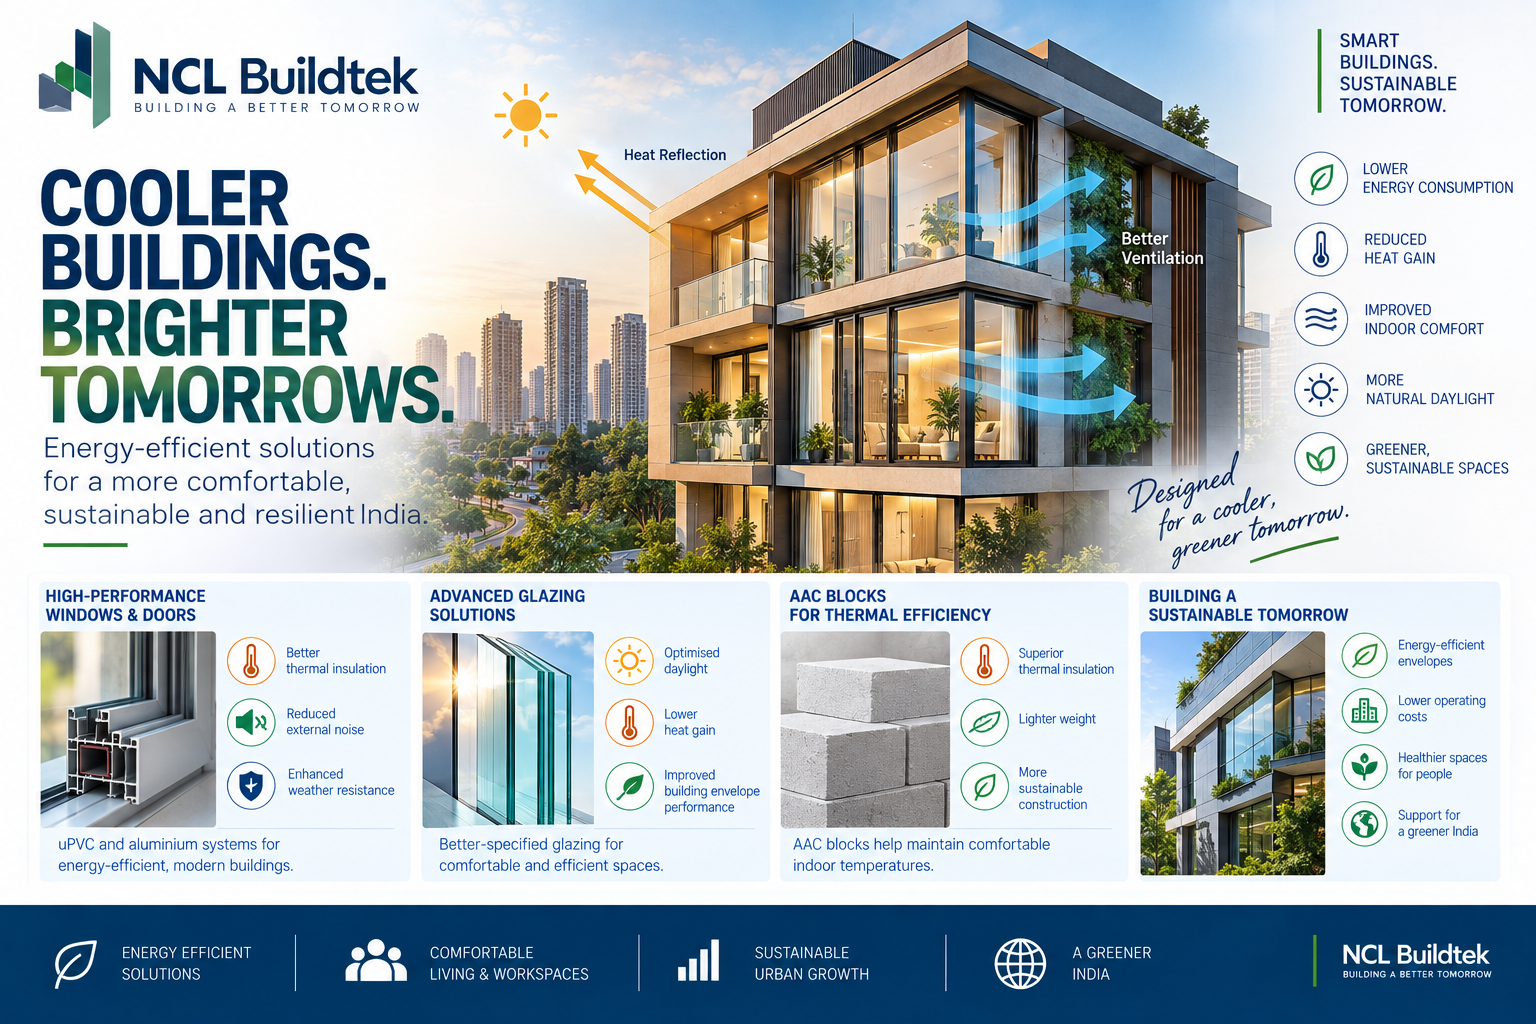
Energy-Efficient and Climate-Responsive Buildings
Building codes and customer preferences increasingly focus on heat gain, ventilation, daylight and envelope performance
This supports better-specified glazing, frames and building-envelope products. AAC blocks also offer thermal-insulation advantages relative to conventional dense masonry in many applications
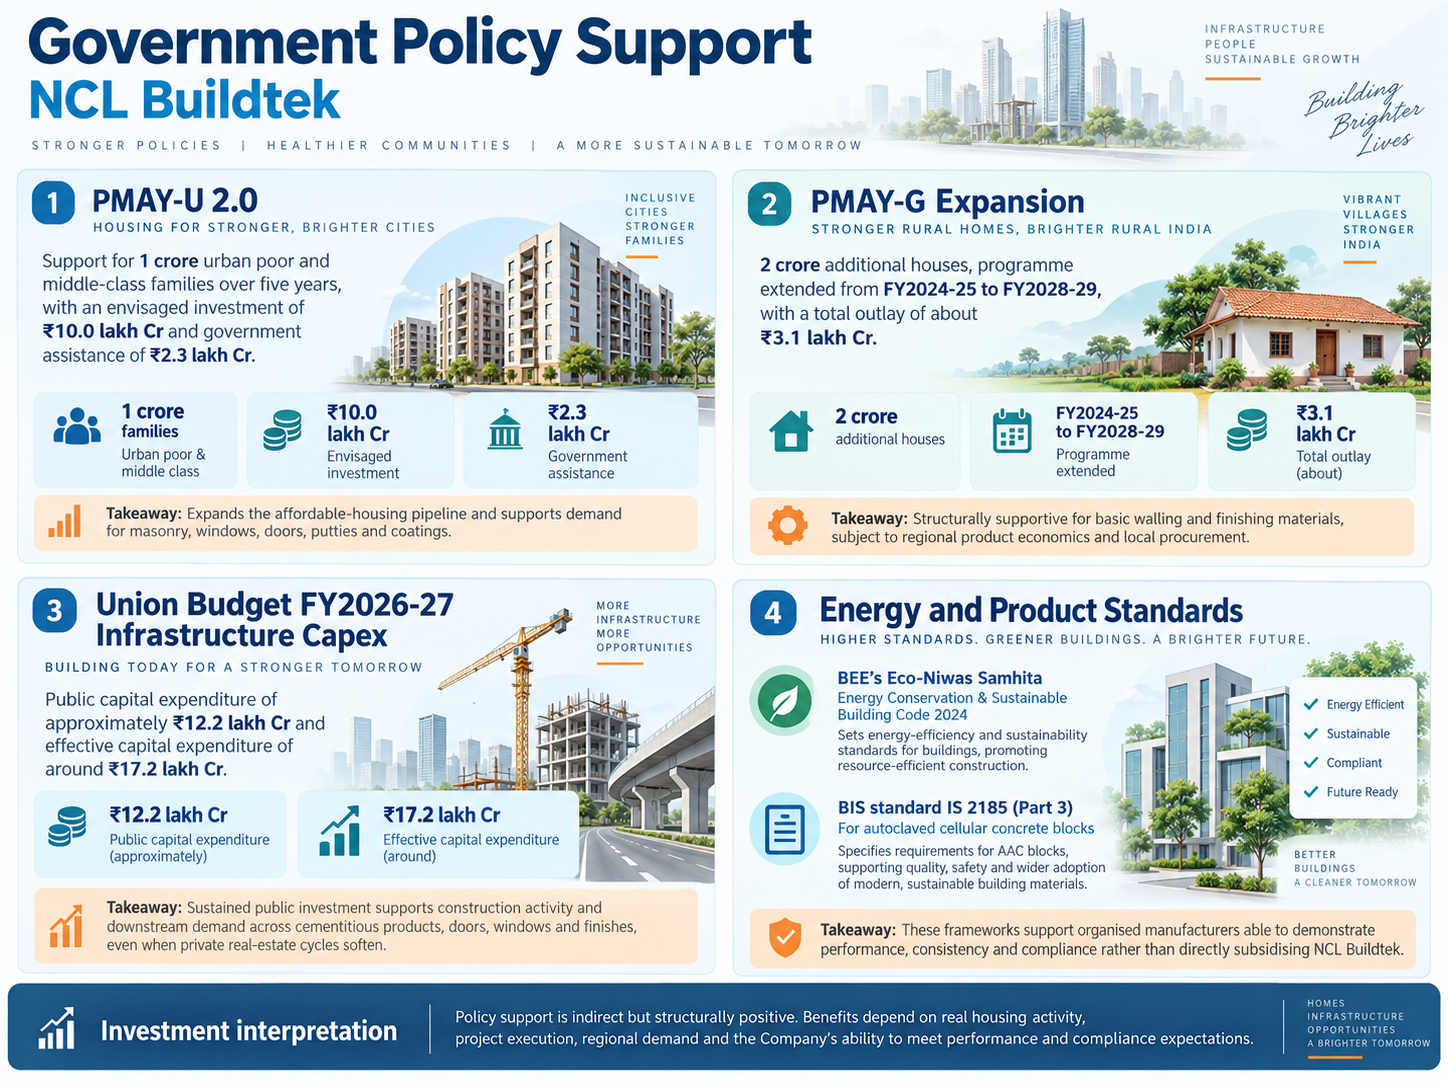
Government Policy Support
PMAY-U 2.0: The Union Cabinet approved support for 1 crore urban poor and middle-class families over five years, with an envisaged investment of ₹10.0 lakh Cr and government assistance of ₹2.3 lakh Cr. This expands the underlying affordable-housing pipeline and supports demand for masonry, windows, doors, putties and coatings
PMAY-G expansion: The rural housing programme was extended for FY2024-25 to FY2028-29 with 2 crore additional houses and a total outlay of about ₹3.1 lakh Cr. Large-scale rural house construction is structurally supportive for basic walling and finishing materials, subject to regional product economics and local procurement
Union Budget FY2026-27 infrastructure capex: Public capital expenditure was budgeted at approximately ₹12.2 lakh Cr, with effective capital expenditure around ₹17.2 lakh Cr. Sustained public investment supports construction activity and downstream demand across cementitious products, doors, windows and finishes, even when private real-estate cycles soften
Energy and product standards: BEE’s Eco-Niwas Samhita / Energy Conservation & Sustainable Building Code 2024 strengthens the focus on building-envelope thermal performance, daylight and ventilation. BIS standards such as IS 2185 (Part 3) prescribe requirements for autoclaved cellular concrete blocks. These frameworks support organised manufacturers able to demonstrate performance, consistency and compliance rather than directly subsidising NCL Buildtek
- Overview
- Business
- Financial Highlights
- Industry Overview
- Documentation
Get the Preqt App and keep in touch around the clock!
 Monitor your investments in real-time.
- Receive tailored deal suggestions.
- Get real-time updates and alerts.
