

Nityas Gems & Jewellery
Crafting Timeless BrillianceElegance in Every Detail
IPO Summary (PreQT)
Nityas Gems and Jewellery Limited is a Surat-based, design-led manufacturer and seller of lab-grown diamond (LGD) studded gold jewellery, combining B2B manufacturing/distribution with D2C omnichannel retail through Ayaani Diamonds and Jewellery. Restated revenue increased from INR 11.7 Cr in FY23 to INR 96.8 Cr in FY25, while PAT rose from INR 0.2 Cr to INR 9.8 Cr and EBITDA margin expanded to 13.3%. H1 FY26 revenue was INR 88.5 Cr and PAT INR 8.5 Cr, but cash conversion remained weak because inventory and receivables absorbed substantial working capital. At the announced INR 70-INR 75 band, the all-fresh issue implies a post-issue market capitalisation of approximately INR 403.2-INR 431.9 Cr; the key case is high growth and LGD market tailwinds versus customer concentration, negative operating cash flow and a rapidly expanding working-capital cycle.
IPO Review Rating
Buy
MainboardCelebrating Every Occasion Through Elegant, Precisely Crafted Jewellery
Nityas' strongest attributes are its exceptional historical revenue growth, sharp margin expansion, 70.2% FY25 RoNW, 63.2% ROCE, declining leverage and exposure to an LGD jewellery market projected to grow at 15.8% CAGR through CY30. The IPO is also entirely fresh capital, with approximately ₹70 Cr earmarked for a genuine working-capital requirement rather than promoter monetisation.
The financial quality is not as strong as the headline P&L growth suggests. Operating cash flow has remained negative throughout the disclosed period, deteriorating to approximately negative ₹10.1 Cr in FY25 and negative ₹16.3 Cr during H1 FY26. Working-capital days have risen sharply, customer concentration remains meaningful, and FY25 related-party transactions equivalent to approximately 33.2% of revenue warrant monitoring.
The most important issue at the IPO price is valuation. At ₹75, the post-issue P/E works out to approximately 44.1x compared with the Company's disclosed listed-peer average of 18.7x, representing a premium of roughly 136%. The Company's superior historical growth and return ratios explain part of the premium, but the difference remains substantial.
PARAMETER
WEIGHT
SCORE
KEY FACTORS
Financial Performance
40.0%
4.0/5
Nityas has demonstrated exceptionally rapid revenue growth, substantial margin expansion, high return ratios and declining leverage. However, these positives are meaningfully offset by persistent negative operating cash flow, rapidly rising working-capital requirements and relatively high customer concentration
Show more
Detailed Analysis
The Company's revenue increased from ₹11.7 Cr in FY23 to ₹96.8 Cr in FY25, representing an exceptional FY23–FY25 CAGR of approximately 188.1%, albeit from a relatively small base
The Company's EBITDA margin expanded materially from 4.2% in FY23 to 13.3% in FY25, demonstrating meaningful operating leverage as the business scaled
The Company's PAT margin improved from 2.1% in FY23 to 10.1% in FY25, indicating a substantial improvement in profitability as revenue scaled
The Company's debt-to-equity ratio declined from 1.0x in FY23 to 0.3x in FY25 and 0.3x by September 2025, indicating a significant reduction in financial leverage
The Company generated a very strong 70.2% RoNW in FY25, although this unusually high return ratio partly reflects the relatively small historical equity base
The Company generated negative operating cash flow in each reported period, with the deficit widening to ₹10.1 Cr in FY25 and ₹16.3 Cr in H1 FY26 as inventory and receivables absorbed cash
Industry
15.0%
4.0/5
Nityas operates in a structurally high-growth jewellery category supported by affordability, consumer acceptance, technology improvement and organised retail penetration. The principal industry risks are increasing competition, price erosion, evolving consumer perceptions, certification requirements and continued competition from natural diamonds
Show more
Detailed Analysis
India's lab-grown diamond jewellery market is projected to increase from ₹3,450.1 Cr in CY25 to ₹7,189.0 Cr in CY30, representing a strong projected CAGR of 15.8%
The Indian LGD jewellery industry remains in a relatively early growth phase, supported by improving consumer acceptance, widening retail distribution, technology improvements and greater adoption by younger buyers
The industry faces moderate regulatory requirements relating to hallmarking, certification, grading, imports, exports and consumer disclosure, while the framework continues to evolve as the category develops
Management
15.0%
4.0/5
Nityas benefits from an experienced lead promoter, 50% Board independence, no promoter OFS and no promoter minimum-contribution pledge. The principal governance concerns are historically high related-party transactions, limited listed-company Board experience and disclosed tax contingencies
Show more
Detailed Analysis
Chairman and Managing Director Rajnikant Lallubhai Chanchad has more than 20 years of gems and jewellery experience, although the other two promoters have considerably shorter sector experience of approximately five years and four years, respectively
Three of the Company's six Directors are Independent Directors, providing 50.0% Board independence, although only one Director has prior listed-company Board experience
The promoters' minimum contribution is not pledged or otherwise encumbered, while the principal disclosed financial contingency is approximately ₹2.7 Cr of tax matters under dispute
Related-party transactions were material at 33.2% of FY25 revenue, although they moderated to approximately 11.8% of revenue during the six months ended September 2025
Valuation
20.0%
3.0/5
Nityas' high growth and return ratios support a valuation premium, but the 44.1x diluted P/E compared with an 18.7x disclosed peer average is the most significant issue in the current scoring. The fresh issue materially improves book-value valuation, but the earnings multiple remains demanding
Show more
Detailed Analysis
Nityas' 44.1x post-issue P/E is approximately 136% above the 18.7x peer average, representing a substantial earnings-valuation premium
The issue is valued at approximately 7.9x FY25 historical book value, although the large fresh issue improves the approximate pro-forma post-issue P/B to around 2.7x before issue expenses
The RHP values Nityas Gems & Jewellery at an EV/EBITDA multiple of 14.2x, comparable EV/EBITDA multiples for the disclosed peers are not provided in the RHP and therefore require separate calculation for peer comparison
The Company generated a very strong 70.2% RoNW in FY25, materially exceeding the return ratios of the disclosed listed peers
Merchant Banker Track Record
10.0%
5.0/5
Choice Capital has built a credible recent mainboard IPO execution record, with multiple positively listed transactions. Its recent Sonaselection mandate was comparatively modest in subscription and listing return, demonstrating that the track record is positive but not uniformly high-return
Show more
Detailed Analysis
Choice Capital's six completed mainboard IPOs have delivered an average listing gain of approximately 17.8%, reflecting a strong recent listing-performance record
Choice Capital's six completed mainboard IPOs recorded an average subscription of approximately 64.1x, although demand varied significantly across issues, ranging from 2.0x to 96.7x
All 6 of Choice Capital's 6 completed mainboard IPOs listed above their respective issue prices, resulting in a 100% successful listing rate
TOTAL
100%
3.9/5
Weighted Composite Score
Issue Price
₹70.0 to ₹75.0
As of 28 Sep 2026
GMP
₹6.0
As of 28 Sep 2026
Estimated Gain / Loss
+8.0%
Lot Size
200.0 Shares
Grey Market Premium (GMPs) are shared for knowledge purpose only. PrEqt doesn’t promote or execute the trades.
| Issue Size (in Cr) | |
|---|---|
| Overall | ₹108.0 Cr |
| Fresh Issue | ₹108.0 Cr |
| Offer for Sale | ₹0.0 Cr |
Minimum Investment
₹15,000.0 / 40,000 shares

Merchant Banker
Choice Capital Advisors Pvt.Ltd.
Choice Capital Advisors Pvt.Ltd.
IPO Document
Offer Start Date
Offer End Date
Valuation
Revenue (FY'25)
PAT (FY'25)
Issue Size (in Cr)
Face Value
₹ 5.0Offer Price
₹ 75.0Lot Size
200.0 sharesSale Type
Fresh capital onlyPAT (FY'25)
₹ 9.8 CrPAT Margin (FY'25)
10.1 %P/E Multiple
44.1xEBITDA (FY'25)
₹ 12.9 CrCAGR Growth 2Y
188.1 %ROE (FY'25)
70.2 %ROCE (FY'25)
63.2 %Price to Book Value
2.7xDebt/Equity
0.3xCompany Website
www.nityas.inExplore new deals
Overview
Fund Allocation
Total: ₹0 CrSource:Company DRHP
Timeline
IPO Open Date
To Be Announced
IPO Close Date
To Be Announced
Tentative Allotment
To Be Announced
Initiation of Refunds
To Be Announced
Credit of Shares to Demat
To Be Announced
Tentative Listing Date
To Be Announced
Business
Business Model
Geographical Presence
Sales Channel
Key Risk Factor
Financial Highlights
Income Statement
Revenue growth with EBITDA and PAT margins
| Financial Metric | FY 2023 | FY 2024 | FY 2025 |
|---|---|---|---|
| Revenue (₹ Cr) | 11.7 | 53.7 | 96.8 |
| Growth (%) | - | 359.8% | 80.5% |
| EBITDA (₹ Cr) | 0.5 | 5.5 | 12.9 |
| EBITDA Margin (%) | 4.2% | 10.2% | 13.3% |
| PAT (₹ Cr) | 0.3 | 4.0 | 9.8 |
| PAT Margin (%) | 2.1% | 7.5% | 10.1% |
OBSERVATIONS & INSIGHTS
Revenue scaled from INR 11.7 Cr in FY23 to INR 96.8 Cr in FY25. Revenue expanded as production and sales volumes scaled: jewellery sold increased from 16.5 kg in FY23 to 66.3 kg in FY24 and 100.59 kg in FY25.
EBITDA margin expanded from 4.2% in FY23 to 13.3% in FY25 as higher scale improved absorption of manufacturing and operating costs. Margin expansion through FY25 reflects operating leverage as fixed and semi-fixed costs were spread over a much larger revenue base
PAT increased to INR 9.8 Cr in FY25. The profit trajectory is strong, but the gap between PAT and operating cash flow is significant because working capital has expanded much faster than earnings. The margin improved through FY25 as EBITDA margin expanded and fixed below-EBITDA costs were absorbed over greater scale
Balance Sheet
| Financial Metric | FY 2023 | FY 2024 | FY 2025 |
|---|---|---|---|
| Net Worth | ₹ 1.2 Cr | ₹ 5.3 Cr | ₹ 22.6 Cr |
| Total Assets | ₹ 6.1 Cr | ₹ 11.7 Cr | ₹ 39.9 Cr |
| Total Borrowing | ₹ 1.3 Cr | ₹ 3.3 Cr | ₹ 7.1 Cr |
| Reserves & Surplus | ₹ 0.2 Cr | ₹ 4.3 Cr | ₹ 20.1 Cr |
OBSERVATIONS & INSIGHTS
Net worth increased from ₹1.3 Cr in FY23 to ₹22.6 Cr in FY25, largely supported by the sharp rise in reserves and surplus, indicating substantial internal value creation
Total assets grew from ₹6.1 Cr in FY23 to ₹39.9 Cr in FY25, reflecting significant scaling of the business and higher operating requirements
Total borrowings rose from ₹1.3 Cr to ₹7.1 Cr over FY23–FY25, but the increase was much slower than the growth in net worth, resulting in an improved leverage position
Reserves and surplus increased from ₹0.3 Cr in FY23 to ₹20.1 Cr in FY25, indicating that accumulated earnings materially strengthened the Company's capital base
Cash Flow
| Financial Metric | FY 2023 | FY 2024 | FY 2025 |
|---|---|---|---|
CFO (₹ Cr) Cash generated from core business operations. | -0.8 Cr | -1.1 Cr | -10.1 Cr |
CFI (₹ Cr) Cash used for investments and long-term assets. | -1.3 Cr | -0.8 Cr | -0.4 Cr |
CFF (₹ Cr) Cash flow related to funding and borrowings. | +2.3 Cr | +1.7 Cr | +10.7 Cr |
Working Capital
| Efficiency Metric | FY 2023 | FY 2024 | FY 2025 |
|---|---|---|---|
Debtor Days Average number of days taken to collect customer payments. | - | - | - |
Creditor Days Average time taken to pay suppliers and vendors. | - | - | - |
Inventory Days Average number of days inventory remains unsold. | - | - | - |
CCC (Cash Conversion Cycle) (Debtor Days + Inventory Days - Creditor Days) | - | - | - |
Financial Ratios
Measures the company’s leverage relative to shareholder equity.
OBSERVATIONS & INSIGHTS
ROE increased from 19.7% in FY23 to 70.2% in FY25. The sharp FY24-FY25 levels reflect fast profit growth on a small average equity base
The same denominator effect is visible in ROCE: Returns initially benefited from a small capital base, then reduced as growth required substantially more equity, working capital and lease-backed assets
ROA surged as profit scaled off a small FY23 asset base, then declined as assets grew faster than profit, particularly inventory, receivables, right-of-use assets and goodwill
Debt-to-equity declined from 1.1x in FY23 to 0.3x in FY25, indicating a much stronger balance sheet and lower dependence on external borrowings
Interest coverage improved from 8.2x in FY23 to 26.3x in FY25, showing that operating earnings provide substantial coverage for finance costs
The current ratio improved from 1.3x in FY23 to 2.3x in FY25, indicating better short-term liquidity and a healthier ability to meet current obligations.
Current assets increased faster than current liabilities, driven mainly by inventory and trade receivables. The improvement therefore does not imply equivalent cash liquidity: much of the current-asset base is locked in working capital.
Industry Overview
Industry Drivers
Rapid Growth in India's LGD Jewellery Market
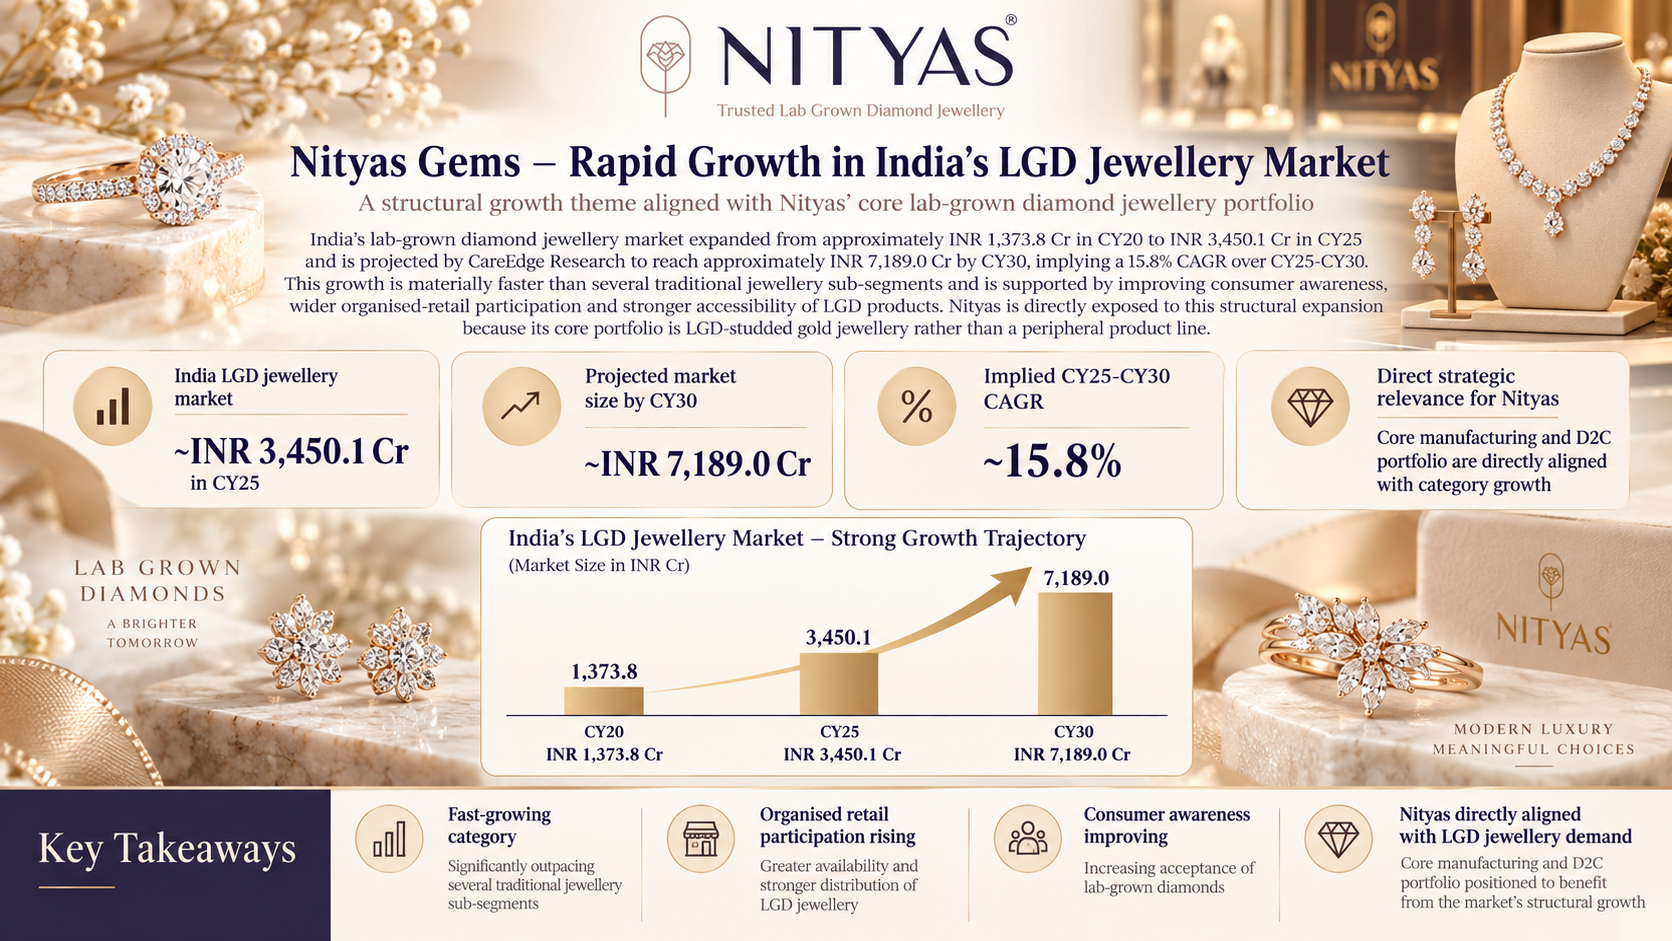
India’s lab-grown diamond jewellery market expanded from approximately INR 1,373.8 Cr in CY20 to INR 3,450.1 Cr in CY25 and is projected by CareEdge Research to reach approximately INR 7,189.0 Cr by CY30, implying a 15.8% CAGR over CY25-CY30. This growth is materially faster than several traditional jewellery sub-segments and is supported by improving consumer awareness, wider organised-retail participation and stronger accessibility of LGD products. Nityas is directly exposed to this structural expansion because its core portfolio is LGD-studded gold jewellery rather than a peripheral product line.
The key points are:
India LGD jewellery market: ~INR 3,450.1 Cr in CY25
CareEdge projects ~INR 7,189.0 Cr market size by CY30
Implied CY25-CY30 market CAGR: ~15.8%
Nityas’ core manufacturing and D2C portfolio is directly aligned with this category growth
Affordability Broadens the Consumer Base
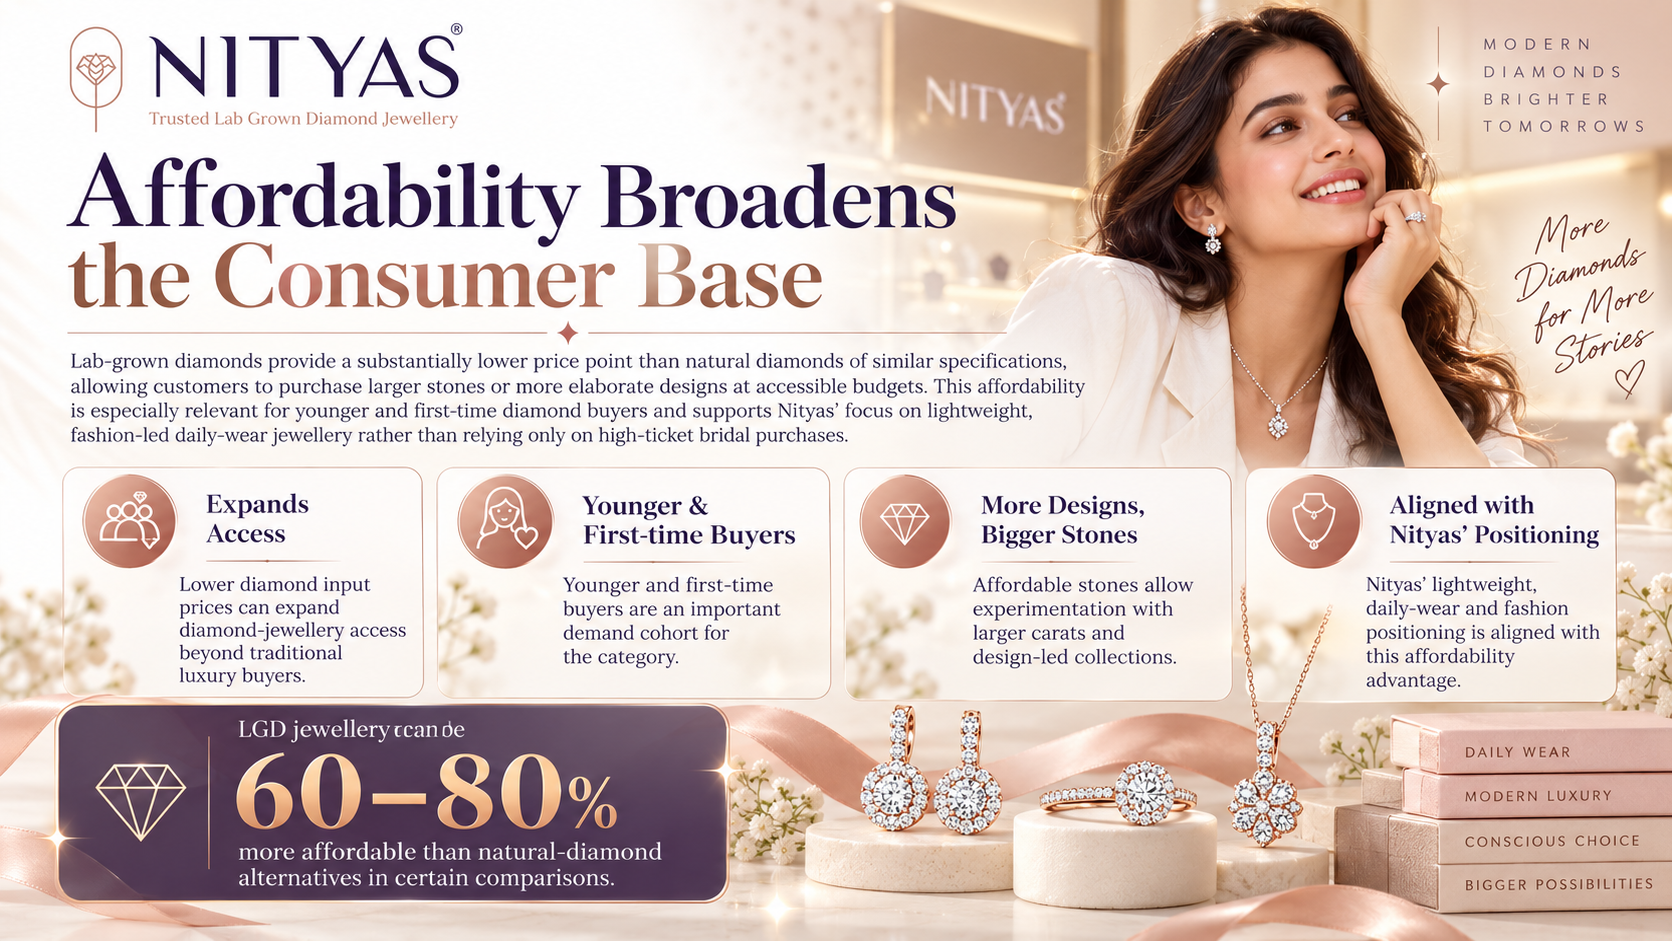
Lab-grown diamonds provide a substantially lower price point than natural diamonds of similar specifications, allowing customers to purchase larger stones or more elaborate designs at accessible budgets. CareEdge notes that LGD jewellery can be 60-80% more affordable than natural-diamond alternatives in certain comparisons. This pricing advantage is particularly relevant for younger and first-time diamond buyers and supports Nityas’ focus on lightweight, fashion-led daily-wear jewellery rather than relying only on high-ticket bridal purchases.
The key points are:
Lower diamond input prices can expand diamond-jewellery access beyond traditional luxury buyers
Younger and first-time buyers are an important demand cohort for the category
Affordable stones allow experimentation with larger carats and design-led collections
Nityas’ lightweight, daily-wear and fashion positioning is aligned with this affordability advantage
Organised Retail and Omnichannel Adoption
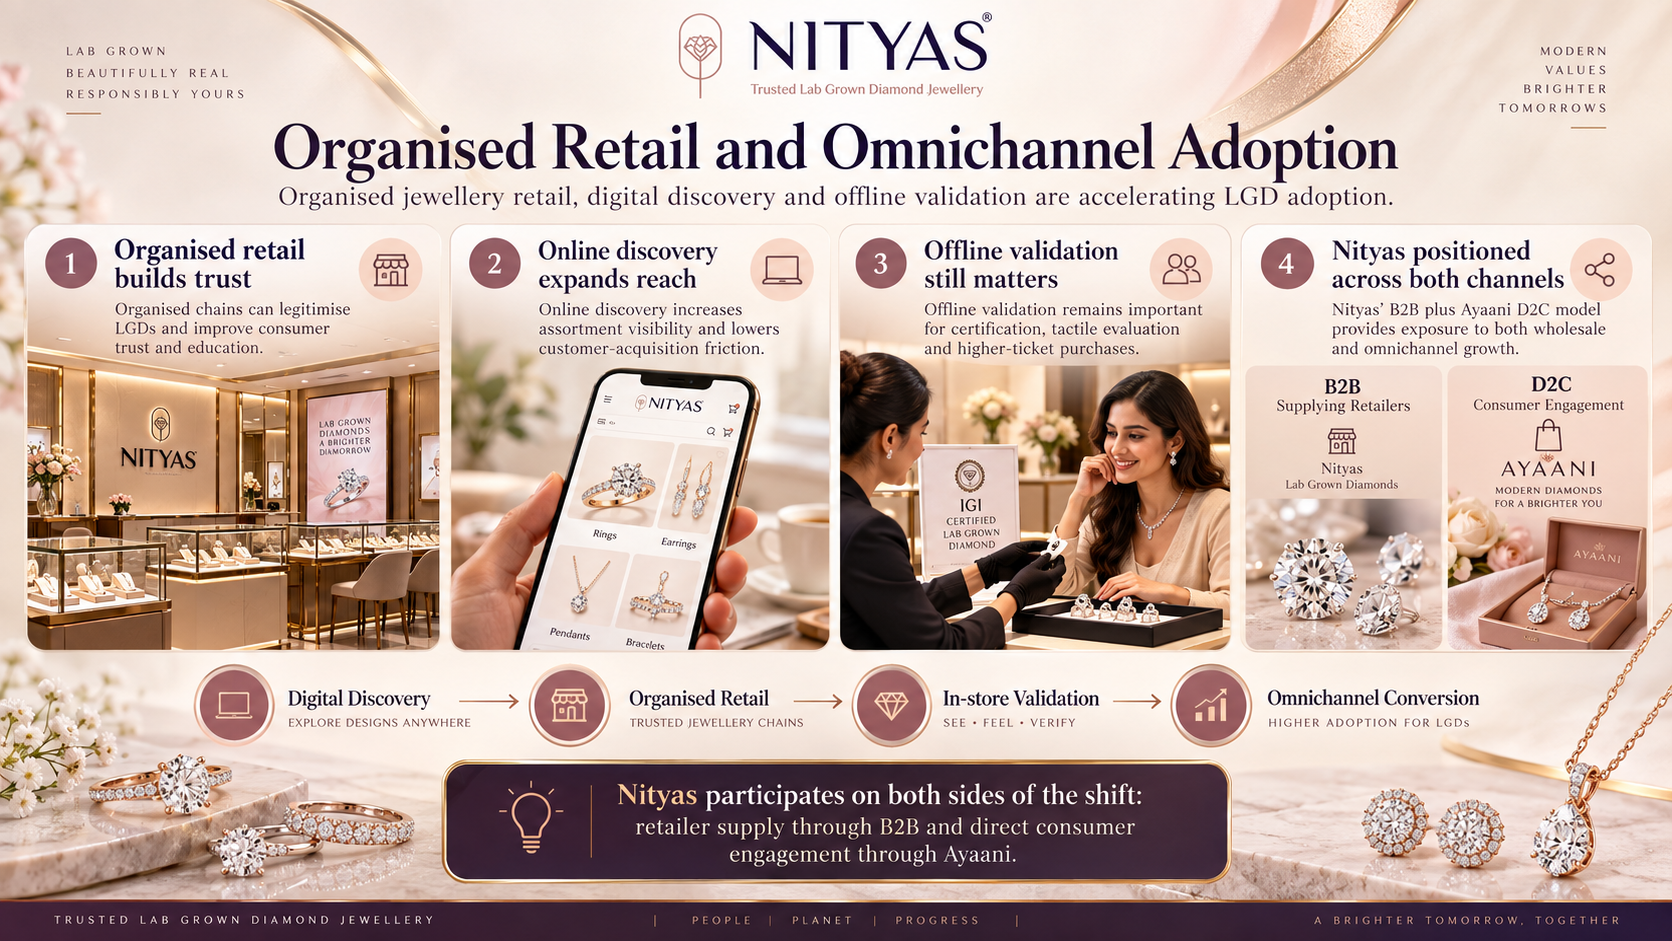
LGD adoption is increasingly supported by organised jewellery chains, digital discovery and omnichannel purchase behaviour. Consumers frequently discover designs online but still prefer physical verification, certification and in-person consultation for higher-value jewellery. This favours manufacturers that can supply organised retailers while also building direct-consumer channels. Nityas operates on both sides of this shift: its B2B business serves retailers and wholesalers, while Ayaani provides branded retail and digital engagement.
The key points are:
Organised chains can legitimise LGDs and improve consumer trust and education
Online discovery increases assortment visibility and lowers customer-acquisition friction
Offline validation remains important for certification, tactile evaluation and higher-ticket purchases
Nityas’ B2B plus Ayaani D2C model provides exposure to both wholesale and omnichannel growth
Risks in the Industry
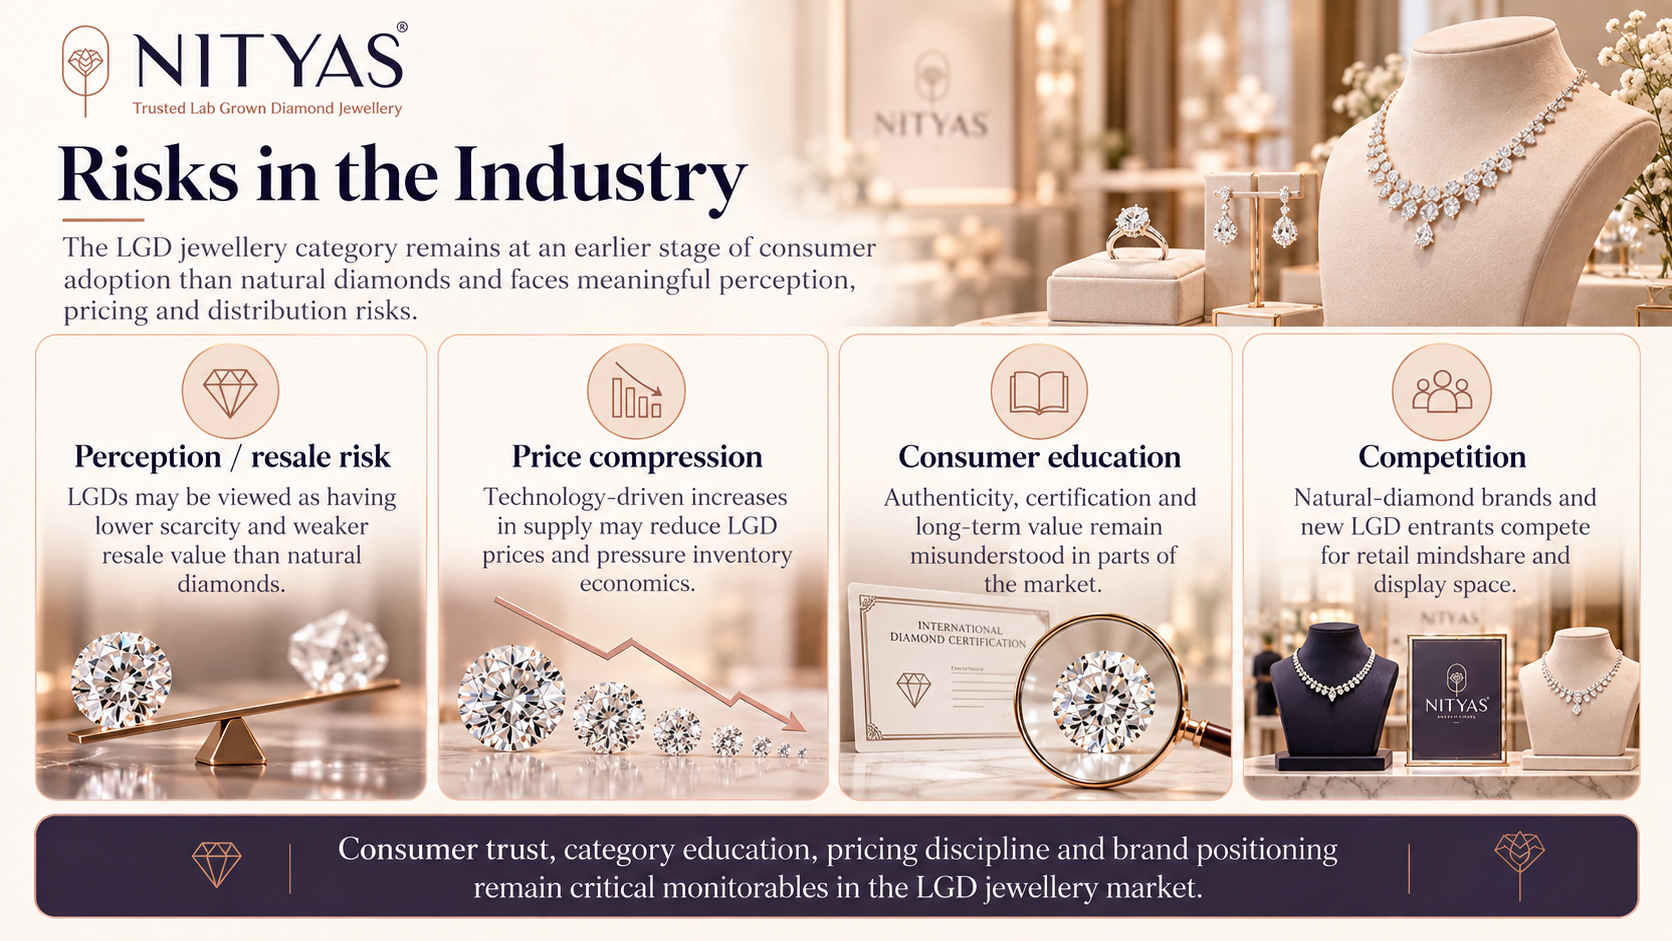
The LGD jewellery category remains at an earlier stage of consumer adoption than natural diamonds and faces meaningful perception, pricing and distribution risks. A segment of consumers continues to associate natural diamonds with scarcity, prestige and resale value, while rapid improvements in LGD manufacturing can lower stone prices and create inventory-markdown risk. Retail penetration outside major urban markets remains uneven, and suppliers must continually invest in branding, certification, design and consumer education to build trust.
The key risks are:
Perception / resale risk: LGDs may be viewed as having lower scarcity and weaker resale value than natural diamonds
Price compression: technology-driven increases in supply may reduce LGD prices and pressure inventory economics
Consumer education: authenticity, certification and long-term value remain misunderstood in parts of the market
Competition: natural-diamond brands and new LGD entrants compete for retail mindshare and display space
Government Policy Support
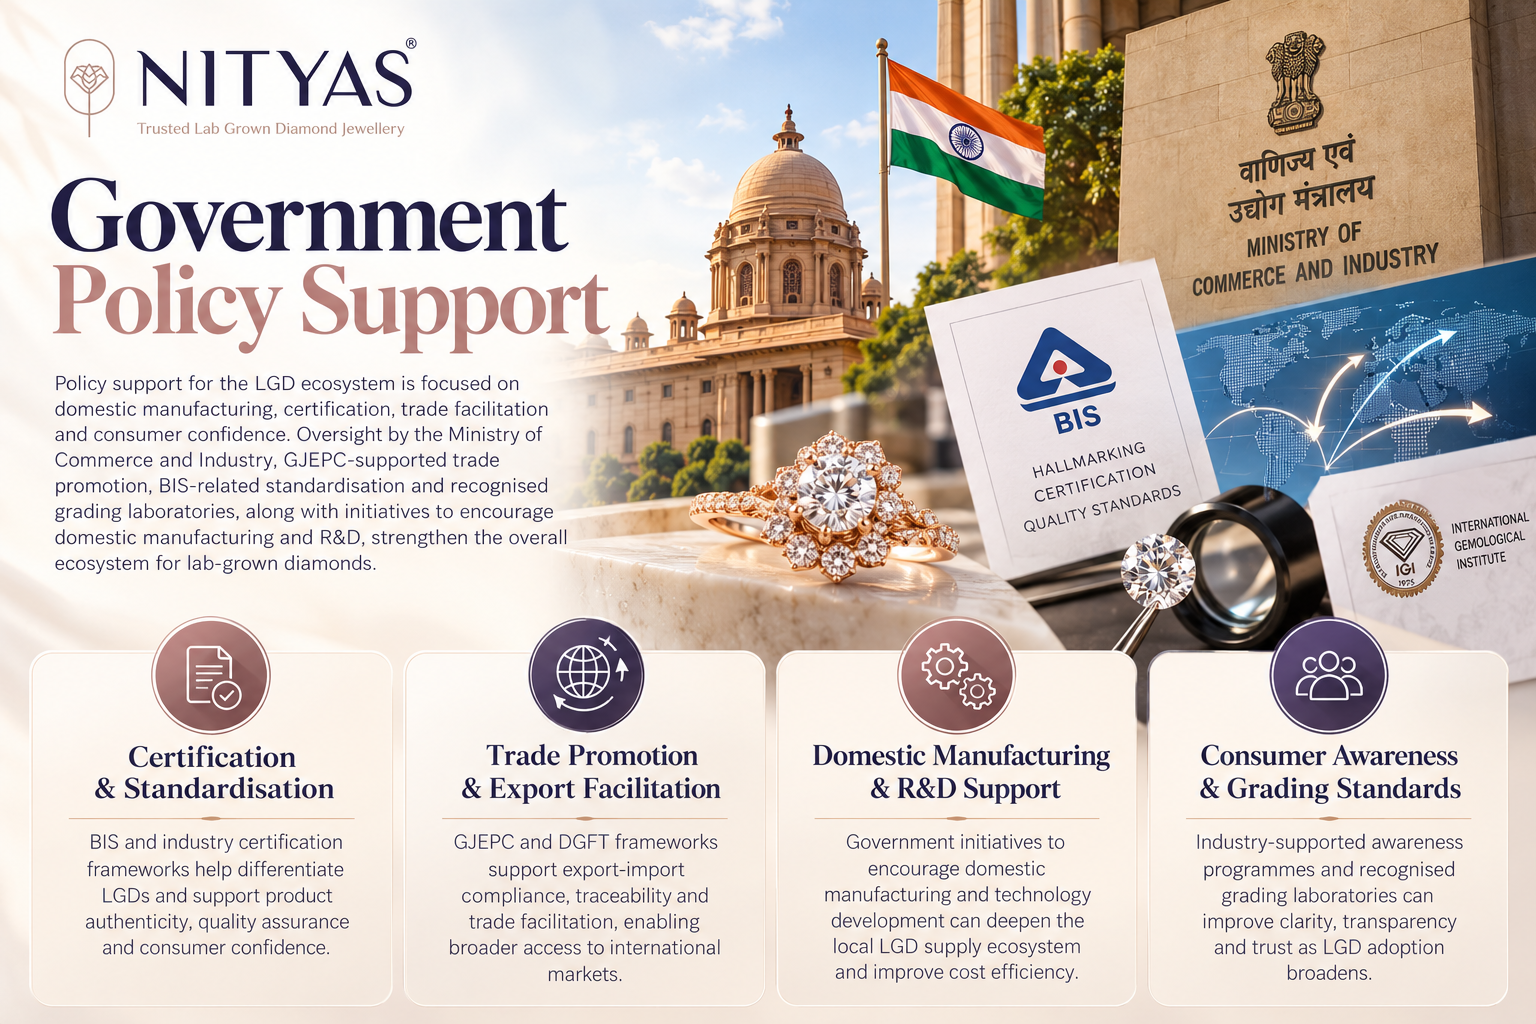
Policy support for the LGD ecosystem is focused on domestic manufacturing, certification, trade facilitation and consumer confidence. The CareEdge report identifies oversight by the Ministry of Commerce and Industry, GJEPC-supported trade promotion, BIS-related standardisation and recognised grading laboratories. It also notes government initiatives intended to encourage domestic manufacturing and R&D. For Nityas, the most relevant policy benefits are a stronger domestic LGD ecosystem, improved certification standards and easier access to export markets rather than a company-specific subsidy.
The key policies are:
BIS/industry certification frameworks help differentiate LGDs and support product authenticity
GJEPC and DGFT frameworks support export-import compliance, traceability and trade facilitation
Domestic manufacturing and technology policy can deepen the local supply ecosystem
Consumer-awareness and grading standards can improve trust as LGD adoption broadens
Fundraise/Future Plans
Shareholding
Pre-issue shareholding
Promoter Holding 0.0%
Post-Issue Shareholding
Promoter Holding 0.0%
Category
Pre-Issue%Post-Issue%
Promoters
Rajnikant Lallubhai Chanchad
52.0%39.0%
Wealthwave Capital Fund
5.1%3.8%
Monpara Raj Dineshbhai
4.1%3.1%
Sonalben Rajnikant Chanchad
4.0%3.0%
SK Family Trust
3.8%2.9%
Total Promoter Holding
69.0%51.8%
Additional Shareholders
Other Shareholders
31.0%48.2%
Total Additional Holding
31.0%48.2%
Total Shareholding
100.0%100.0%
- Overview
- Business
- Financial Highlights
- Industry Overview
- Fundraise/Future Plans
- Documentation
Get the Preqt App and keep in touch around the clock!
 Monitor your investments in real-time.
- Receive tailored deal suggestions.
- Get real-time updates and alerts.
