


PharmEasy (API Holdings Ltd.)
Healthcare Made AccessibleTechnology for Better Health
Unlisted Review and Rating
Speculative
DRHP Not FiledOverall Recommendation
API is materially better than the FY23 version of itself. PAT loss has fallen from roughly INR 5,212 Cr in FY23 to INR 1,572 Cr in FY25, gross debt has been cut by approximately half in FY25 alone, D/E has fallen to around 0.6x, revenue returned to growth, and the balance sheet has received substantial equity support. Those are meaningful improvements, not cosmetic ones. The problem is that the operating business had still not crossed the key threshold in FY25. Core EBITDA remained approximately -661Rs Cr, PAT margin was still -26.8%, ROE remained deeply negative, and operating cash flow actually worsened to INR -223.5 Cr. API therefore still needed external capital and refinancing despite the dramatic reduction in reported losses.
There are also legitimate governance/diligence issues: multiple subsidiaries were on non-going-concern or realisable-value accounting bases, several group entities attracted CARO/audit-trail observations, and a large portion of Thyrocare remains pledged against refinancing. These do not mean the accounts are unreliable, the consolidated auditor gave an unmodified opinion, but they mean API requires more diligence than a straightforward profitable unlisted company. There is one important post-FY25 positive checkpoint: current unlisted-market research citing API's Q4 FY26 investor presentation indicates the Group became EBITDA-positive in FY26, with roughly INR 62.5 Cr consolidated EBITDA versus a loss in FY25. I would treat that as encouraging but not incorporate it into the audited FY25 score until the FY26 audited statements validate the quality and sustainability of that profitability
PARAMETER
WEIGHT
SCORE
KEY FACTORS
Financial Performance
25.0%
2.0/5
Debt reduction and narrowing losses are major positives, but negative EBITDA, negative ROE and worsening operating cash flow keep financial quality weak
Show more
Detailed Analysis
FY25 revenue recovered 3.7% to ₹5,872.2 Cr, but remains below FY23's INR 6,643.9 Cr; FY23-FY25 CAGR is roughly -6%
Core EBITDA remained negative at approximately INR 661.3 Cr, with margin of -11.3% versus -11.4 in FY24. Margin stabilised, but operating breakeven had not been reached
PAT loss narrowed sharply by 37.9% to INR 1,572.4 Cr, but PAT margin remained deeply negative at -26.8
The strongest FY25 improvement. Gross borrowings fell ~50% to INR 2,033.7 Cr and D/E reduced from ~1.6x to 0.6x
Approximate FY25 ROE remained around -53.7%, reflecting substantial destruction of equity value despite narrowing losses
Industry
25.0%
4.0/5
Large healthcare demand and digital penetration create attractive structural growth, but competition, low distribution margins and regulatory complexity limit industry scoring
Show more
Detailed Analysis
Indian pharma and healthcare have strong structural demand. India's domestic pharma market is projected to exceed US$130 Bn by 2030, implying >10% long-term growth
Pharma distribution is mature, while digital pharmacy, diagnostics and digitally enabled healthcare remain in a consolidation-and-growth stage
Medicine sales remain tightly regulated and the specific framework for e-pharmacy continues to add regulatory uncertainty to digital distribution models
India's pharma industry has significant global opportunity, but API Holdings itself remains predominantly an India-focused distribution, digital-health and diagnostics platform
Management
25.0%
4.0/5
Strong board quality and professionalisation are positives, but the legacy debt structure, subsidiary audit issues and pledged Thyrocare stake materially reduce governance comfort.
Show more
Detailed Analysis
The founding team created a scaled integrated healthcare platform, but the earlier acquisition-and-debt-led expansion resulted in severe losses and required a major capital reset
Governance depth is strong, with experienced independent and non-executive directors including Aditya Puri, Deepak Vaidya, Subramaniam Somasundaram and Vineeta Rai
Related-party activity exists across associates/group entities and the Impex Healthcare classification issue warrants diligence, but no evidence in the supplied statements supports treating RPTs as abusive
Valuation Metrics
25.0%
1.0/5
Current valuation is not extreme on sales, but negative earnings and EBITDA mean investors are paying today for a future turnaround rather than current profitability
Show more
Detailed Analysis
API remains loss-making. A negative P/E should not be interpreted as cheap
FY25 core EBITDA remained negative
3.2–3.5x book is not obviously cheap for a company generating materially negative ROE and operating losses
TOTAL
100%
2.8/5
Weighted Composite Score
Per Share Price
₹7.8
As of 24 Oct 2026
Lot Size
10,000.0 Shares
Minimum Investment
₹78,000.0 / 10,000 shares
Market Cap. (₹ Cr)
Revenue FY’25
PAT FY’25
Face Value
₹ 1.0Offer Price
₹ 6.3Lot Size
10,000.0 sharesSale Type
Secondary SalePAT FY’25
₹ -1,572.4 CrPAT Margin (%)
-26.8 %CAGR Growth 3Y
-6.0 %ROE (FY’25)
-53.7 %ROCE (FY’25)
-12.0 %Price to Book Value ratio
3.3xMerchant banker appointed
❌ NoCompany Website
www.apiholdings.inDisclaimer: Unlisted shares are unregulated & illiquid. This is NOT investment advice. Please do your own due diligence before investing.
Minimum Investment
₹78,000.0 / 10,000 sharesShares Lot 10000 X 1
Investment amount
₹78,000.0
Overview
Business
Services
Business Model
Geographical Presence
Sales Channel
Financial Highlights
Income Statement
Revenue growth with EBITDA and PAT margins
| Financial Metric | FY 2023 | FY 2024 | FY 2025 |
|---|---|---|---|
| Revenue (₹ Cr) | 6,643.9 | 5,664.3 | 5,872.2 |
| Growth (%) | - | -14.7% | 3.7% |
| EBITDA (₹ Cr) | -1,365.6 | -551.1 | -553.4 |
| EBITDA Margin (%) | -20.6% | -9.7% | -9.4% |
| PAT (₹ Cr) | -5,211.7 | -2,533.5 | -1,572.4 |
| PAT Margin (%) | -78.4% | -44.7% | -26.8% |
OBSERVATIONS & INSIGHTS
Revenue contracted at a 6.0% two-year CAGR; the 3.7% FY25 recovery did not regain the FY23 base, The move from a 14.7% decline to 3.7% growth indicates stabilisation, not yet a high-growth trajectory
The operating loss improved sharply from FY23 but was broadly unchanged in FY25, leaving the core business below breakeven, The proxy margin improved by 11.1 percentage points over two years to negative 9.4%, showing substantial cost correction
Total loss narrowed by 69.8% from FY23 to FY25 but remained INR 1,572.4 Cr, The margin improved by 51.6 percentage points yet remained materially negative because of operating losses, finance costs and exceptional impairment charges
Balance Sheet
| Financial Metric | FY 2023 | FY 2024 | FY 2025 |
|---|---|---|---|
| EQUITY & LIABILITIES | ₹ 8,256.4 Cr | ₹ 8,389.7 Cr | ₹ 6,976.6 Cr |
| Net Worth | ₹ 2,436.9 Cr | ₹ 2,588.3 Cr | ₹ 3,272.3 Cr |
| Share Capital | ₹ 614.2 Cr | ₹ 624.0 Cr | ₹ 651.7 Cr |
| Reserves & Surplus | ₹ 1,822.7 Cr | ₹ 1,964.3 Cr | ₹ 2,620.6 Cr |
| Total Liabilities | ₹ 5,819.5 Cr | ₹ 5,801.4 Cr | ₹ 3,704.3 Cr |
| Current Liabilities | ₹ 2,323.2 Cr | ₹ 3,502.5 Cr | ₹ 1,781.2 Cr |
| Borrowings | ₹ 919.1 Cr | ₹ 2,074.0 Cr | ₹ 349.6 Cr |
| Trade Payables | ₹ 413.4 Cr | ₹ 412.9 Cr | ₹ 426.7 Cr |
| Other Current Liabilities | ₹ 990.7 Cr | ₹ 1,015.6 Cr | ₹ 1,004.9 Cr |
| Non-Current Liabilities | ₹ 3,496.3 Cr | ₹ 2,298.9 Cr | ₹ 1,923.1 Cr |
| Borrowings | ₹ 3,200.9 Cr | ₹ 2,024.4 Cr | ₹ 1,684.1 Cr |
| Other Non-Current Liabilities | ₹ 295.4 Cr | ₹ 274.5 Cr | ₹ 239.0 Cr |
| ASSETS | ₹ 8,255.4 Cr | ₹ 8,389.8 Cr | ₹ 6,976.7 Cr |
| Current Assets | ₹ 2,533.9 Cr | ₹ 3,476.3 Cr | ₹ 2,512.7 Cr |
| Trade Receivables | ₹ 905.0 Cr | ₹ 706.2 Cr | ₹ 669.5 Cr |
| Inventory | ₹ 688.2 Cr | ₹ 555.6 Cr | ₹ 553.9 Cr |
| Cash & Cash Equivalents | ₹ 297.5 Cr | ₹ 1,610.5 Cr | ₹ 739.8 Cr |
| Other Current Assets | ₹ 643.2 Cr | ₹ 604.0 Cr | ₹ 549.5 Cr |
| Non-Current Assets | ₹ 5,721.5 Cr | ₹ 4,913.5 Cr | ₹ 4,464.0 Cr |
| Fixed Assets | ₹ 1,070.3 Cr | ₹ 876.0 Cr | ₹ 807.4 Cr |
| Other Non-Current Assets | ₹ 4,651.2 Cr | ₹ 4,037.5 Cr | ₹ 3,656.6 Cr |
OBSERVATIONS & INSIGHTS
Total equity increased 26.4% to INR 3,272.3 Cr through new capital and non-controlling interests despite the annual loss, Share capital rose to INR 651.7 Cr while the mapped residual increased to INR 2,620.6 Cr; preference securities and ESOPs make issued equity an incomplete dilution measure
Payables were stable at INR 426.7 Cr, consistent with the broadly unchanged creditor-day profile, Short-term borrowings fell by INR 1,724.4 Cr in FY25, materially improving the current ratio and refinancing profile
Long-term borrowings declined to INR 1,684.1 Cr; total FY25 debt remained material before the post-year-end 2026 repayment event
Cash and bank balances fell to INR 739.8 Cr as term deposits were withdrawn and debt was repaid, Inventory remained stable and receivables fell to INR 669.5 Cr, supporting the improvement in operating-cycle days
The mapped fixed-asset balance declined to INR 807.4 Cr through amortisation, disposals and limited replacement, The INR 3,656.6 Cr balance remained the largest asset category and is dominated by goodwill; FY25 included INR 175.0 Cr of goodwill impairment
Cash Flow
| Financial Metric | FY 2023 | FY 2024 | FY 2025 |
|---|---|---|---|
CFO (₹ Cr) Cash generated from core business operations. | -746.6 Cr | -61.1 Cr | -223.5 Cr |
CFI (₹ Cr) Cash used for investments and long-term assets. | -71.1 Cr | -1,261.0 Cr | +775.0 Cr |
CFF (₹ Cr) Cash flow related to funding and borrowings. | +853.5 Cr | +1,456.8 Cr | -759.9 Cr |
Working Capital
| Efficiency Metric | FY 2023 | FY 2024 | FY 2025 |
|---|---|---|---|
Debtor Days Average number of days taken to collect customer payments. | - | - | - |
Creditor Days Average time taken to pay suppliers and vendors. | - | - | - |
Inventory Days Average number of days inventory remains unsold. | - | - | - |
CCC (Cash Conversion Cycle) (Debtor Days + Inventory Days - Creditor Days) | - | - | - |
Financial Ratios
Measures the company’s leverage relative to shareholder equity.
OBSERVATIONS & INSIGHTS
ROE remained negative because losses consumed owner value, although the FY25 result improved materially after equity infusion and lower losses, The ratio fell to 0.6x as borrowings reduced and total equity increased; this was the clearest audited balance-sheet improvement
Coverage remained negative in every year because pre-exceptional EBIT did not cover finance cost, Liquidity improved to 1.4x after repayment of current borrowings, but operating cash flow remained negative
ROA narrowed to 20.5% as losses reduced, yet the asset base still failed to generate a positive return
ROCE was negative 12.0% in FY25, confirming that capital employed did not earn its operating cost before exceptional items
Industry Overview
Industry Drivers
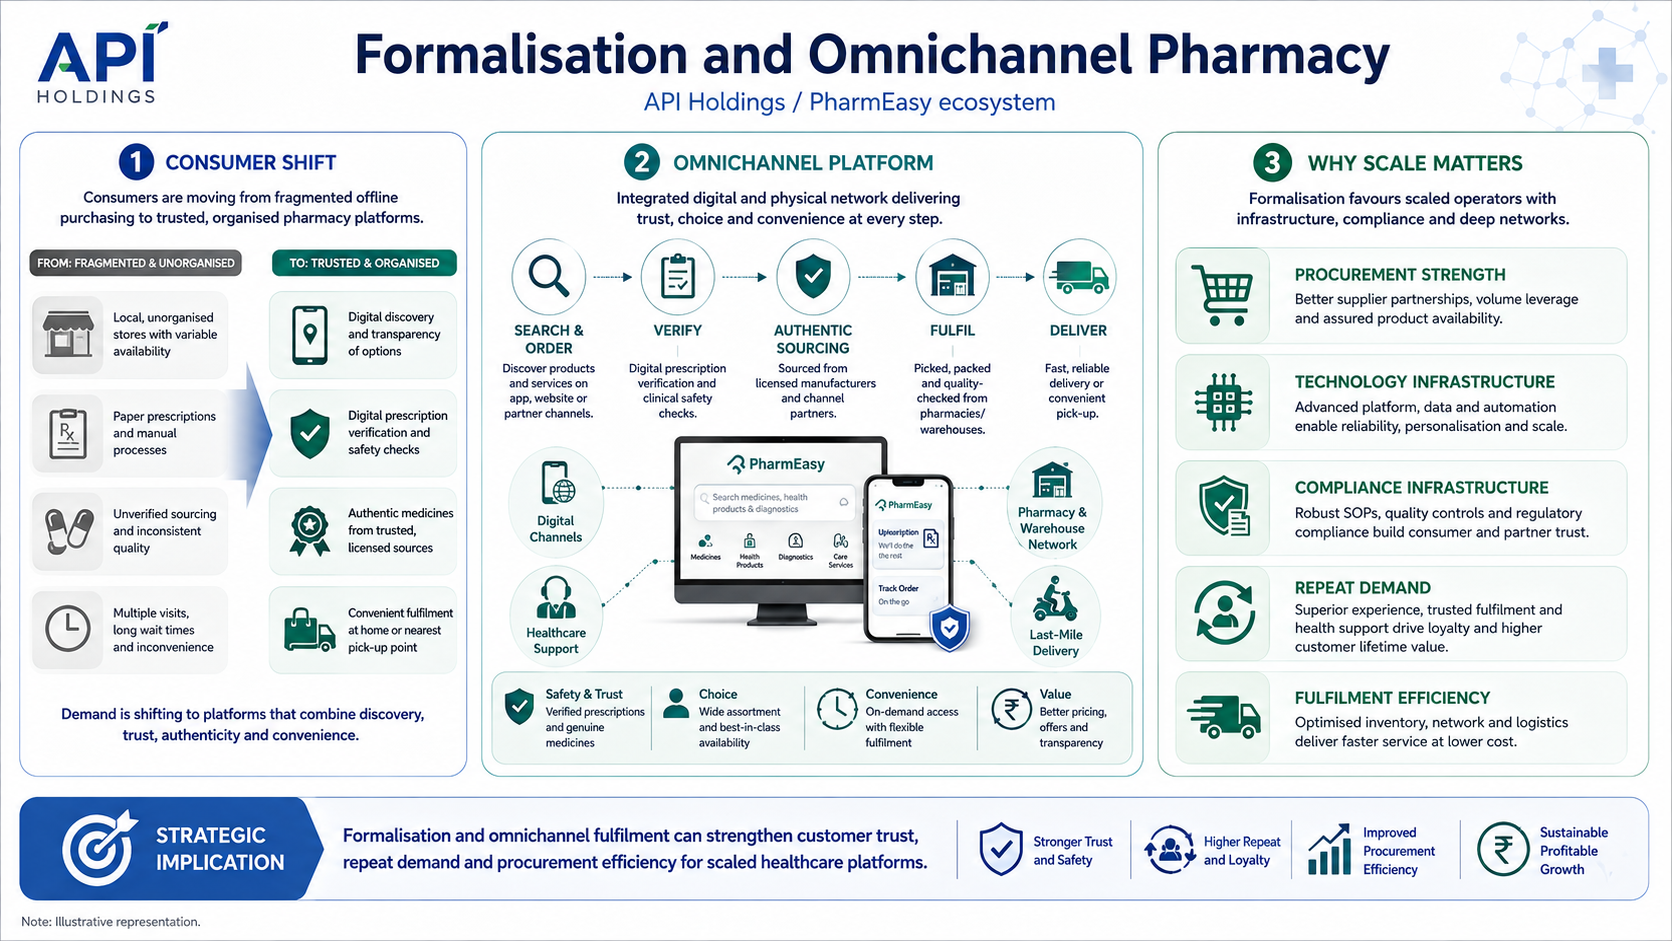
Formalisation and Omnichannel Pharmacy
Consumer demand is shifting toward organised platforms that combine digital discovery, prescription verification, authentic sourcing and convenient fulfilment
Formalisation can favour scaled operators with procurement, technology and compliance infrastructure
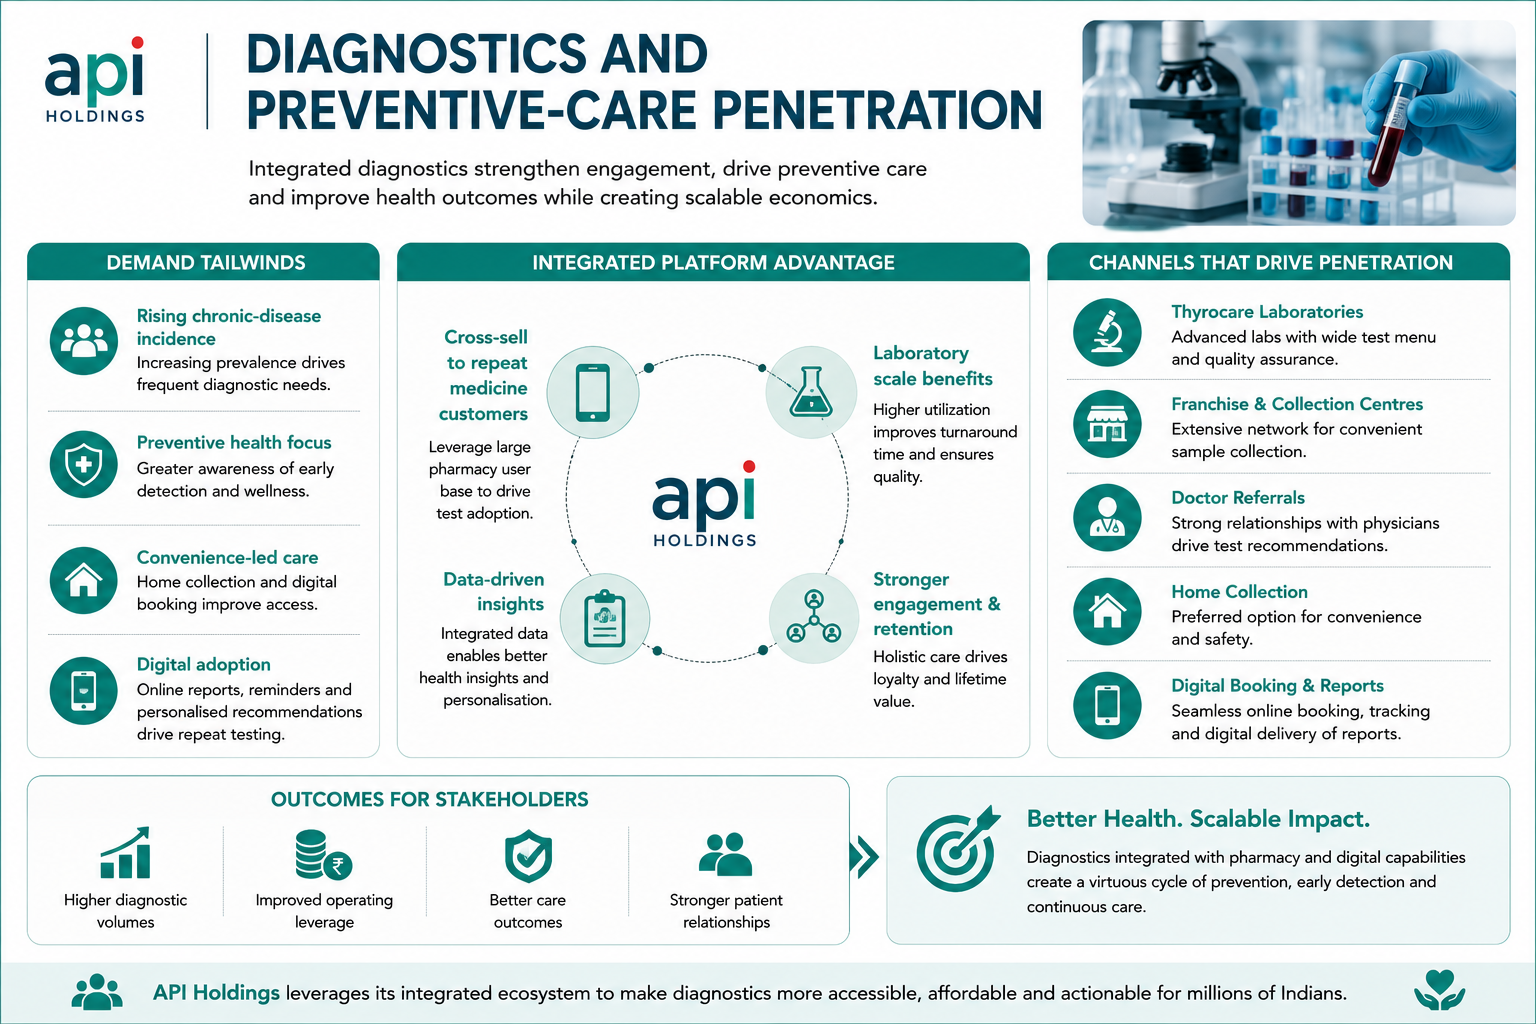
Diagnostics and Preventive-Care Penetration
Higher chronic-disease incidence, preventive testing, home collection and digital booking support diagnostic volumes
Integrated platforms can cross-sell tests to repeat medicine customers while using laboratory scale to improve turnaround and utilisation
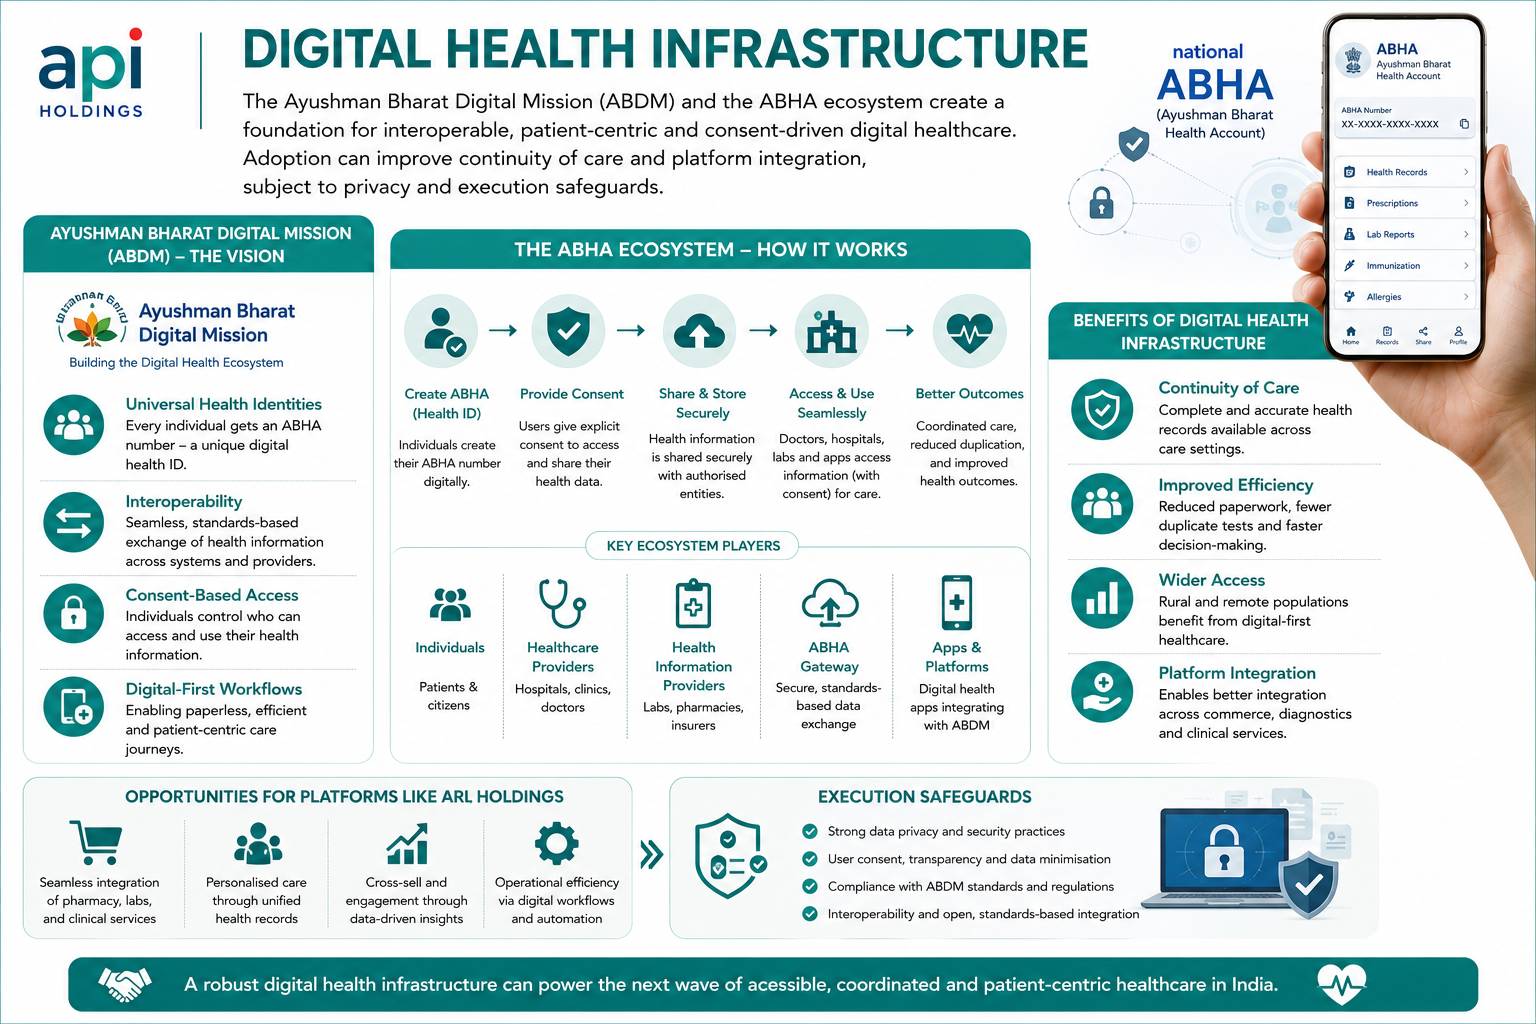
Digital Health Infrastructure
The Ayushman Bharat Digital Mission and ABHA ecosystem support interoperable health identities, consent-based information exchange and digital-care workflows
Adoption can improve continuity and platform integration, subject to privacy and execution safeguards
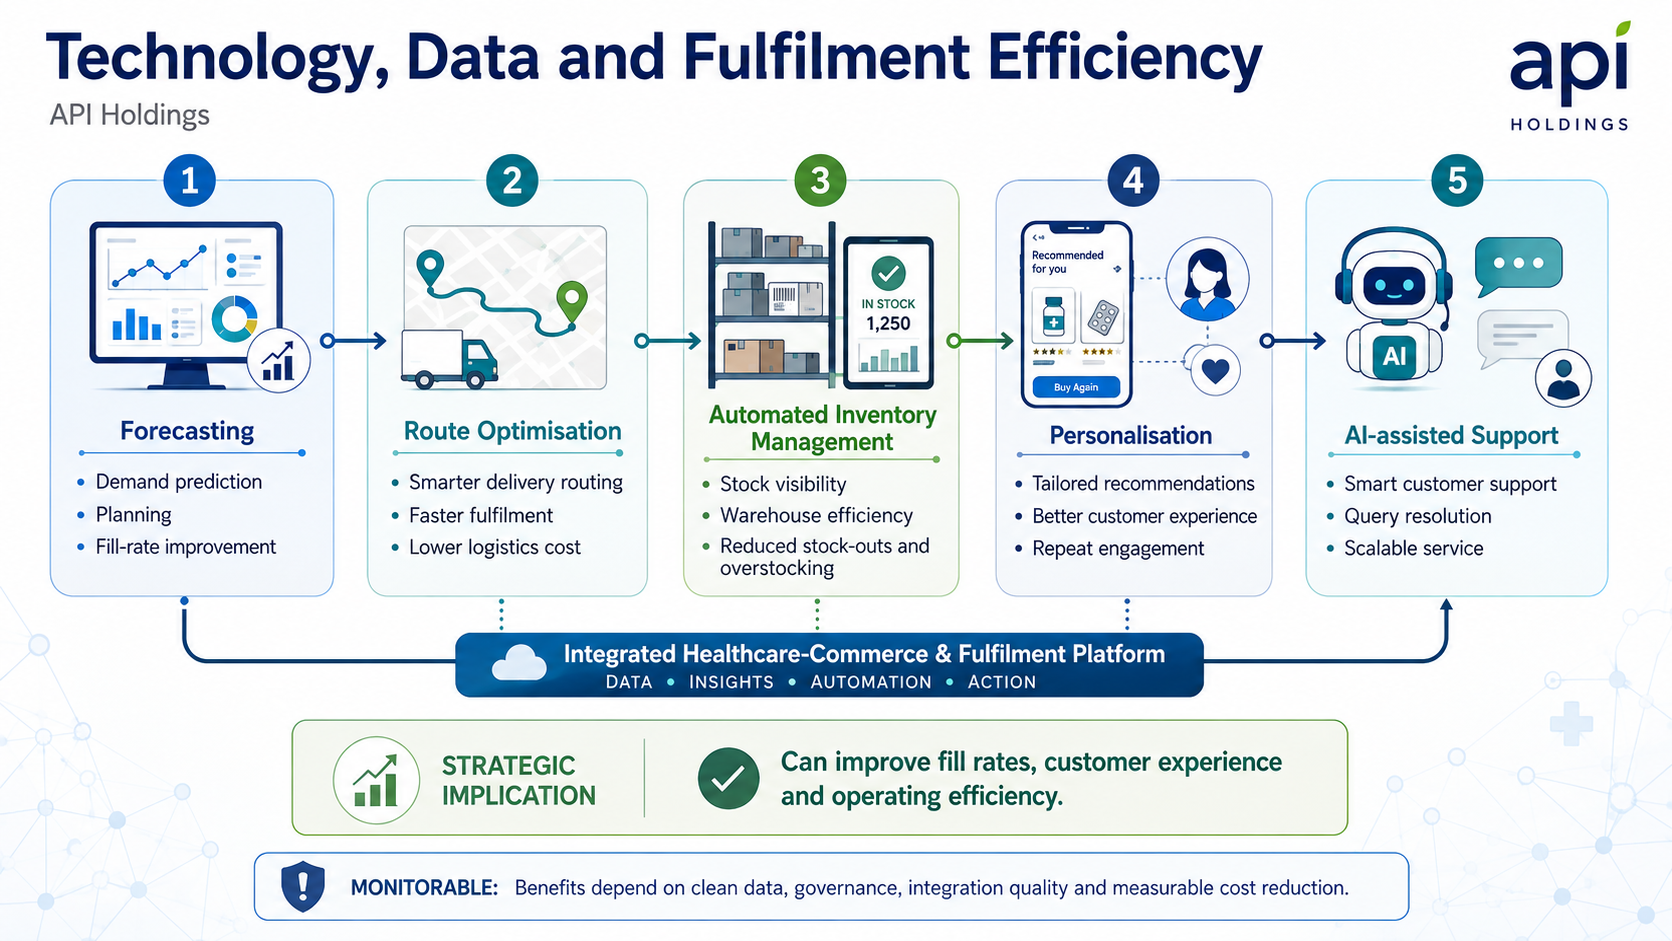
Technology, Data and Fulfilment Efficiency
Forecasting, route optimisation, automated inventory management, personalisation and AI-assisted support can improve fill rates and customer experience
Benefits depend on clean data, governance, integration quality and measurable cost reduction
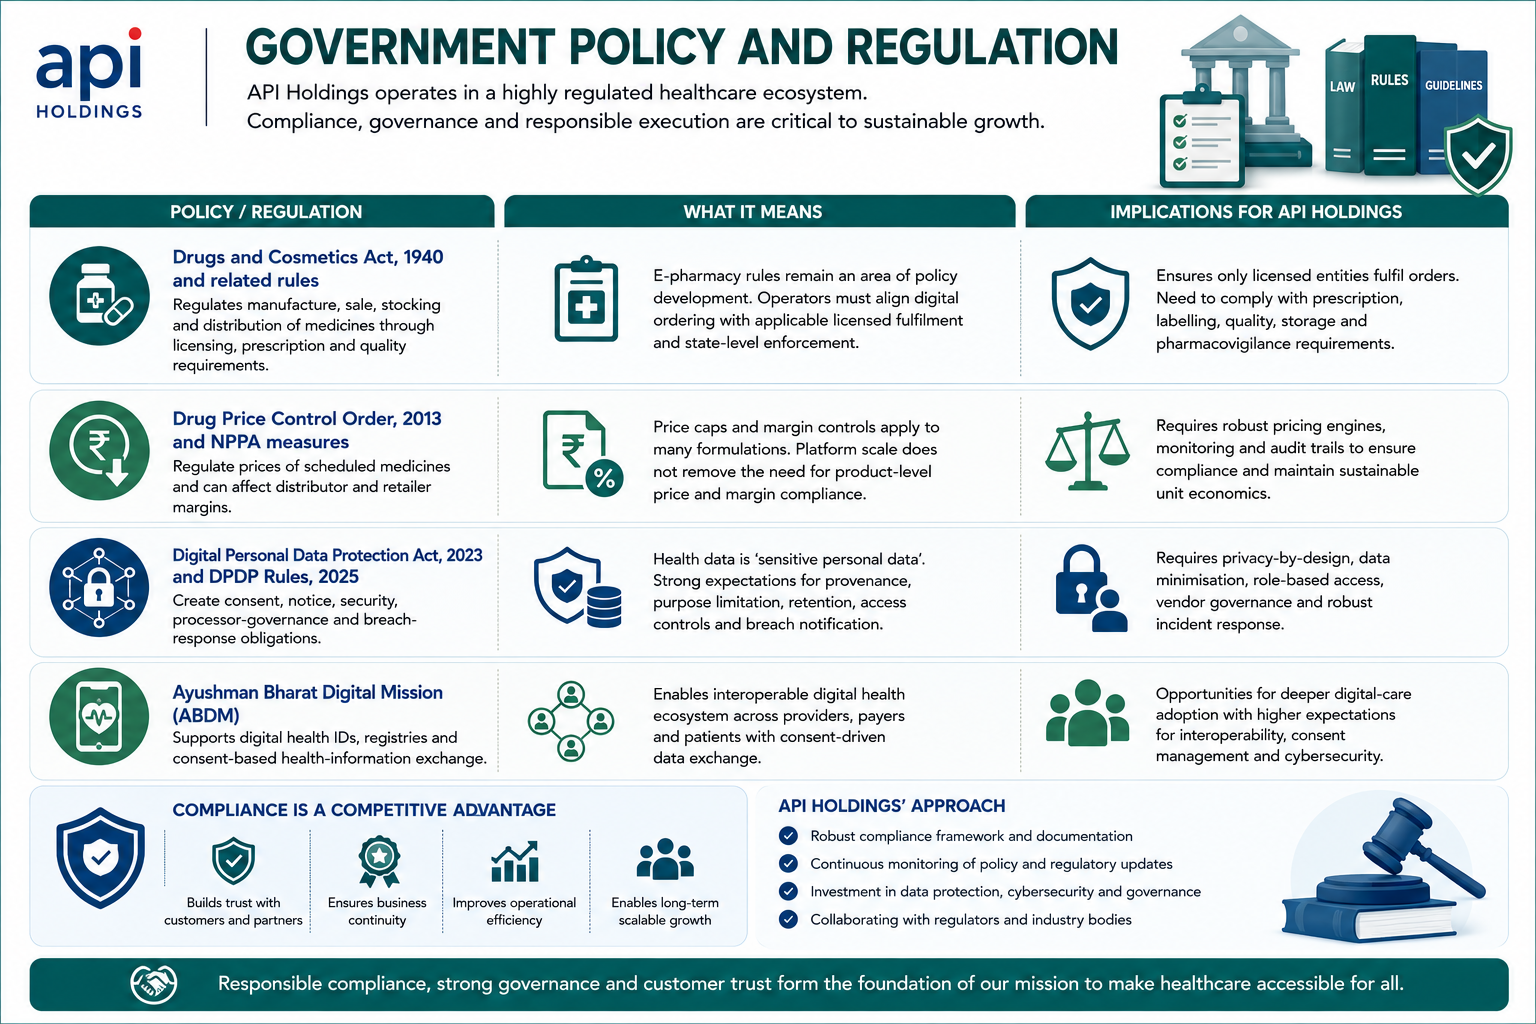
Government Policy Support
The Drugs and Cosmetics Act, 1940 and related rules regulate manufacture, sale, stocking and distribution of medicines through licensing, prescription and quality requirements. E-pharmacy rules have remained an area of policy development, so operators must align digital ordering with applicable licensed fulfilment and state-level enforcement
The Drug Price Control Order, 2013 and National Pharmaceutical Pricing Authority measures regulate prices of scheduled medicines and can affect distributor and retailer margins. Platform scale does not remove the need for product-level price and margin compliance
The Digital Personal Data Protection Act, 2023 and the Digital Personal Data Protection Rules, 2025 create consent, notice, security, processor-governance and breach-response obligations. Health-data handling requires especially strong provenance, access and retention controls
The Ayushman Bharat Digital Mission supports digital health IDs, registries and consent-based health-information exchange. It can deepen digital-care adoption but also raises interoperability, consent and cybersecurity expectations for private platforms
Fundraise/Future Plans
Shareholding
Pre-issue shareholding
Promoter Holding 0.0%
Category
Pre-Issue%
Promoters
0.0%
Total Promoter Holding
0.0%
Additional Shareholders
0.0%
Total Additional Holding
0.0%
Total Shareholding
0.0%
- Overview
- Business
- Financial Highlights
- Industry Overview
- Fundraise/Future Plans
- Documentation
Get the Preqt App and keep in touch around the clock!
 Monitor your investments in real-time.
- Receive tailored deal suggestions.
- Get real-time updates and alerts.
