

Pranav Constructions
Redeveloping for TomorrowHomes Built with Trust
IPO Summary (Pre-QT)
Pranav Constructions Limited is a Mumbai-focused pure-play residential redeveloper, with a leading supply position in MCGM redevelopment projects across the Western Suburbs. The Company follows an asset-light model by entering into redevelopment agreements with co-operative housing societies instead of acquiring land outright, while retaining in-house capabilities across tendering, design, approvals, construction management and sales. FY24-FY26 revenue from operations increased from INR 447.5 Cr to INR 761.6 Cr, while EBITDA margin expanded from 13.4% to 17.2% and PAT reached INR 71.3 Cr. The key financial counterweight is cash conversion: operating cash flow was negative in FY25 and FY26 as project-related current assets and inventory absorbed cash, while gross debt increased to INR 265.6 Cr. The IPO is predominantly primary capital, with a fresh issue of up to INR 315.6 Cr and an OFS by BioUrja India Infra Private Limited; at the final price band, the FY26 P/E is approximately 14.4x-15.2x. The investment case therefore rests on redevelopment pipeline depth, fast sales velocity and margin improvement, balanced against Mumbai concentration, approval/society execution risk and working-capital intensity.
IPO Review Rating
Above Avg
MainboardTransforming Established Communities into Better Contemporary Living Spaces
Pranav Constructions has delivered strong financial growth, with Revenue increasing from INR 447.5 Cr in FY24 to INR 761.6 Cr in FY26, representing a 30.5% CAGR. EBITDA increased to INR 130.8 Cr, with Margin expanding to 17.2%, while PAT reached INR 71.3 Cr and FY26 ROE remained high at 33.8%. The principal financial weakness is cash conversion, with OCF remaining negative at INR 92.6 Cr in FY25 and INR 41.2 Cr in FY26 despite positive reported earnings. Industry positioning is a major strength: Pranav ranks 1st in MCGM redevelopment supply during CY21–Q1 CY26 and operates in a Western Suburbs redevelopment market that has expanded sharply post-Covid. Management quality is supported by 22 years of promoter experience, 50.0% Board independence, zero promoter pledge and declining RPT exposure to 4.3% of FY26 Revenue. Governance is broadly adequate, although personal litigation involving the Promoter and another Director remains a monitorable. The 89.9% Fresh Issue structure is constructive, with INR 145.7 Cr earmarked for redevelopment expenditure and INR 91.5 Cr for debt repayment, while promoters are not monetising through the IPO. Overall, Pranav presents a strong growth and redevelopment-market leadership proposition with attractive earnings valuation, but negative operating cash flow, regulatory execution and working-capital intensity remain the key factors to monitor post listing.
PARAMETER
WEIGHT
SCORE
KEY FACTORS
Financial Performance
40.0%
4.0/5
The Company has demonstrated strong financial growth, with Revenue increasing from INR 447.5 Cr in FY24 to INR 761.6 Cr in FY26, EBITDA Margin expanding to 17.2% and ROE remaining high at 33.8%.
Show more
Detailed Analysis
Revenue increased from INR 447.5 Cr in FY24 to INR 636.3 Cr in FY25 and INR 761.6 Cr in FY26, representing a strong FY24–FY26 CAGR of 30.5%
EBITDA increased from INR 59.7 Cr in FY24 to INR 98.5 Cr in FY25 and INR 130.8 Cr in FY26, while EBITDA Margin expanded from 13.4% to 15.5% and 17.2%, respectively
PAT increased from INR 39.6 Cr in FY24 to INR 62.3 Cr in FY25 and INR 71.3 Cr in FY26, while PAT Margin stood at 8.9%, 9.8% and 9.4%, respectively
Total Debt increased from INR 104.3 Cr in FY24 to INR 201.6 Cr in FY25 and INR 265.6 Cr in FY26, while D/E remained broadly stable at 1.2x, 1.2x and 1.1x
ROE remained very strong despite moderation, declining from 64.9% in FY24 to 47.2% in FY25 and 33.8% in FY26
OCF deteriorated from positive INR 5.5 Cr in FY24 to negative INR 92.6 Cr in FY25 and negative INR 41.2 Cr in FY26
Industry
15.0%
3.0/5
Pranav operates in a rapidly expanding redevelopment segment within Mumbai, with Western Suburbs launch supply having grown sharply since CY21 and Q1 CY26 activity already approaching full-year CY25 levels.
Show more
Detailed Analysis
Western Suburbs redevelopment launches increased from approximately 970 units in CY21 to 4,881 units in CY25, implying a ~49.8% launch-supply CAGR; Q1 CY26 alone recorded 4,546 units
Approximately 94.0% of Western Suburbs redevelopment supply launched since CY17 was launched during CY21–Q1 CY26, indicating a strong post-Covid expansion phase
In seven core micro-markets, Pranav has approximately 5.0% supply share, while the Top-5 developers collectively account for only 15.0%
Redevelopment requires RERA, MCGM/DCPR approvals, additional FSI approvals, society agreements and multiple statutory clearances
Management
15.0%
4.0/5
Pranav Constructions has a strong promoter and operating-management profile, led by a promoter with 22 years of real-estate experience and backed by experienced construction and architecture professionals.
Show more
Detailed Analysis
Chairman & MD Pranav Kiran Ashar has 22 years of real-estate experience and has been on the Board since 2003
Board comprises 10 Directors, including 5 Independent Directors, resulting in exactly 50.0% independence
0 promoter shares are pledged, although personal criminal proceedings involving the Promoter and another Director are disclosed
Aggregate absolute RPTs reduced to 4.3% of FY26 Revenue, from 11.3% in FY25 and 53.4% in FY24
89.9% of the IPO is Fresh Issue; the 10.1% OFS is by investor BioUrja India Infra, not the operating Promoters
Valuation
20.0%
4.0/5
At INR 124.0, Pranav is valued at approximately 19.6x P/E, 4.4x P/B and 12.6x EV/EBITDA. The P/E is substantially below the RHP peer set, although the stated 113.5x peer average is distorted by Arkade's 482.6x multiple.
Show more
Detailed Analysis
At INR 124.0, Pranav trades at 19.6x FY26 EPS of INR 8.2, representing an 82.7% discount to the RHP peer-average P/E of 113.5x
Pranav's indicative EV/EBITDA is 12.6x versus a selected current MMR-focused peer average of approximately 15.7x, giving a peer/issuer ratio of 1.2x
Price of INR 124.0 against FY26 NAV of INR 28.3 implies approximately 4.4x P/B
RoNW remained high at 33.8% in FY26, compared with 47.2% in FY25 and 64.9% in FY24
Merchant Banker Track Record
10.0%
3.0/5
The BRLM profile is adequate rather than a major strength. Across the 4 disclosed recent IPO observations, average listing-day performance is only approximately 1.0%, with a 50.0% positive-listing success rate.
Show more
Detailed Analysis
Across 4 disclosed IPO observations, average opening return was approximately 1.0%, with two positive and two negative listings
The four comparable IPOs were subscribed approximately 9.5x, 1.5x, 124.8x and 4.6x, giving an average of 35.1x
2 of 4 disclosed IPOs opened above issue price, resulting in a 50.0% positive-listing rate
Centrum and PNBIS are established merchant-banking institutions, but their recent disclosed IPO cohort is relatively limited
TOTAL
100%
3.8/5
Weighted Composite Score
Issue Price
₹118.0 to ₹124.0
As of 4 Sep 2026
GMP
₹27.0
As of 4 Sep 2026
Estimated Gain / Loss
+21.8%
Lot Size
120.0 Shares
Grey Market Premium (GMPs) are shared for knowledge purpose only. PrEqt doesn’t promote or execute the trades.
| Issue size | |
|---|---|
| Overall | ₹351.0 Cr |
| Fresh Issue | ₹316.0 Cr |
| Offer for Sale | ₹35.0 Cr |
Minimum Investment
₹14,880.0 / 14,400 shares

Merchant Banker
Centrum Capital Ltd.; PNB Investment Services Limited
IPO Document
RHP / Anchor Document
Offer Start Date
7th Sept 2026
Offer End Date
9th Sept 2026
Valuation
₹1,396.5 Cr
Revenue (FY'26)
₹763.9 Cr
PAT (FY'26)
₹71.3 Cr
Issue Size
₹351.0 Cr
Face Value
₹ 10.0Offer Price
₹ 124.0Lot Size
120.0 sharesSale Type
Fresh capital cum OFSPAT (FY'26)
₹ 71.3 CrPAT Margin (FY'26)
9.4 %P/E Multiple
19.6xEBITDA (FY'26)
₹ 130.8 CrCAGR Growth 3Y
30.3 %ROE (FY'26)
33.8 %ROCE (FY'26)
24.3 %Price to Book Value
4.4xDebt/Equity
1.1xCompany Website
www.pranavconstructions.comExplore new deals
Overview
Fund Allocation
Total: ₹0 CrSource:Company DRHP
Timeline
IPO Open Date
To Be Announced
IPO Close Date
To Be Announced
Tentative Allotment
To Be Announced
Initiation of Refunds
To Be Announced
Credit of Shares to Demat
To Be Announced
Tentative Listing Date
To Be Announced
Business
Business Model
Geographical Presence
Sales Channel
Key Risk Factor
Financial Highlights
Income Statement
Revenue growth with EBITDA and PAT margins
| Financial Metric | FY 2024 | FY 2025 | FY 2026 |
|---|---|---|---|
| Revenue (₹ Cr) | 449.8 | 638.2 | 763.9 |
| Growth (%) | - | 42.2% | 19.7% |
| EBITDA (₹ Cr) | 59.7 | 98.5 | 130.8 |
| EBITDA Margin (%) | 13.4% | 15.5% | 17.2% |
| PAT (₹ Cr) | 39.6 | 62.3 | 71.3 |
| PAT Margin (%) | 8.9% | 9.8% | 9.4% |
OBSERVATIONS & INSIGHTS
Revenue increased from INR 447.5 Cr in FY24 to INR 761.6 Cr in FY26, a two-year CAGR of about 30.5%, reflecting higher construction progress and a larger active redevelopment portfolio
EBITDA rose 65.0% in FY25 and 32.8% in FY26, faster than revenue in both years, indicating stronger operating contribution from project execution
PAT grew 57.1% in FY25 and 14.6% in FY26; FY26 growth slowed relative to EBITDA because finance costs and tax expense increased
Balance Sheet
| Financial Metric | FY 2024 | FY 2025 | FY 2026 |
|---|---|---|---|
| Net Worth | ₹ 88.4 Cr | ₹ 175.6 Cr | ₹ 246.7 Cr |
| Total Assets | ₹ 966.8 Cr | ₹ 1,246.3 Cr | ₹ 1,799.2 Cr |
| Total Borrowing | ₹ 99.3 Cr | ₹ 196.5 Cr | ₹ 258.4 Cr |
| Reserves & Surplus | ₹ 84.7 Cr | ₹ 88.4 Cr | ₹ 159.5 Cr |
OBSERVATIONS & INSIGHTS
Total equity increased from INR 88.4 Cr in FY24 to INR 246.7 Cr in FY26 through capital/restructuring and retained profits, supporting the gradual improvement in D/E
Total assets expanded 44.4% in FY26 to INR 1,799.2 Cr, substantially faster than revenue, reflecting the capital tied to a larger redevelopment pipeline
Borrowings current and non-current borrowings increased to INR 258.4 Cr in FY26 as the Company financed a larger construction and redevelopment pipeline
Cash Flow
| Financial Metric | FY 2024 | FY 2025 | FY 2026 |
|---|---|---|---|
CFO in Cr Cash generated from core business operations. | +5.5 Cr | -92.6 Cr | -41.2 Cr |
CFI in Cr Cash used in / generated from investing activities. | +19.8 Cr | -0.7 Cr | -5.3 Cr |
CFF in Cr Cash from / used in financing activities. | +0.6 Cr | +94.2 Cr | +24.6 Cr |
Working Capital
| Efficiency Metric | FY 2023 | FY 2024 | FY 2025 |
|---|---|---|---|
Debtor Days Average number of days taken to collect customer payments. | - | - | - |
Creditor Days Average time taken to pay suppliers and vendors. | - | - | - |
Inventory Days Average number of days inventory remains unsold. | - | - | - |
CCC (Cash Conversion Cycle) (Debtor Days + Inventory Days - Creditor Days) | - | - | - |
Financial Ratios
Measures the company’s leverage relative to shareholder equity.
OBSERVATIONS & INSIGHTS
ROE declined to 33.8% in FY26 because average equity expanded faster than PAT as retained earnings and equity capital strengthened the net-worth base
Debt / Equity improved gradually from 1.2x to 1.1x despite higher absolute debt because equity increased from INR 88.4 Cr to INR 246.7 Cr.
Interest Coverage improved from 3.2x in FY24 to 4.1x in FY25, then moderated to 3.9x in FY26 as finance costs rose faster than EBIT
Current Ratio improved to 1.2x in FY25 and remained stable in FY26, indicating adequate current-asset cover but with assets heavily tied to project-related balances
ROA rose to 5.0% in FY25 but fell to 4.0% in FY26 because total assets grew about 44% while PAT increased about 15%
ROCE moderated from 28.6% to 24.3% as the capital employed in the larger project pipeline expanded faster than operating returns
Industry Overview
Industry Drivers
MMR Scale, Absorption and Residential Demand
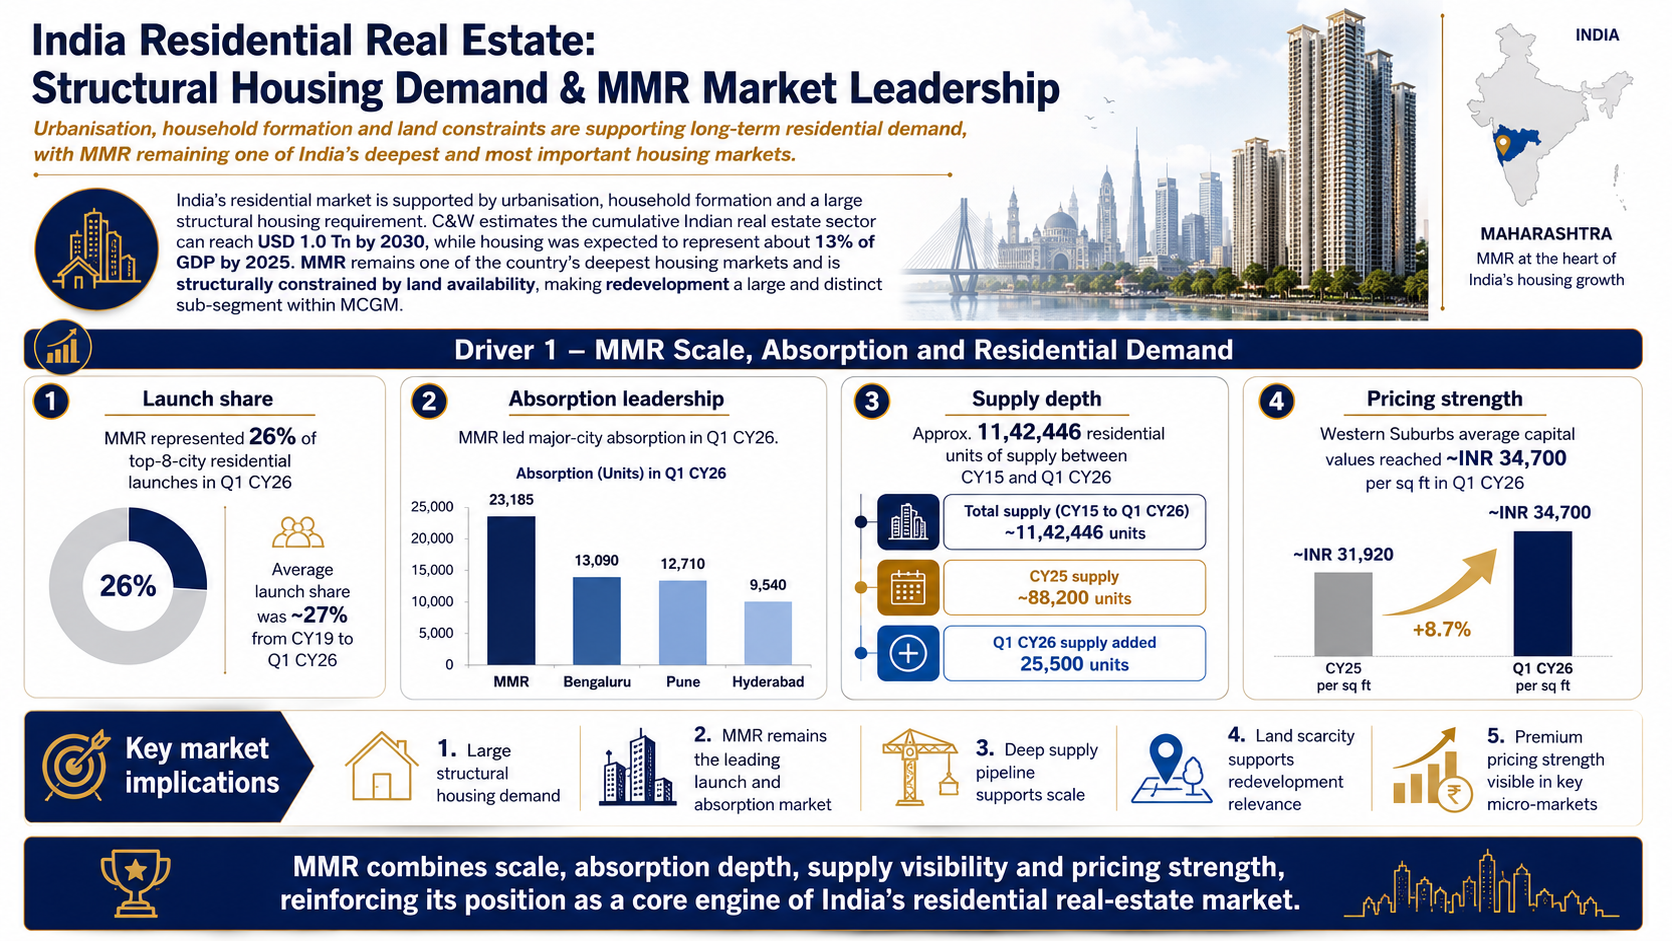
MMR combines high absolute sales volumes with sustained launch share across India's major cities. Demand has remained strongest in aspirational and premium categories, while MMR continued to lead new launches despite some moderation in CY25.
The key drivers are:
Launch share: MMR represented 26% of top-8-city residential launches in Q1 CY26 and averaged about 27% between CY19 and Q1 CY26
Absorption: Q1 CY26 absorption was about 23,185 units in MMR, ahead of Pune at 12,710, Bengaluru at 13,090 and Hyderabad at 9,540 units
Supply depth: MMR recorded approximately 11,42,446 residential units of supply between CY15 and Q1 CY26; CY25 supply was about 88,200 units and Q1 CY26 added 25,500 units
Pricing: Western Suburbs average capital values reached about INR 34,700 per sq ft on carpet area in Q1 CY26, versus about INR 31,920 in CY25
Structural Shift Toward Redevelopment in Mumbai
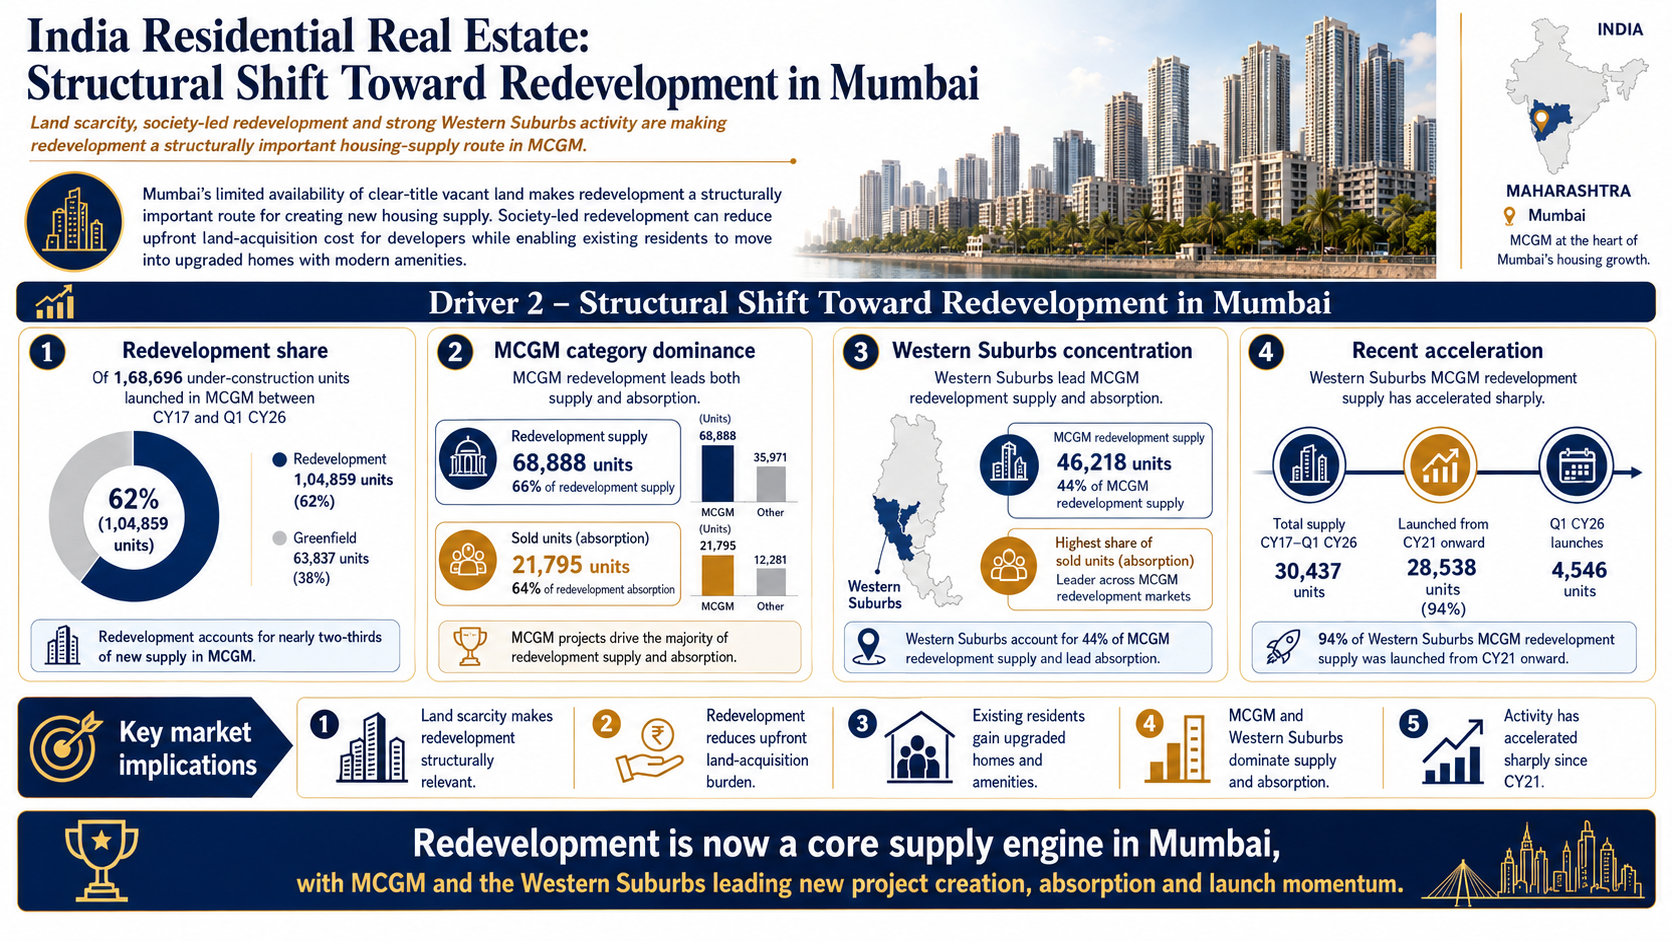
Mumbai's limited availability of clear-title vacant land makes redevelopment a structurally important route for creating new housing supply. Society-led redevelopment can also reduce upfront land acquisition cost for developers while providing existing residents with upgraded housing and amenities.
The key drivers:
Redevelopment share: Of 1,68,696 under-construction units launched in MCGM between CY17 and Q1 CY26, redevelopment represented 62% or 1,04,859 units versus 38% greenfield supply
MCGM category dominance: MCGM-redevelopment projects represented 68,888 units, or 66% of redevelopment supply, and 21,795 sold units, or 64% of redevelopment absorption
Western Suburbs concentration: Western Suburbs accounted for 44% of MCGM redevelopment supply, with 46,218 units, and the highest share of sold units
Recent acceleration: Western Suburbs MCGM-redevelopment supply reached about 30,437 units from CY17-Q1 CY26; 94% was launched from CY21 onward, while Q1 CY26 alone recorded about 4,546 launches
Mid-market Product Depth and Premiumisation
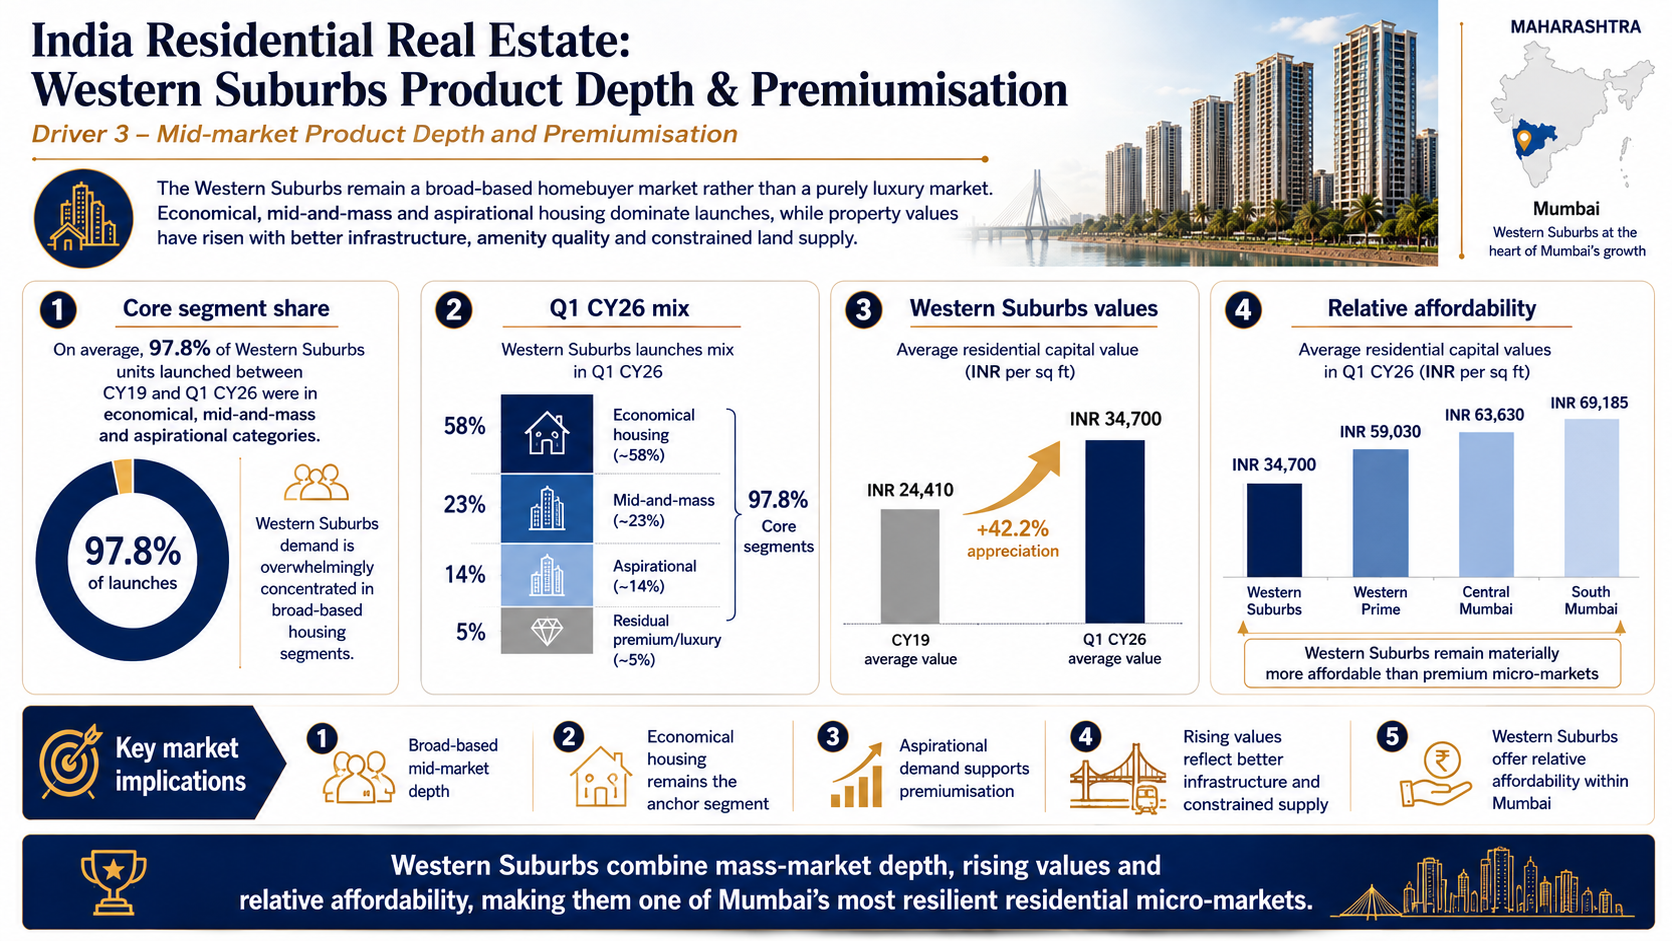
The Western Suburbs remain a broad-based homebuyer market rather than a purely luxury market. Economical, mid-and-mass and aspirational housing dominates launches, while property values have risen with better infrastructure, amenity quality and constrained land supply.
The key drivers are:
Core segment share: On average, 97.8% of Western Suburbs units launched between CY19 and Q1 CY26 were in economical, mid-and-mass and aspirational categories
Q1 CY26 mix: Economical housing contributed about 58% of Q1 CY26 Western Suburbs launches, followed by mid-and-mass at 23% and aspirational at 14%
Western Suburbs values: Average residential capital value increased from about INR 24,410 per sq ft in CY19 to INR 34,700 per sq ft in Q1 CY26
Relative affordability: Q1 CY26 Western Suburbs values of INR 34,700 per sq ft remained materially below South Mumbai at INR 69,185, Central Mumbai at INR 63,630 and Western Prime at INR 59,030.
Risks in the Industry
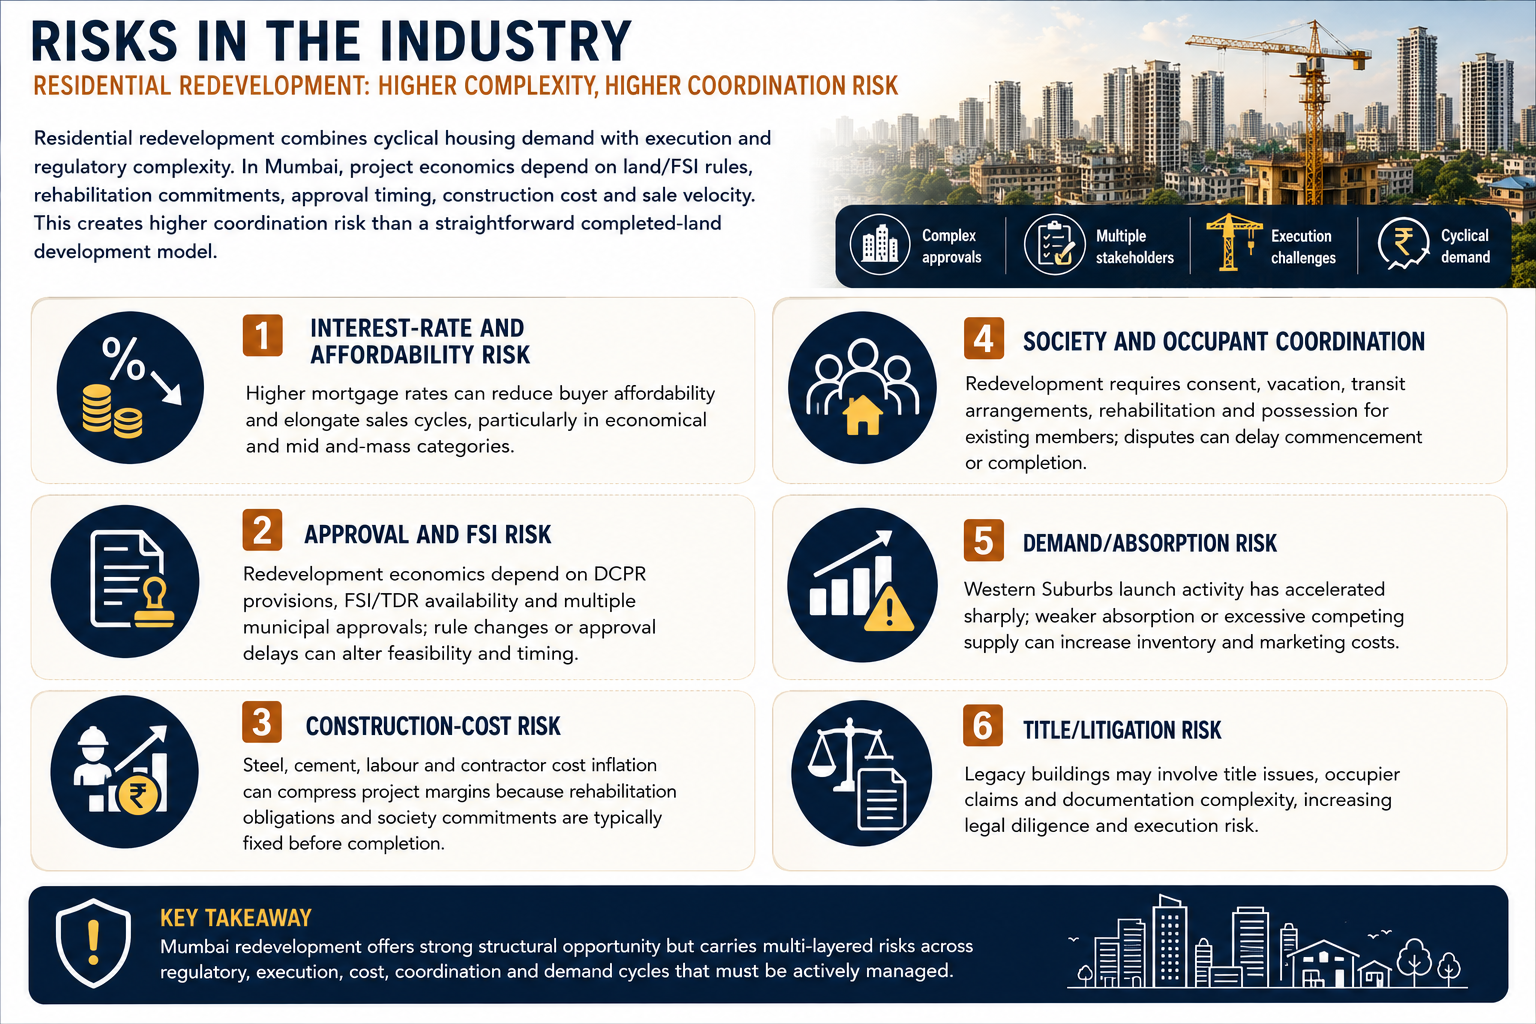
Residential redevelopment combines cyclical housing demand with execution and regulatory complexity. In Mumbai, project economics depend on land/FSI rules, rehabilitation commitments, approval timing, construction cost and sale velocity. This creates higher coordination risk than a straightforward completed-land development model.
The key risks are:
Higher mortgage rates can reduce buyer affordability and elongate sales cycles, particularly in economical and mid and-mass categories
Redevelopment economics depend on DCPR provisions, FSI/TDR availability and multiple municipal approvals; rule changes or approval delays can alter feasibility and timing
Steel, cement, labour and contractor cost inflation can compress project margins because rehabilitation obligations and society commitments are typically fixed before completion
Redevelopment requires consent, vacation, transit arrangements, rehabilitation and possession for existing members; disputes can delay commencement or completion
Western Suburbs launch activity has accelerated sharply; weaker absorption or excessive competing supply can increase inventory and marketing costs
Legacy buildings may involve title issues, occupier claims and documentation complexity, increasing legal diligence and execution risk
Government Policy Support
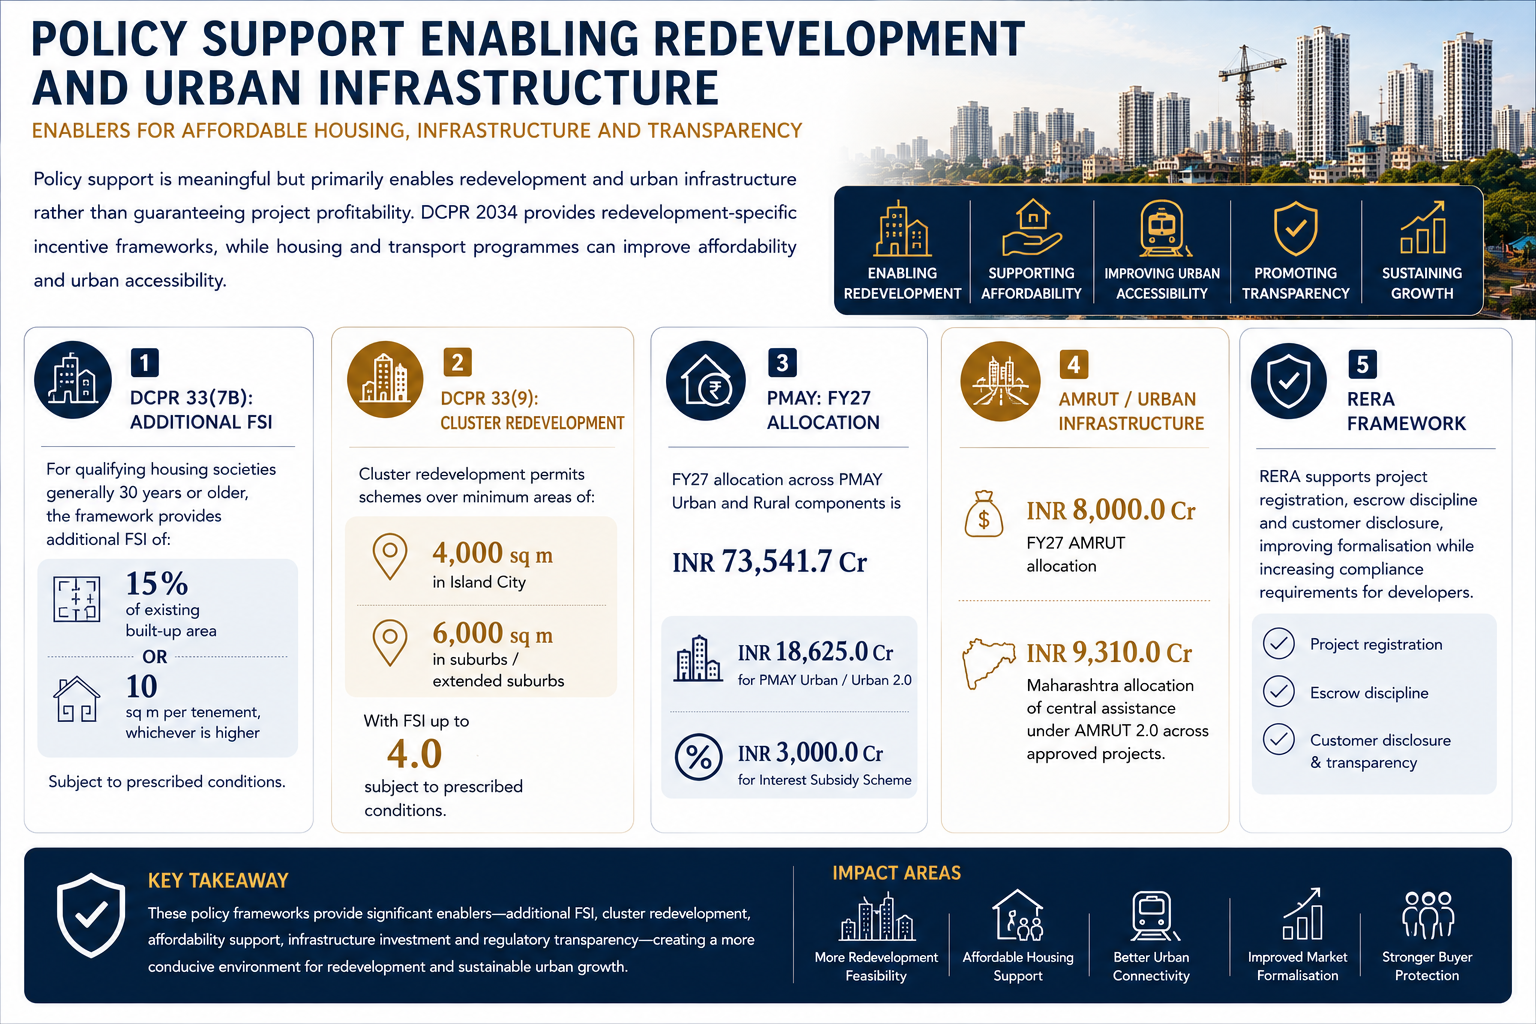
Policy support is meaningful but primarily enables redevelopment and urban infrastructure rather than guaranteeing project profitability. DCPR 2034 provides redevelopment-specific incentive frameworks, while housing and transport programmes can improve affordability and urban accessibility.
The key policies are:
DCPR 33(7B): For qualifying housing societies generally 30 years or older, the framework provides additional FSI of 15% of existing built-up area or 10 sq m per tenement, whichever is higher, subject to conditions
DCPR 33(9): Cluster redevelopment permits schemes over minimum areas of 4,000 sq m in Island City and 6,000 sq m in suburbs/extended suburbs, with FSI up to 4.0 subject to prescribed conditions
PMAY: FY27 allocation across PMAY urban and rural components is INR 73,541.7 Cr, including INR 18,625.0 Cr for PMAY Urban / Urban 2.0; the Interest Subsidy Scheme received INR 3,000.0 Cr.
AMRUT / urban infrastructure: FY27 AMRUT allocation is INR 8,000.0 Cr; Maharashtra has been allocated INR 9,310.0 Cr of central assistance under AMRUT 2.0 across approved projects
RERA framework: RERA supports project registration, escrow discipline and customer disclosure, improving formalisation while increasing compliance requirements for developers
Fundraise/Future Plans
Shareholding
Pre-issue shareholding
Promoter Holding 0.0%
Post-Issue Shareholding
Promoter Holding 0.0%
Category
Pre-Issue%Post-Issue%
Promoters
Pranav Kiran Ashar
46.5%36.0%
Ravi Ramalingam
16.9%13.1%
Nine Realms Trust
0.0%0.0%
Total Promoter Holding
63.4%49.1%
Additional Shareholders
RiverCrest India Infrastructure Pvt Ltd
27.1%21.0%
BioUrja India Infra Pvt Ltd
4.4%0.8%
Jitendra Kantilal Shah
2.2%1.7%
Total Additional Holding
33.7%23.5%
Total Shareholding
97.1%72.6%
- Overview
- Business
- Financial Highlights
- Industry Overview
- Fundraise/Future Plans
- Documentation
Get the Preqt App and keep in touch around the clock!
 Monitor your investments in real-time.
- Receive tailored deal suggestions.
- Get real-time updates and alerts.
