


Prasol Chemicals
Chemistry That PerformsEngineering Specialty Chemistry
IPO Summary (PrEqT)
Prasol Chemicals Limited is a 33-year specialty chemicals manufacturer with a diversified portfolio spanning acetone-based, phosphorus-based and other specialty chemistries. The Company serves more than 1,600 customers and has a broad international footprint, while its product applications span performance chemicals, paints/inks/construction/adhesives, pharmaceuticals, agrochemicals and home & personal care. FY24-FY26 financial performance improved sharply: revenue grew at an 18.6% CAGR, Operating EBITDA margin expanded from 6.9% to 11.3%, and PAT increased from INR 18.1 Cr to INR 83.1 Cr. The balance sheet is moderately leveraged, with FY26 net debt/equity of 0.2x and current ratio of about 1.5x. The key financial watch-point is cash conversion: trade receivables rose materially in FY26 and operating working capital expanded faster than revenue, although operating cash flow remained positive. At the IPO cap price of INR 676, the P/E is about 48.1x below the RHP arithmetic peer average of 61.7x, which is distorted by Yasho Industries' high multiple. Transaction quality is mixed because about 84% of the INR 500.0 Cr offer is OFS and only INR 80.0 Cr is fresh capital.
IPO Review Rating
Average
MainboardPowering Industrial Growth Through Advanced Specialty Chemical Solutions
Prasol is fundamentally stronger than the final 70.6 score may initially suggest on pure financial performance. Revenue is growing at a healthy rate, profitability has accelerated substantially, EBITDA Margin has expanded, ROE has crossed 20%, leverage is low, OCF remains positive and customer concentration is excellent. The valuation is less attractive than the P/E score makes it appear. The RHP arithmetic average produces a 23.6% apparent P/E discount, but once the extreme 206.7x Yasho multiple is recognised, Prasol's 48.1x P/E is actually below RHP arithmetic peer average of 61.7x. The approximately 29.3x EV/EBITDA and 8.7x P/B reinforce the view that the issue is priced fairly aggressively. The 84.0% OFS is unusually heavy, and the fact that promoter and promoter-group sellers represent roughly 94.4% of that OFS deserves attention. Only INR 80.0 Cr of the INR 500.0 Cr IPO is going into the Company, although INR 60.0 Cr of that is being used beneficially to reduce debt.
PARAMETER
WEIGHT
SCORE
KEY FACTORS
Financial Performance
40.0%
4.0/5
Prasol's financial profile is one of the stronger parts of the IPO. Revenue has grown at an 18.6% CAGR, while EBITDA and PAT have grown significantly faster and FY26 ROE has reached 20.4%.
Show more
Detailed Analysis
Revenue increased from INR 876.6 Cr in FY24 to INR 1,012.5 Cr in FY25 and INR 1,232.6 Cr in FY26, representing an 18.6% FY24–FY26 CAGR
Operating EBITDA increased from INR 60.5 Cr to INR 139.3 Cr, while Margin expanded from 6.9% in FY24 to 8.7% in FY25 and 11.3% in FY26
PAT increased from INR 18.1 Cr in FY24 to INR 43.6 Cr in FY25 and INR 83.1 Cr in FY26; FY26 PAT Margin was 6.7%
Net Debt/Equity was 0.2x in FY26, compared with 0.2x in FY25 and FY24
ROE improved from 5.7% in FY24 to 12.6% in FY25 and 20.4% in FY26
OCF was positive at INR 22.3 Cr in FY25 and INR 49.5 Cr in FY26
Top-3 customers collectively contributed only 11.6% of FY26 Revenue, meaning the largest individual customer was necessarily below 11.6%
Industry
15.0%
3.0/5
The specialty-chemicals backdrop is attractive, with 10–12% expected Indian market growth, China+1 opportunities, import substitution and substantial international demand.
Show more
Detailed Analysis
Indian specialty chemicals market is projected to grow at 10–12% CAGR, from approximately INR 5,046 Bn in FY25 to INR 7,474 Bn by FY29
Specialty chemicals remains in a structural growth phase driven by domestic demand, exports, import substitution and China+1 sourcing
Hazardous, corrosive and flammable chemical manufacturing is subject to environmental, factory-safety and hazardous-material regulation
Management
15.0%
3.0/5
Prasol has experienced operating leadership, 50.0% Board independence, no promoter pledge and very low RPT exposure. Those are meaningful positives. However, the governance score is pulled down sharply by multiple serious industrial-safety proceedings involving fatalities.
Show more
Detailed Analysis
Chairman Nishith Shah has approximately 36 years of chemical-industry experience; other executive promoters also have substantial operating experience
FY26 Board comprises 10 Directors, including 5 Independent Directors which means 50.0% independence
Promoter shares are not pledged, but multiple pending criminal proceedings relate to serious plant-safety incidents, including fatalities
Valuation
20.0%
3.0/5
Prasol’s valuation appears reasonable on headline P/E but demanding on broader valuation metrics. At the upper price band of INR 676, the Company is valued at approximately 47.2x FY26 earnings, which is about 23.6% below the RHP peer-average P/E of 61.7x and therefore scores well under the framework.
Show more
Detailed Analysis
At INR 676.0, Prasol trades at 48.1x P/E, versus RHP arithmetic peer average of 61.7x, a 22.0% discount
Prasol is approximately 29.3x, versus current selected peer average of approximately 19.5x; peer/issuer ratio is only ~0.7x
At INR 676.0 against FY26 NAV of INR 77.3, P/B is approximately 8.7x
FY26 RoNW is 18.5%
Merchant Banker Track Record
10.0%
4.0/5
DAM Capital is a meaningful positive in the issue. It has a large recent IPO sample and has handled substantial mainboard fundraising. The recent cohort shows a respectable 6.0% average opening gain and 70.0% positive-listing rate.
Show more
Detailed Analysis
Latest 10 disclosed issues generated an average opening return of approximately 6.0%
Same 10-issue cohort averaged approximately 38.0x subscription
7 of 10, or 70.0%, opened above their issue price
DAM has substantial recent mainboard execution and fund-raising experience
TOTAL
100%
3.5/5
Weighted Composite Score
Issue Price
₹643.0 to ₹676.0
As of 3 Sep 2026
GMP
₹14.0
As of 3 Sep 2026
Estimated Gain / Loss
+2.1%
Lot Size
22.0 Shares
Grey Market Premium (GMPs) are shared for knowledge purpose only. PrEqt doesn’t promote or execute the trades.
| Issue size | |
|---|---|
| Overall | ₹500.0 Cr |
| Fresh Issue | ₹80.0 Cr |
| Offer for Sale | ₹420.0 Cr |
Minimum Investment
₹14,872.0 / 484 shares

Merchant Banker
Dam Capital Advisors Ltd.
IPO Document
RHP / Anchor Document
Offer Start Date
8th Sept 2026
Offer End Date
10th Sept 2026
Valuation
₹4,000.8 Cr
Revenue (FY'26)
₹1,237.9 Cr
PAT (FY'26)
₹83.1 Cr
Issue Size
₹500.0 Cr
Face Value
₹ 2.0Offer Price
₹ 676.0Lot Size
22.0 sharesSale Type
Fresh capital cum OFSPAT (FY'26)
₹ 83.1 CrPAT Margin (FY'26)
6.7 %P/E Multiple
48.1xEBITDA (FY'26)
₹ 139.3 CrCAGR Growth 2Y
18.6 %ROE (FY'26)
20.4 %ROCE (FY'26)
22.4 %Price to Book Value
8.7xDebt/Equity
0.2xCompany Website
www.prasolchem.comExplore new deals
Overview
Fund Allocation
Total: ₹0 CrSource:Company DRHP
Timeline
IPO Open Date
To Be Announced
IPO Close Date
To Be Announced
Tentative Allotment
To Be Announced
Initiation of Refunds
To Be Announced
Credit of Shares to Demat
To Be Announced
Tentative Listing Date
To Be Announced
Business
Business Model
Geographical Presence
Sales Channel
Clients
Key Risk Factor
Financial Highlights
Income Statement
Revenue growth with EBITDA and PAT margins
| Financial Metric | FY 2024 | FY 2025 | FY 2026 |
|---|---|---|---|
| Revenue (₹ Cr) | 887.6 | 1,015.5 | 1,237.9 |
| Growth (%) | -5.8% | 15.5% | 21.7% |
| EBITDA (₹ Cr) | 60.5 | 87.8 | 139.3 |
| EBITDA Margin (%) | 6.9% | 8.7% | 11.3% |
| PAT (₹ Cr) | 18.1 | 43.6 | 83.1 |
| PAT Margin (%) | 2.1% | 4.3% | 6.7% |
OBSERVATIONS & INSIGHTS
Revenue from Operations increased from INR 876.6 Cr in FY24 to INR 1,232.6 Cr in FY26. FY26 growth was primarily volume-led, while FY25 growth reflected both higher sales volume and product pricing
EBITDA rose from INR 60.5 Cr to INR 139.3 Cr across FY24-FY26, materially faster than revenue as gross operating contribution improved
Profit After Tax reached INR 83.1 Cr in FY26 from INR 18.1 Cr in FY24; the increase followed the stronger PBT base, partly offset by higher current-tax expense
Balance Sheet
| Financial Metric | FY 2024 | FY 2025 | FY 2026 |
|---|---|---|---|
| Net Worth | ₹ 325.8 Cr | ₹ 367.5 Cr | ₹ 448.5 Cr |
| Total Assets | ₹ 626.4 Cr | ₹ 723.1 Cr | ₹ 839.3 Cr |
| Total Borrowing | ₹ 82.1 Cr | ₹ 101.1 Cr | ₹ 110.1 Cr |
| Reserves & Surplus | ₹ 314.2 Cr | ₹ 355.9 Cr | ₹ 436.9 Cr |
OBSERVATIONS & INSIGHTS
Total Equity rose from INR 325.8 Cr to INR 448.5 Cr, strengthening the capital base and supporting lower net leverage
Total Assets reached INR 839.3 Cr in FY26, up 34.0% from FY24, with most incremental assets concentrated in working capital and CWIP
Cash Flow
| Financial Metric | FY 2023 | FY 2024 | FY 2025 |
|---|---|---|---|
CFO (₹ Cr) Cash generated from core business operations. | +115.6 Cr | +22.3 Cr | +49.5 Cr |
CFI (₹ Cr) Cash used for investments and long-term assets. | -17.9 Cr | -22.5 Cr | -38.4 Cr |
CFF (₹ Cr) Cash flow related to funding and borrowings. | -115.1 Cr | +10.2 Cr | +0.1 Cr |
Working Capital
| Efficiency Metric | FY 2023 | FY 2024 | FY 2025 |
|---|---|---|---|
Debtor Days Average number of days taken to collect customer payments. | - | - | - |
Creditor Days Average time taken to pay suppliers and vendors. | - | - | - |
Inventory Days Average number of days inventory remains unsold. | - | - | - |
CCC (Cash Conversion Cycle) (Debtor Days + Inventory Days - Creditor Days) | - | - | - |
Financial Ratios
Measures the company’s leverage relative to shareholder equity.
OBSERVATIONS & INSIGHTS
ROE rose from 5.7% to 20.4% as the Company generated substantially higher earnings on the average shareholder-equity base
ROCE improved to 22.4% in FY26 from 12.6% in FY24 as operating returns increased faster than capital employed
Debt / Equity reduced to 0.19x from 0.22x despite higher gross borrowings because cash and equity increased faster than net debt
Current Ratio improved from 1.2x to 1.5x as current assets, especially receivables and inventory, increased faster than current liabilities
Interest Coverage: Improved from approximately 4.1x to 15.0x as EBIT increased sharply and finance costs declined from the FY24 level
ROA improved from 2.8% in FY24 to 10.6% in FY26 as PAT growth substantially outpaced growth in average total assets, indicating stronger asset productivity
Industry Overview
Industry Drivers
Indian Specialty Chemicals: Structural Growth, China+1 and Capacity Expansion
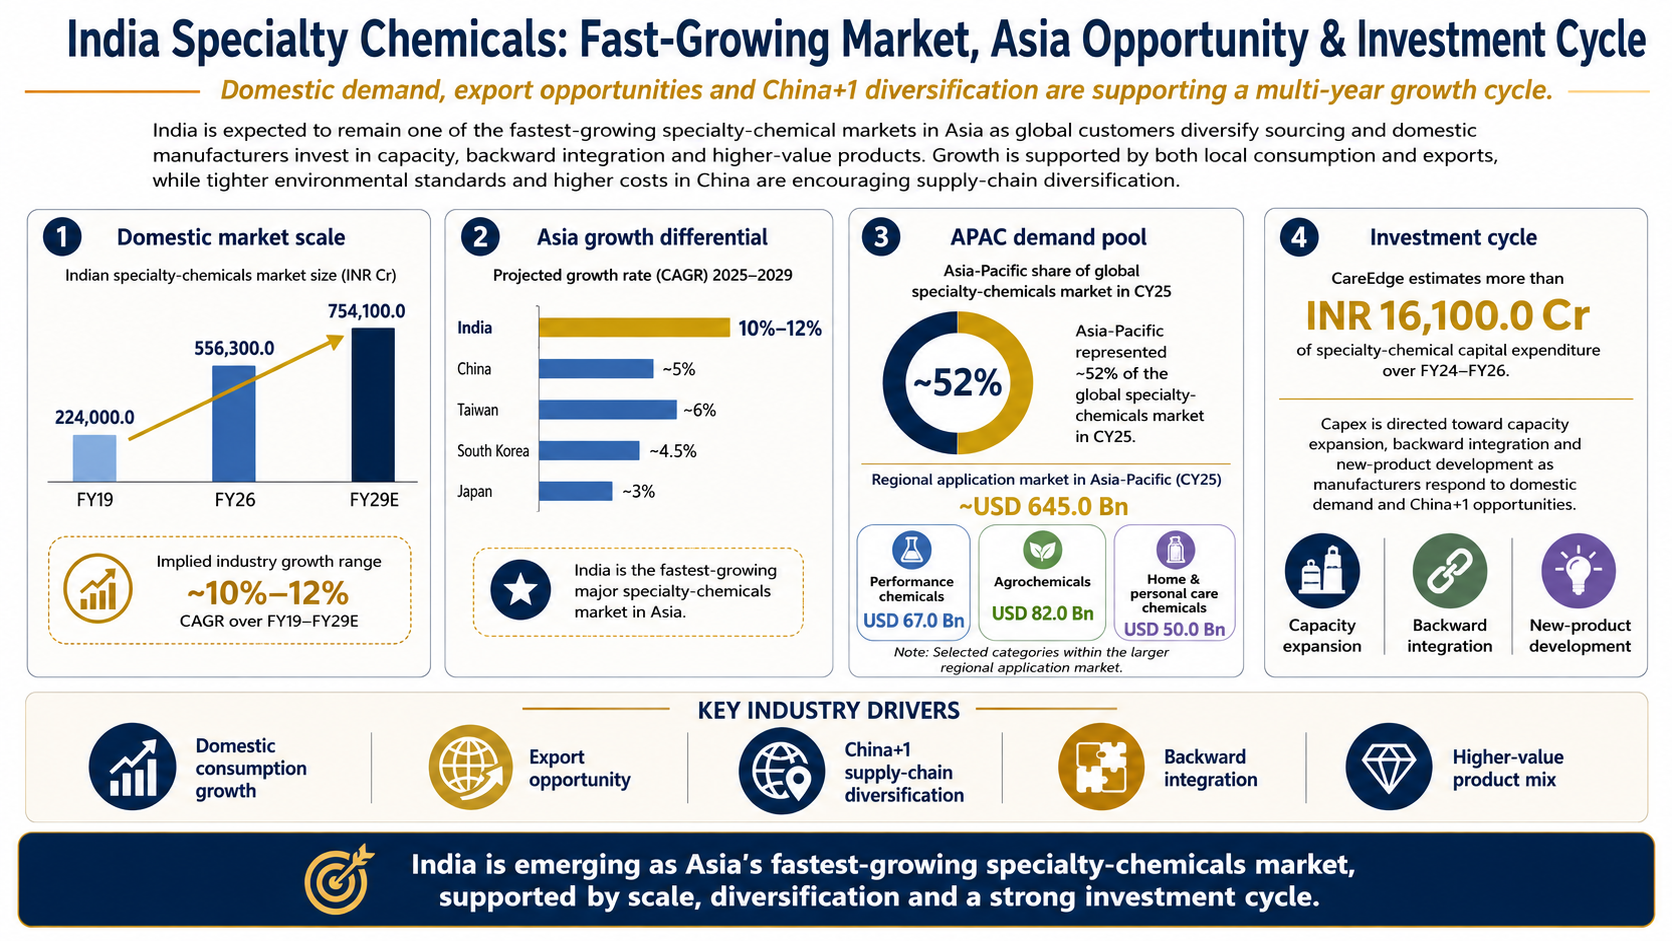
India is expected to remain one of the fastest-growing specialty-chemical markets in Asia as global customers diversify sourcing and domestic manufacturers invest in capacity, backward integration and higher-value products. Growth is being supported simultaneously by local consumption and export opportunities, while tightening environmental standards and higher costs in China continue to encourage supply-chain diversification.
The key drivers are:
Domestic market scale: The Indian specialty-chemicals market increased to approximately INR 556,300.0 Cr in FY26 from INR 224,000.0 Cr in FY19 and is projected to reach INR 754,100.0 Cr by FY29, implying an industry growth range of about 10%-12%
Asia growth differential: India is projected to grow about 10%-12% during 2025-2029 versus roughly 5% for China, 6% for Taiwan, 4.5% for South Korea and 3% for Japan, positioning India as the fastest-growing major Asian market in the source comparison
APAC demand pool: Asia-Pacific represented about 52% of the global specialty-chemicals market in CY25. The regional application market was approximately USD 645.0 Bn, including USD 67.0 Bn of performance chemicals, USD 82.0 Bn of agrochemicals and USD 50.0 Bn of home and personal care chemicals
Investment cycle: CareEdge estimates more than INR 16,100.0 Cr of specialty-chemical capital expenditure over FY24-FY26, directed toward capacity expansion, backward integration and new-product development as manufacturers respond to domestic demand and China+1 opportunities
Performance Chemicals: Broad-based Demand Across Industrial End Markets
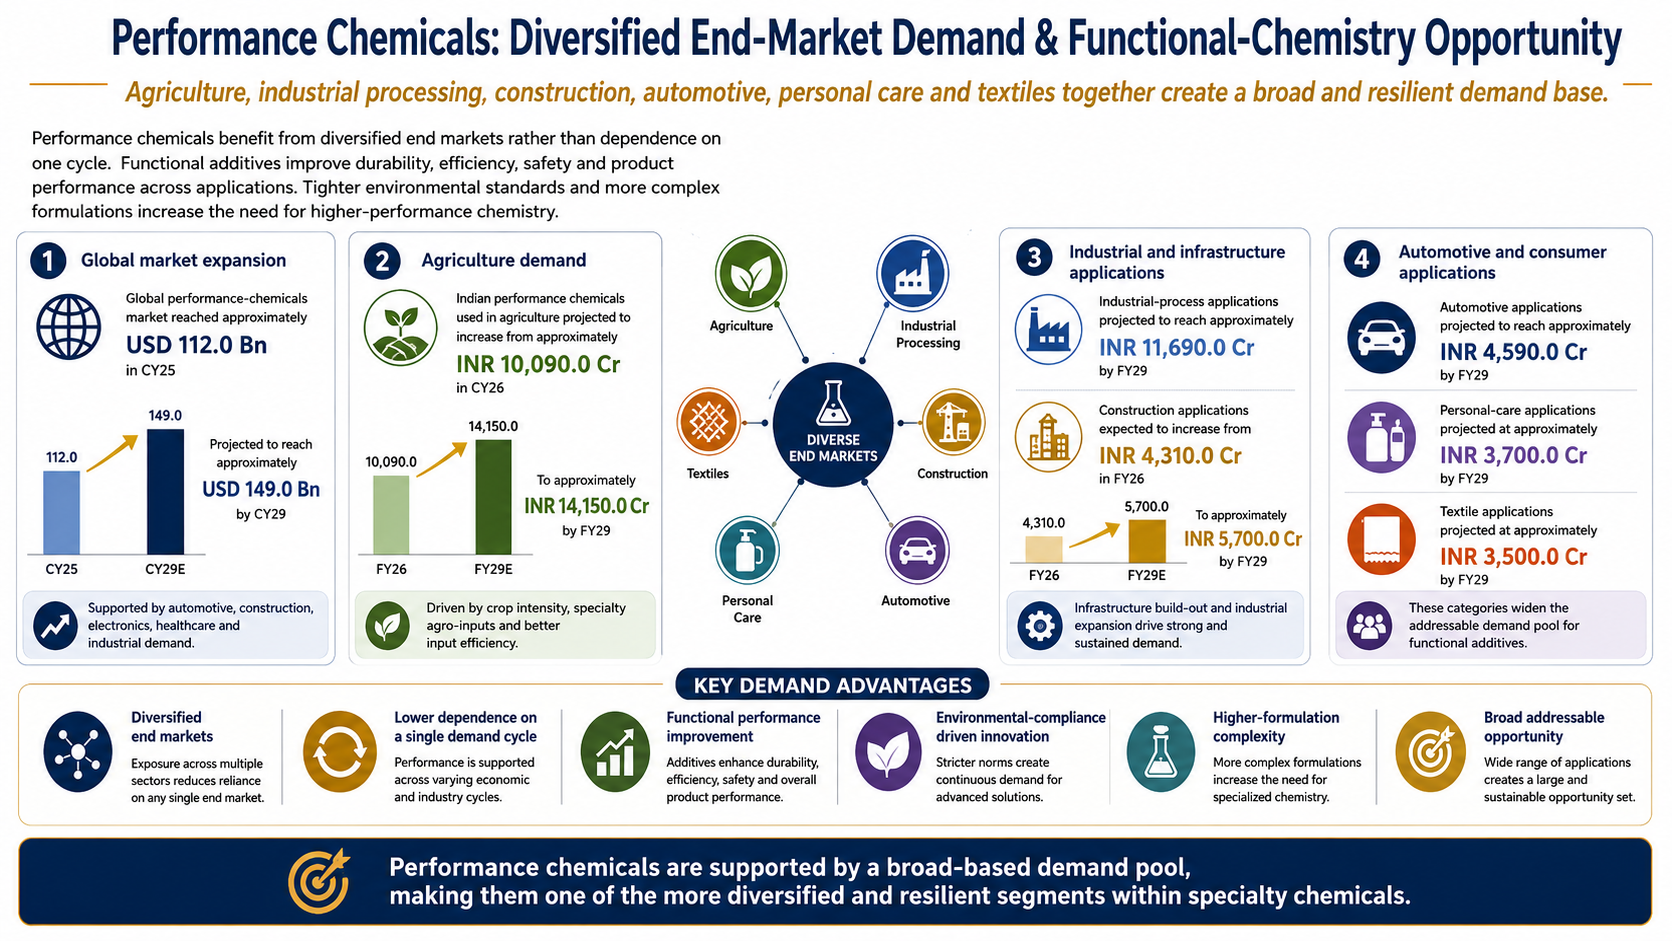
Performance chemicals benefit from a diversified demand base rather than a single end market. Agriculture, industrial processing, construction, automotive, personal care and textiles all require additives and functional chemicals that improve durability, efficiency, safety or product performance. This diversification reduces dependence on one demand cycle, while tighter environmental standards and more complex formulations increase the need for higher-performance chemistry.
The key drivers are:
Global market expansion: The global performance-chemicals market reached approximately USD 112.0 Bn in CY25 and is projected to reach USD 149.0 Bn by CY29, supported by automotive, construction, electronics, healthcare and industrial demand
Agriculture demand: Indian performance chemicals used in agriculture are projected to increase from approximately INR 10,090.0 Cr in FY26 to INR 14,150.0 Cr by FY29, supported by crop intensity, specialty agro-inputs and the need for better input efficiency
Industrial and infrastructure applications: Industrial-process applications are projected to reach approximately INR 11,690.0 Cr by FY29, while construction applications are expected to increase from about INR 4,310.0 Cr in FY26 to INR 5,700.0 Cr by FY29
Automotive and consumer applications: Automotive applications are projected to reach approximately INR 4,590.0 Cr by FY29, while personal-care and textile applications are projected at about INR 3,700.0 Cr and INR 3,500.0 Cr, respectively, widening the addressable demand pool for functional additives
Acetone Derivatives: Rising Use Across Paints, Adhesives, Pharma and Chemicals
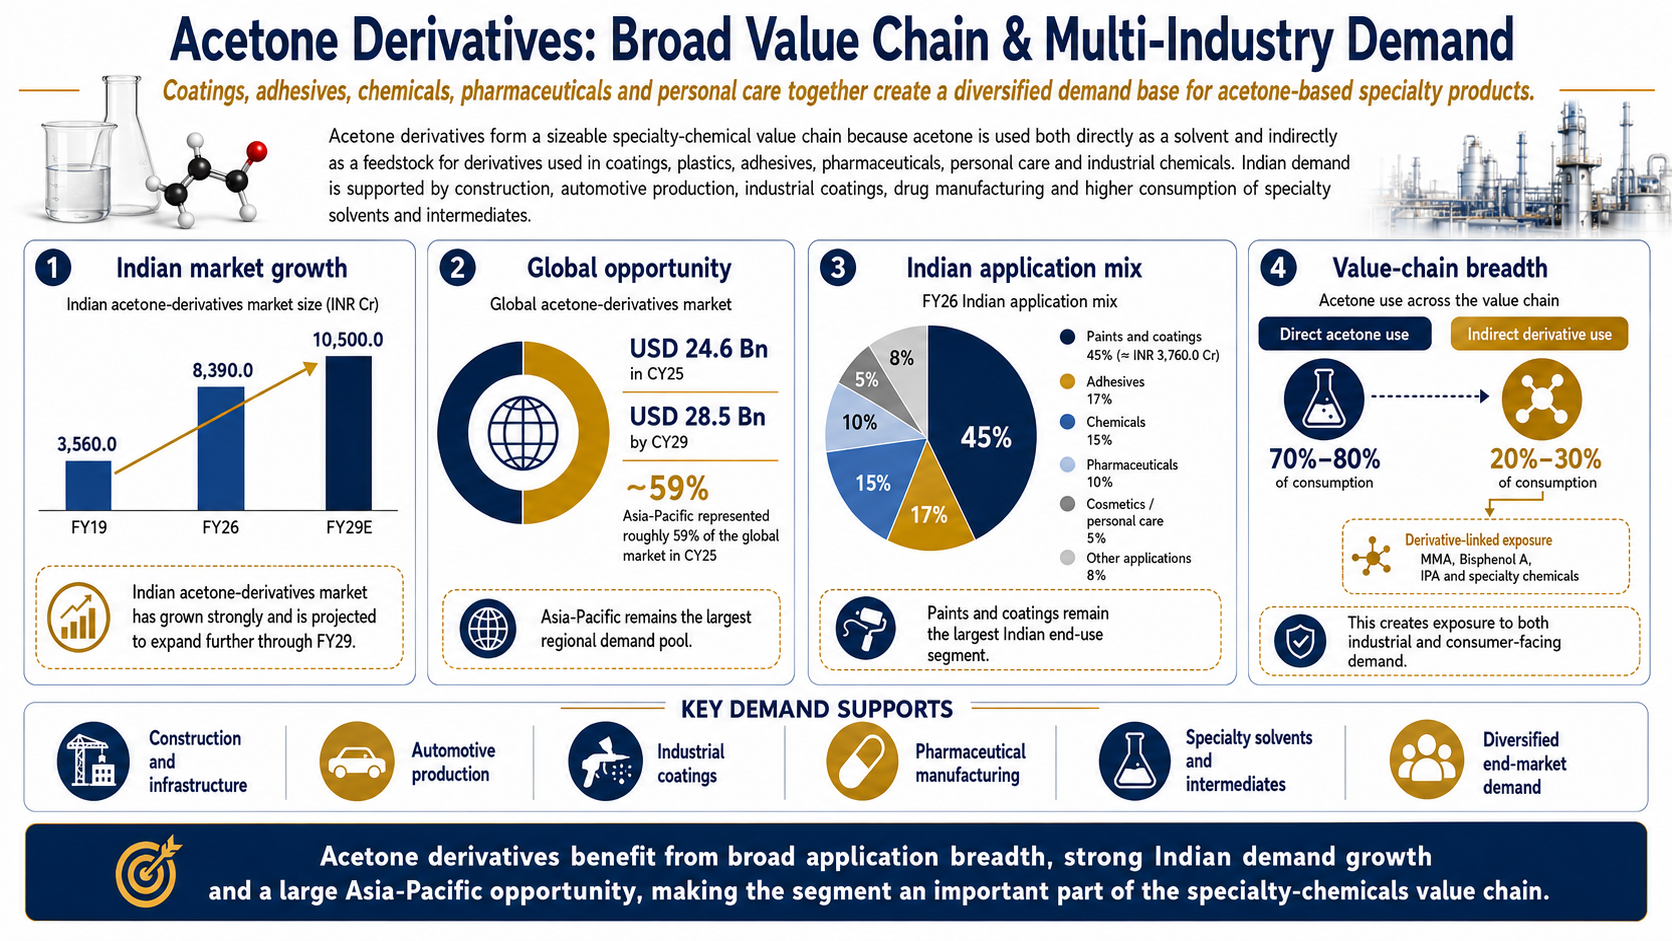
Acetone derivatives form a sizeable specialty-chemical value chain because acetone is used both directly as a solvent and indirectly as a feedstock for derivatives used in coatings, plastics, adhesives, pharmaceuticals, personal care and industrial chemicals. Indian demand is supported by construction, automotive production, industrial coatings, drug manufacturing and higher consumption of specialty solvents and intermediates.
The key drivers are:
Indian market growth: The Indian acetone-derivatives market is estimated at approximately INR 8,390.0 Cr in FY26, up from INR 3,560.0 Cr in FY19, and is projected to reach about INR 10,500.0 Cr by FY29
Global opportunity: The global acetone-derivatives market was approximately USD 24.6 Bn in CY25 and is projected to reach about USD 28.5 Bn by CY29; Asia-Pacific represented roughly 59% of the global market in CY25
Indian application mix: Paints and coatings account for about 45% of the FY26 Indian acetone-derivatives market, equivalent to approximately INR 3,760.0 Cr; adhesives account for 17%, chemicals 15%, pharmaceuticals 10%, cosmetics/personal care 5% and other applications 8%
Value-chain breadth: Direct acetone use is estimated at 70%-80% of consumption, while 20%-30% is used indirectly through derivatives such as MMA, Bisphenol A, IPA and specialty chemicals, creating exposure to both industrial and consumer-facing demand.
Risks in the Industry
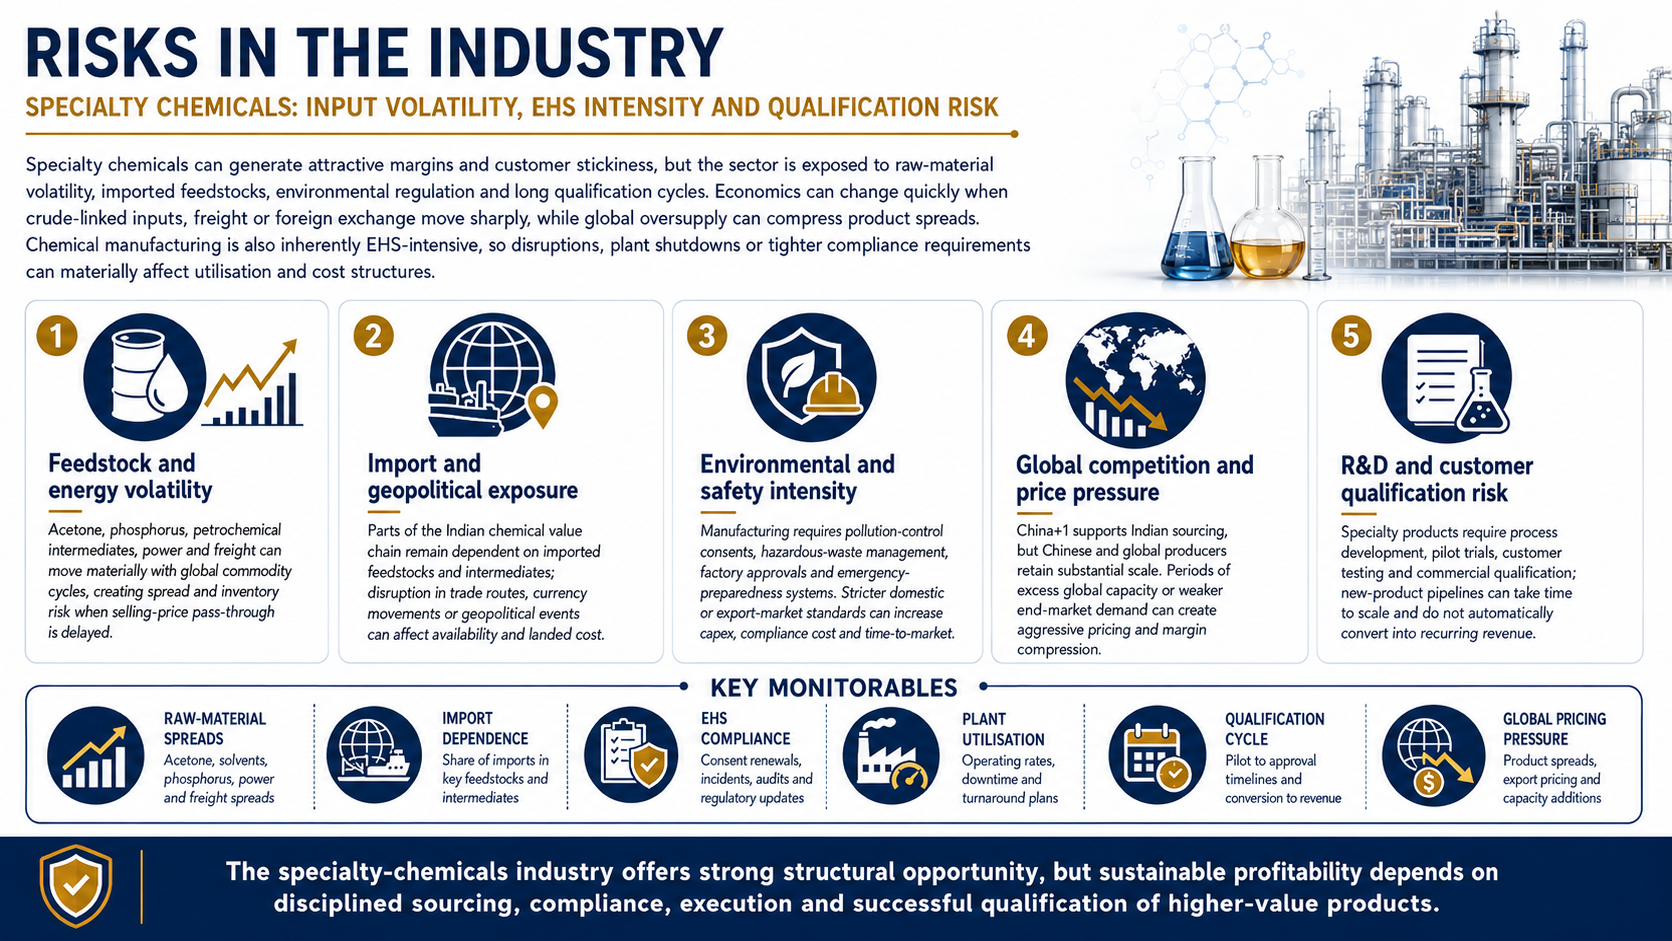
Specialty chemicals can generate attractive margins and customer stickiness, but the sector is exposed to raw-material volatility, imported feedstocks, environmental regulation and long qualification cycles. Economics can change quickly when crude-linked inputs, freight or foreign exchange move sharply, while global oversupply can compress product spreads. Chemical manufacturing is also inherently EHS-intensive, so disruptions, plant shutdowns or tighter compliance requirements can materially affect utilisation and cost structures.
The key risks are:
Feedstock and energy volatility: Acetone, phosphorus, petrochemical intermediates, power and freight can move materially with global commodity cycles, creating spread and inventory risk when selling-price pass-through is delayed
Import and geopolitical exposure: Parts of the Indian chemical value chain remain dependent on imported feedstocks and intermediates; disruption in trade routes, currency movements or geopolitical events can affect availability and landed cost
Environmental and safety intensity: Manufacturing requires pollution-control consents, hazardous-waste management, factory approvals and emergency-preparedness systems. Stricter domestic or export-market standards can increase capex, compliance cost and time-to-market
Global competition and price pressure: China+1 supports Indian sourcing, but Chinese and global producers retain substantial scale. Periods of excess global capacity or weaker end-market demand can create aggressive pricing and margin compression
R&D and customer qualification risk: Specialty products require process development, pilot trials, customer testing and commercial qualification; new product pipelines can take time to scale and do not automatically convert into recurring revenue
Government Policy Support
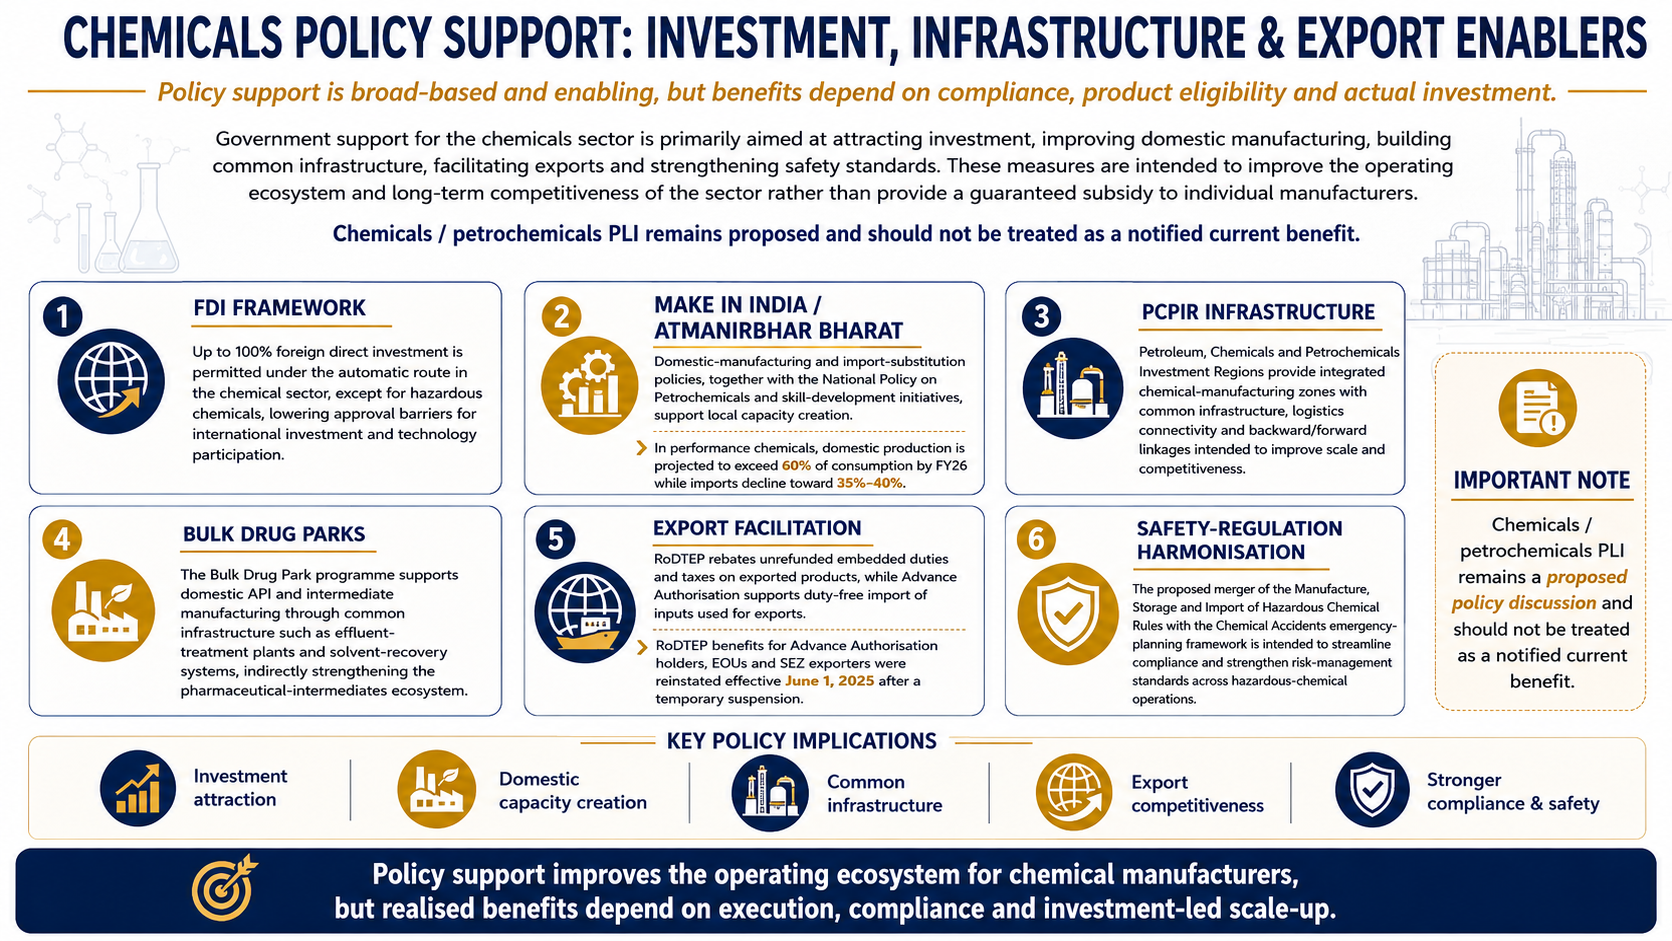
Government support for chemicals is primarily aimed at attracting investment, improving domestic manufacturing, building common infrastructure, facilitating exports and strengthening safety standards rather than providing a guaranteed subsidy to individual manufacturers. The policy direction is supportive of import substitution and global supply-chain diversification, but benefits depend on product eligibility, compliance and actual investment. Importantly, the chemicals/petrochemicals PLI discussed in the industry report remains proposed and should not be treated as a notified current benefit.
The key policies are:
FDI framework: Up to 100% foreign direct investment is permitted under the automatic route in the chemical sector, except for hazardous chemicals, lowering approval barriers for international investment and technology participation
Make in India / Atmanirbhar Bharat: Domestic-manufacturing and import-substitution policies, together with the National Policy on Petrochemicals and skill-development initiatives, support local capacity creation. In performance chemicals, domestic production is projected to exceed 60% of consumption by FY26 while imports decline toward 35%-40%
PCPIR infrastructure: Petroleum, Chemicals and Petrochemicals Investment Regions provide integrated chemical-manufacturing zones with common infrastructure, logistics connectivity and backward/forward linkages intended to improve scale and competitiveness
Bulk Drug Parks: The Bulk Drug Park programme supports domestic API and intermediate manufacturing through common infrastructure such as effluent-treatment plants and solvent-recovery systems, indirectly strengthening the pharmaceutical-intermediates ecosystem
Export facilitation: RoDTEP rebates unrefunded embedded duties and taxes on exported products, while Advance Authorisation supports duty-free import of inputs used for exports. RoDTEP benefits for Advance Authorisation holders, EOUs and SEZ exporters were reinstated effective June 1, 2025 after a temporary suspension
Safety-regulation harmonisation: The proposed merger of the Manufacture, Storage and Import of Hazardous Chemical Rules with the Chemical Accidents emergency-planning framework is intended to streamline compliance and strengthen risk-management standards across hazardous-chemical operations
Fundraise/Future Plans
Shareholding
Pre-issue shareholding
Promoter Holding 0.0%
Post-Issue Shareholding
Promoter Holding 0.0%
Category
Pre-Issue%Post-Issue%
Promoters
Usha Rajnikant Shah
12.9%9.6%
Gaurang Natwarlal Parikh
9.0%7.9%
Nishith Rasiklal Dharia
8.6%7.6%
Sachin Jatin Parikh
3.4%2.6%
Dhaval Nalin Parikh
3.1%3.0%
Kunal Tushar Dharia
3.1%3.0%
Total Promoter Holding
40.1%33.7%
Additional Shareholders
0.0%0.0%
Total Additional Holding
0.0%0.0%
Total Shareholding
40.1%33.7%
- Overview
- Business
- Financial Highlights
- Industry Overview
- Fundraise/Future Plans
- Documentation
Get the Preqt App and keep in touch around the clock!
 Monitor your investments in real-time.
- Receive tailored deal suggestions.
- Get real-time updates and alerts.
