


Priority Jewels
Jewels That EndureLuxury Crafted Precisely
IPO Summary (PrEqT)
Priority Jewels Limited is a Mumbai-based B2B fine-jewellery designer and manufacturer focused on light-weight, affordable diamond-studded gold and platinum jewellery supplied to independent jewellers and major jewellery chains in India and select overseas markets. FY26 revenue from operations reached INR 538.9 Cr, EBITDA margin improved to 6.2% and PAT reached INR 17.6 Cr; export revenue rose to 49.1% of sales while the working-capital cycle improved to 148 days from 172 days in FY25. The IPO is a 100% fresh issue of 45,75,000 shares; at INR 200.0, post-issue market capitalisation is approximately INR 360.0 Cr and FY26 P/E is 14.3x. The investment case combines formalisation in jewellery manufacturing, growing organised diamond-studded demand and an established B2B customer network, offset by customer concentration, volatile gold/diamond inputs, working-capital intensity and dependence on debt-funded metal procurement.
IPO Review Rating
Average
MainboardTransforming Precious Materials into Timeless Expressions of Fine Craftsmanship
Priority Jewels has shown a clear improvement in financial performance, with revenue increasing from INR 410.5 Cr in FY24 to INR 538.9 Cr in FY26, while PAT increased from INR 7.1 Cr to INR 17.6 Cr over the same period. EBITDA margin improved from 4.7% to 6.2%, ROE increased to 14.5%, and D/E declined to 0.7x, demonstrating strengthening profitability and capital efficiency. The Company operates in a jewellery market expected to grow at approximately 14.6% CAGR, with increasing formalisation providing a structural tailwind. Management has substantial industry experience, while the 100% fresh issue and zero OFS are positive governance and capital-allocation signals. However, the business remains working-capital intensive, with a FY26 working-capital cycle of 148 days, while Top-10 customers still contribute 47.9% of revenue. At INR 200, valuation at 14.3x historical FY26 P/E and 1.9x P/B appears fair, although post-issue dilution makes the effective earnings valuation less attractive. The proposed utilisation of up to INR 75 Cr for debt repayment should materially strengthen the balance sheet and reduce finance costs. Overall, Priority Jewels represents an improving but moderate-quality business where margin expansion, cash conversion and post-IPO deleveraging will be the key factors determining future investment returns.
PARAMETER
WEIGHT
SCORE
KEY FACTORS
Financial Performance
40.0%
3.0/5
Priority Jewels has demonstrated a clear improvement in financial performance over FY24–FY26. Revenue increased from INR 410.5 Cr to INR 538.9 Cr, while PAT more than doubled from INR 7.1 Cr to INR 17.6 Cr.
Show more
Detailed Analysis
Revenue increased from INR 410.5 Cr in FY24 to INR 435.5 Cr in FY25 and INR 538.9 Cr in FY26, representing a FY24–FY26 CAGR of 14.6%. FY26 revenue grew 23.8% YoY
EBITDA increased from INR 19.3 Cr in FY24 to INR 24.3 Cr in FY25 and INR 33.6 Cr in FY26. EBITDA margin consequently improved from 4.7% to 5.6% and 6.2%, respectively
PAT increased from INR 7.1 Cr in FY24 to INR 10.5 Cr in FY25 and INR 17.6 Cr in FY26, while PAT margin expanded from 1.7% in FY24 to 3.3% in FY26. FY26 PAT grew approximately 67.9% YoY
Debt-to-equity remained elevated at 1.3x in FY24 and 1.4x in FY25, before improving materially to 0.7x in FY26
ROE improved consistently from 7.4% in FY24 to 10.5% in FY25 and 14.5% in FY26
Operating cash flow improved from negative INR 1.8 Cr in FY24 to positive INR 2.5 Cr in FY25 and INR 17.7 Cr in FY26
Revenue from the largest customer reduced sharply from 19.9% in FY24 and 20.1% in FY25 to 10.4% in FY26. Top-10 concentration also declined from 57.7% in FY24 to 47.9% in FY26
Industry
15.0%
0.0/5
Priority Jewels operates in an industry with healthy structural growth and increasing formalisation.
Show more
Detailed Analysis
India's daily-wear gems & jewellery market is estimated to increase from INR 119,166 Cr in CY25 to INR 235,704 Cr by CY30, implying a strong 14.6% CAGR
The industry is in a growth and formalisation phase, with the organised share of the diamond-studded gold wholesale market expected to rise from 42.7% in CY25 to 45.5% by CY30
The sector is subject to mandatory BIS hallmarking/HUID requirements, DGFT regulations and Foreign Trade Policy provisions. Regulation improves industry formalisation but increases compliance requirements
Management
15.0%
4.0/5
Management experience is a significant strength for Priority Jewels, with the key executives possessing 16–33+ years of jewellery-industry experience. The Board has a reasonable governance structure, with 50% independent representation.
Show more
Detailed Analysis
Chairman & MD Shailesh Sangani has 33+ years of gems & jewellery experience, Tushar Mehta has 29+ years, while Aditi Karan Motla has 16+ years, providing substantial industry and operational experience
The Board comprises 6 Directors, including 3 Independent Directors, resulting in 50% Board independence
There are no disclosed criminal or material civil proceedings, although the Company has 5 tax proceedings involving INR 3.8 Cr and certain historical regulatory inquiries involving promoters/directors
Recurring operating/P&L related-party transactions are estimated at approximately INR 1.5 Cr in FY26, representing only around 0.3% of FY26 revenue, indicating limited operational dependence on related parties
Valuation
20.0%
3.0/5
At INR 200 per share, Priority Jewels is valued at approximately 14.3x FY26 earnings and 1.9x book value.
Show more
Detailed Analysis
At the upper price of INR 200, Priority is valued at approximately 14.3x FY26
Priority's indicative FY26 EV/EBITDA is approximately 13.6x, compared with an estimated selected peer average of around 9.5x, indicating a premium on this metric
At INR 200, the IPO is priced at approximately 1.9x FY26 NAV of INR 103.3 per share
RoNW improved from 7.5% in FY24 to 10.0% in FY25 and 12.7% in FY26
Merchant Banker Track Record
10.0%
4.0/5
The BRLM has only one recent completed IPO in the disclosed period, making the sample size too limited to establish consistent execution capability. Therefore, although the numerical score is high, merchant-banker depth should still be treated as a relative weakness compared with established institutional BRLMs.
Show more
Detailed Analysis
Mefcom's disclosed recent IPO, Globe Civil Projects, listed at INR 91.1 versus an issue price of INR 71, generating approximately 28.3% listing appreciation
Globe Civil Projects received approximately 86.0x overall subscription, indicating strong investor demand for Mefcom's disclosed recent issue
The disclosed recent track record contains 1 completed IPO and 1 positive listing, resulting mechanically in a 100% success rate
Mefcom has only one recent IPO disclosed in the RHP track record, resulting in limited transaction depth compared with larger institutional BRLMs
TOTAL
100%
3.3/5
Weighted Composite Score
Issue Price
₹190.0 to ₹200.0
As of 29 Aug 2026
GMP
₹30.0
As of 29 Aug 2026
Estimated Gain / Loss
+15.0%
Lot Size
75.0 Shares
Grey Market Premium (GMPs) are shared for knowledge purpose only. PrEqt doesn’t promote or execute the trades.
| Issue Size (in Cr) | |
|---|---|
| Overall | ₹92.0 Cr |
| Fresh Issue | ₹92.0 Cr |
| Offer for Sale | ₹0.0 Cr |
Minimum Investment
₹15,000.0 / 5,625 shares

Merchant Banker
Mefcom Capital Markets Ltd.
IPO Document
RHP / Anchor Document
Offer Start Date
28th Aug 2026
Offer End Date
1st Sept 2026
Valuation
₹360.0 Cr
Revenue (FY'26)
₹538.9 Cr
PAT (FY'26)
₹17.6 Cr
Issue Size (in Cr)
₹92.0 Cr
Face Value
₹ 10.0Offer Price
₹ 200.0Lot Size
75.0 sharesSale Type
Fresh capital onlyPAT (FY'26)
₹ 17.6 CrPAT Margin (FY'26)
4.4 %P/E Multiple
14.6xEBITDA (FY'26)
₹ 33.6 CrCAGR Growth 2Y
14.6 %ROE (FY'26)
14.5 %ROCE (FY'26)
25.4 %Price to Book Value
2.5xDebt/Equity
0.8xCompany Website
www.priorityjewels.inExplore new deals
Overview
Fund Allocation
Total: ₹0 CrSource:Company DRHP
Timeline
IPO Open Date
To Be Announced
IPO Close Date
To Be Announced
Tentative Allotment
To Be Announced
Initiation of Refunds
To Be Announced
Credit of Shares to Demat
To Be Announced
Tentative Listing Date
To Be Announced
Business
Products
Business Model
Geographical Presence
Sales Channel
Clients
Key Risk Factor
Financial Highlights
Income Statement
Revenue growth with EBITDA and PAT margins
| Financial Metric | FY 2024 | FY 2025 | FY 2026 |
|---|---|---|---|
| Revenue (₹ Cr) | 410.6 | 435.9 | 539.0 |
| Growth (%) | - | 6.1% | 23.8% |
| EBITDA (₹ Cr) | 19.4 | 24.3 | 33.6 |
| EBITDA Margin (%) | 4.7% | 5.6% | 6.2% |
| PAT (₹ Cr) | 7.2 | 10.5 | 17.7 |
| PAT Margin (%) | 1.7% | 2.4% | 3.3% |
OBSERVATIONS & INSIGHTS
Revenue grew 6.1% in FY25 and accelerated to 23.8% in FY26. Management attributes FY26 growth to higher sales volumes across domestic and export markets and a more balanced revenue mix
EBITDA increased from INR 19.3 Cr in FY24 to INR 33.6 Cr in FY26 as the Company scaled revenue, improved procurement/production efficiency and absorbed fixed costs over a larger sales base
PAT rose 47.1% in FY25 and 67.9% in FY26. The faster-than-revenue growth reflects EBITDA margin expansion plus improved debt management and a stronger revenue mix
Balance Sheet
| Financial Metric | FY 2024 | FY 2025 | FY 2026 |
|---|---|---|---|
| Net Worth | ₹ 94.8 Cr | ₹ 104.9 Cr | ₹ 138.6 Cr |
| Total Assets | ₹ 269.0 Cr | ₹ 309.1 Cr | ₹ 292.0 Cr |
| Total Borrowing | ₹ 125.0 Cr | ₹ 145.9 Cr | ₹ 102.6 Cr |
| Reserves & Surplus | ₹ 91.6 Cr | ₹ 92.3 Cr | ₹ 125.3 Cr |
OBSERVATIONS & INSIGHTS
Total Equity rose from INR 94.8 Cr in FY24 to INR 138.6 Cr in FY26 due retained earnings, changes in share capital and premium from fresh/pre-IPO equity issuance, strengthening the capital base
Total Assets peaked at INR 309.1 Cr in FY25 because of receivable build-up and then reduced to INR 292.0 Cr in FY26 as collections improved and bank balances declined, despite revenue growth
Total Borrowings increased from INR 125.0 Cr in FY24 to INR 145.9 Cr in FY25 as receivables and working-capital requirements expanded; reduced to INR 102.6 Cr in FY26 as short-term borrowings declined and operating cash flow improved
Reserve & Surplus increased to INR 125.3 Cr in FY26 from INR 92.3 Cr in FY25, mainly due to retained FY26 profits plus securities premium and ESOP-related equity movements
Cash Flow
| Financial Metric | FY 2024 | FY 2025 | FY 2026 |
|---|---|---|---|
CFO in Cr Cash generated from core business operations. | -1.8 Cr | +2.5 Cr | +17.7 Cr |
CFI in Cr Cash used in / generated from investing activities. | +4.6 Cr | -18.7 Cr | +17.6 Cr |
CFF in Cr Cash from / used in financing activities. | -12.4 Cr | +13.3 Cr | -34.9 Cr |
Working Capital
| Efficiency Metric | FY 2023 | FY 2024 | FY 2025 |
|---|---|---|---|
Debtor Days Average number of days taken to collect customer payments. | - | - | - |
Creditor Days Average time taken to pay suppliers and vendors. | - | - | - |
Inventory Days Average number of days inventory remains unsold. | - | - | - |
CCC (Cash Conversion Cycle) (Debtor Days + Inventory Days - Creditor Days) | - | - | - |
Financial Ratios
Measures the company’s leverage relative to shareholder equity.
OBSERVATIONS & INSIGHTS
ROE improved from 7.4% to 14.5% as PAT grew materially faster than the equity base, indicating stronger earnings conversion from shareholder capital
Debt / Equity rose marginally to 1.4x in FY25 as short-term borrowings increased, then fell sharply to 0.7x in FY26 as borrowings declined and retained earnings/share premium strengthened equity
Interest Coverage improved from 2.2x to 3.8x because EBIT/PBT expanded substantially while finance cost increased only modestly; FY26 operating profit therefore provided a larger cushion for debt servicing
Current Ratio dipped to 1.4x in FY25 because current liabilities, particularly working-capital borrowings, grew faster than current assets; it improved to 2.0x in FY26 after short-term borrowings and trade payables declined
ROA increased from a FY24 proxy of 2.7% to 5.9% in FY26 as profit accelerated while the asset base remained broadly stable. FY24 uses closing FY24 assets as the proxy because opening FY23 assets are not available in the selected three-year restated series
ROCE improved from 17.5% to 25.4% as EBIT growth outpaced tangible capital employed, reflecting better utilisation of manufacturing and working capital
Industry Overview
Industry Drivers
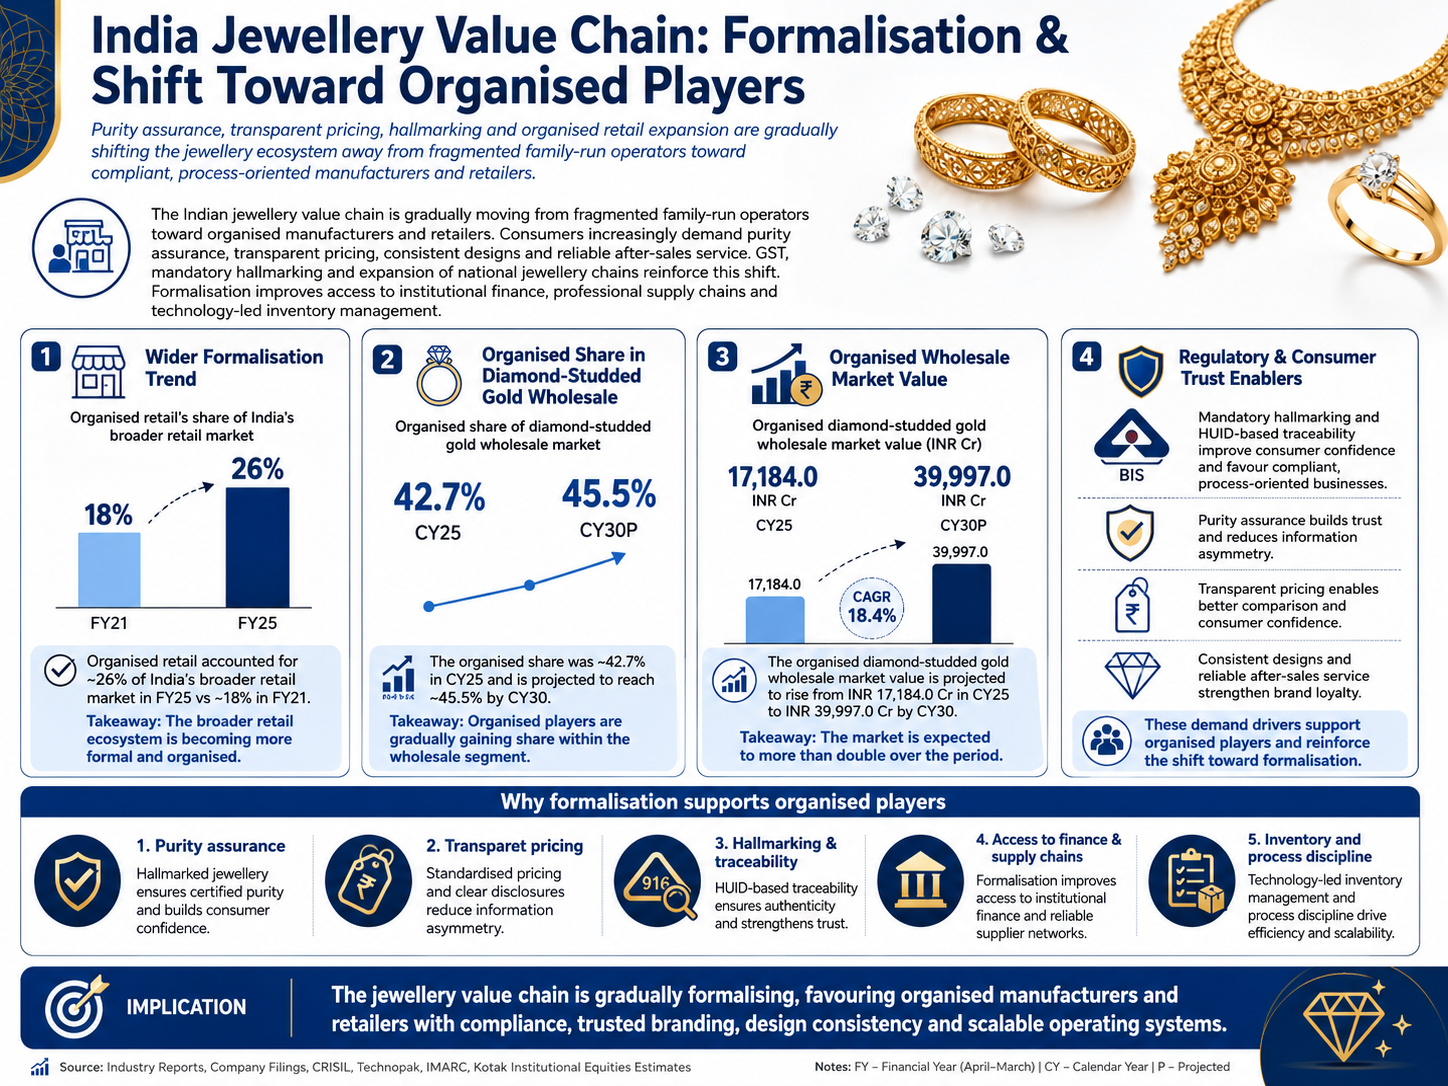
Formalisation and Shift Toward Organised Jewellery
The Indian jewellery value chain is gradually moving from fragmented family-run operators toward organised manufacturers and retailers as consumers demand purity assurance, transparent pricing, consistent designs and reliable after-sales service. GST, mandatory hallmarking and expansion of national jewellery chains reinforce this shift. Formalisation also improves access to institutional finance, professional supply chains and technology-led inventory management.
The key drivers are:
Organised retail accounted for roughly 26% of India’s broader retail market in FY25 versus about 18% in FY21, signalling a wider formalisation trend
The organised share of the diamond-studded gold wholesale market was approximately 42.7% in CY25 and is projected to reach about 45.5% by CY30
Organised diamond-studded gold wholesale value is projected to rise from about INR 17,184.0 Cr in CY25 to INR 39,997.0 Cr by CY30
Mandatory hallmarking and HUID-based traceability improve consumer confidence and favour compliant, process-oriented jewellery businesses
Rising Incomes, Daily-Wear Adoption and Diamond-Studded Penetration
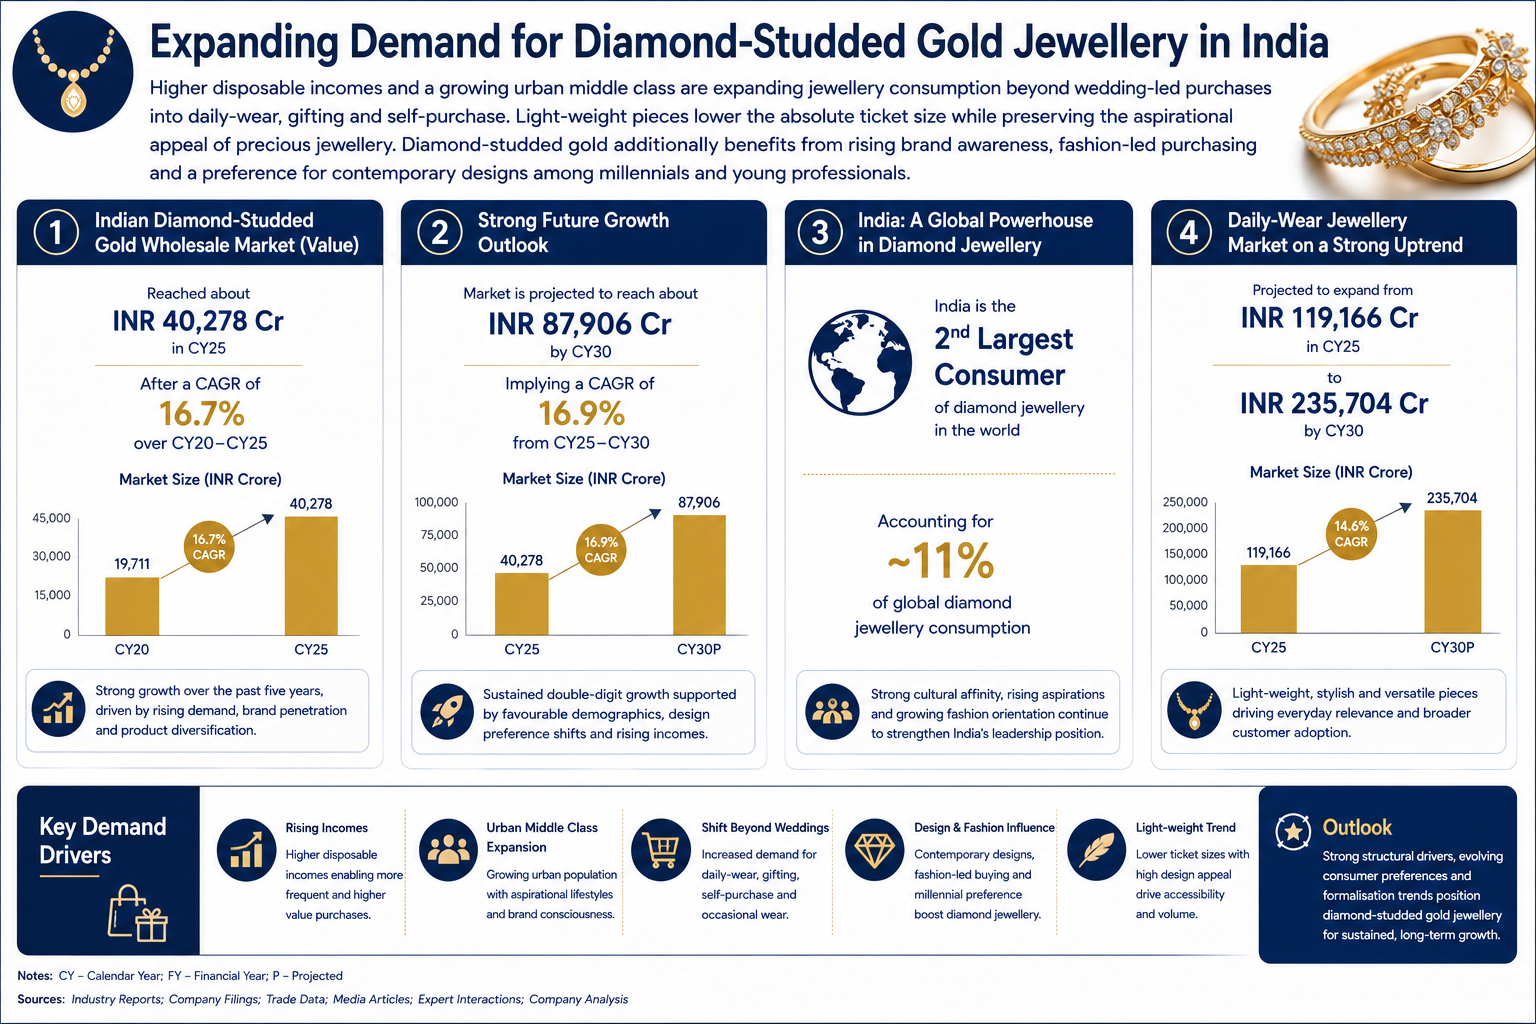
Higher disposable incomes and a growing urban middle class are expanding jewellery consumption beyond wedding-led purchases into daily-wear, gifting and self-purchase. Light-weight pieces lower the absolute ticket size while preserving the aspirational appeal of precious jewellery. Diamond-studded gold additionally benefits from rising brand awareness, fashion-led purchasing and a preference for contemporary designs among millennials and young professionals.
The key details are:
The Indian diamond-studded gold wholesale market reached about INR 40,278.0 Cr in CY25 after a 16.7% CAGR over CY20-CY25
The market is projected to reach about INR 87,906.0 Cr by CY30, implying approximately 16.9% CAGR from CY25
India is the world’s second-largest consumer of diamond jewellery, accounting for about 11% of global consumption
The daily-wear jewellery market is projected to expand from approximately INR 119,166.0 Cr in CY25 to INR 235,704.0 Cr by CY30
Retail Expansion, Omnichannel Discovery and Tier-II/III Demand
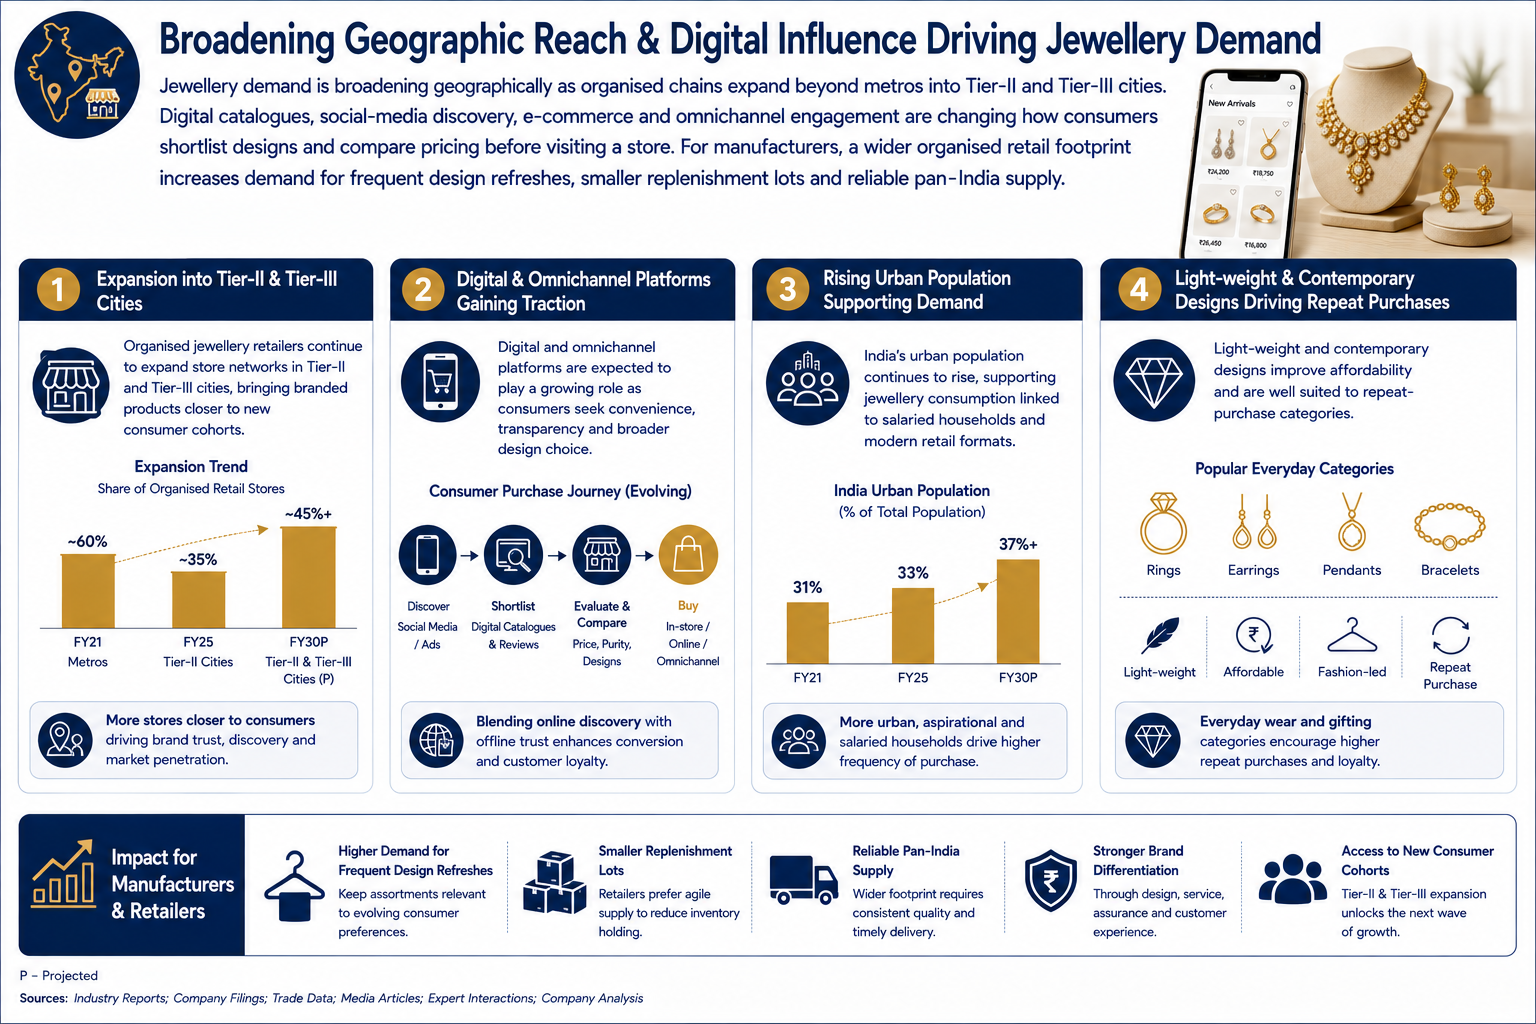
Jewellery demand is broadening geographically as organised chains expand beyond metros into Tier-II and Tier-III cities. Digital catalogues, social-media discovery, e-commerce and omnichannel engagement are changing how consumers shortlist designs and compare pricing before visiting a store. For manufacturers, a wider organised retail footprint increases demand for frequent design refreshes, smaller replenishment lots and reliable pan-India supply.
The key details are:
Organised jewellery retailers continue to expand store networks in Tier-II and Tier-III cities, bringing branded products closer to new consumer cohorts
Digital and omnichannel platforms are expected to play a growing role as consumers seek convenience, transparency and broader design choice
India’s urban population continues to rise, supporting jewellery consumption linked to salaried households and modern retail formats
Light-weight and contemporary designs improve affordability and are well suited to repeat-purchase categories such as rings, earrings, pendants and bracelets
Risks in the Industry
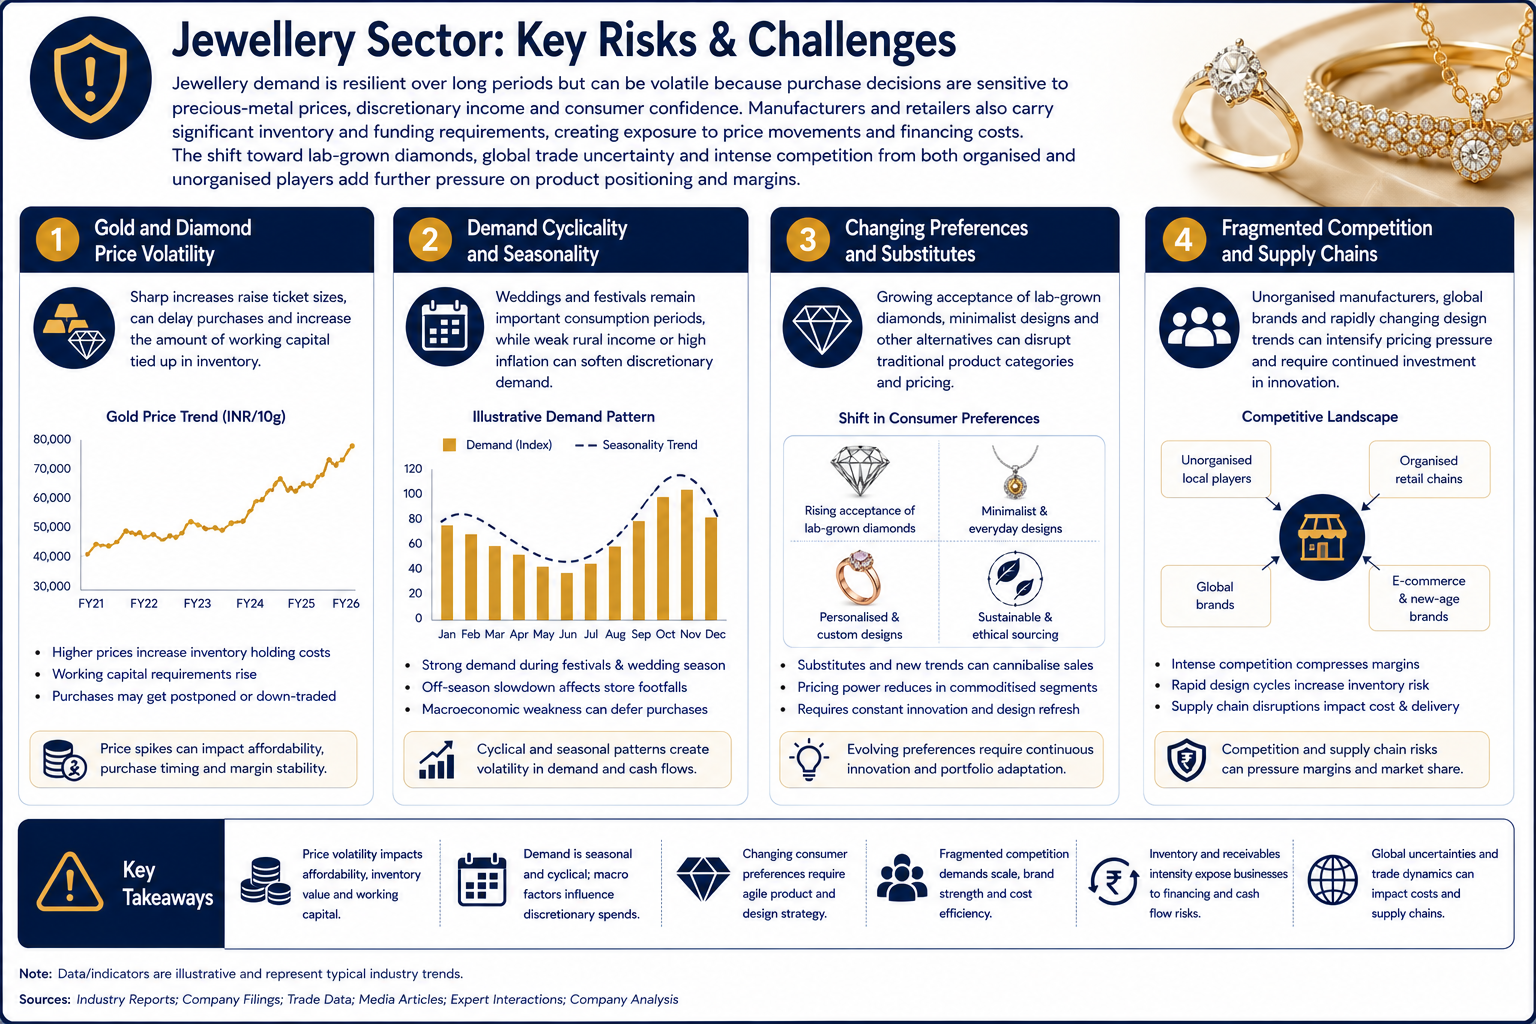
Jewellery demand is resilient over long periods but can be volatile because purchase decisions are sensitive to precious-metal prices, discretionary income and consumer confidence. Manufacturers and retailers also carry significant inventory and funding requirements, creating exposure to price movements and financing costs. The shift toward lab-grown diamonds, global trade uncertainty and intense competition from both organised and unorganised players add further pressure on product positioning and margins.
The key risks are:
Gold and diamond price volatility: Sharp increases raise ticket sizes, can delay purchases and increase the amount of working capital tied up in inventory
Demand cyclicality and seasonality: Weddings and festivals remain important consumption periods, while weak rural income or high inflation can soften discretionary demand
Changing preferences: Growing acceptance of lab-grown diamonds, minimalist designs and other alternatives can disrupt traditional product categories and pricing
Fragmented competition and supply chains: Unorganised manufacturers, global brands and rapidly changing design trends can intensify pricing pressure and require continued investment in innovation
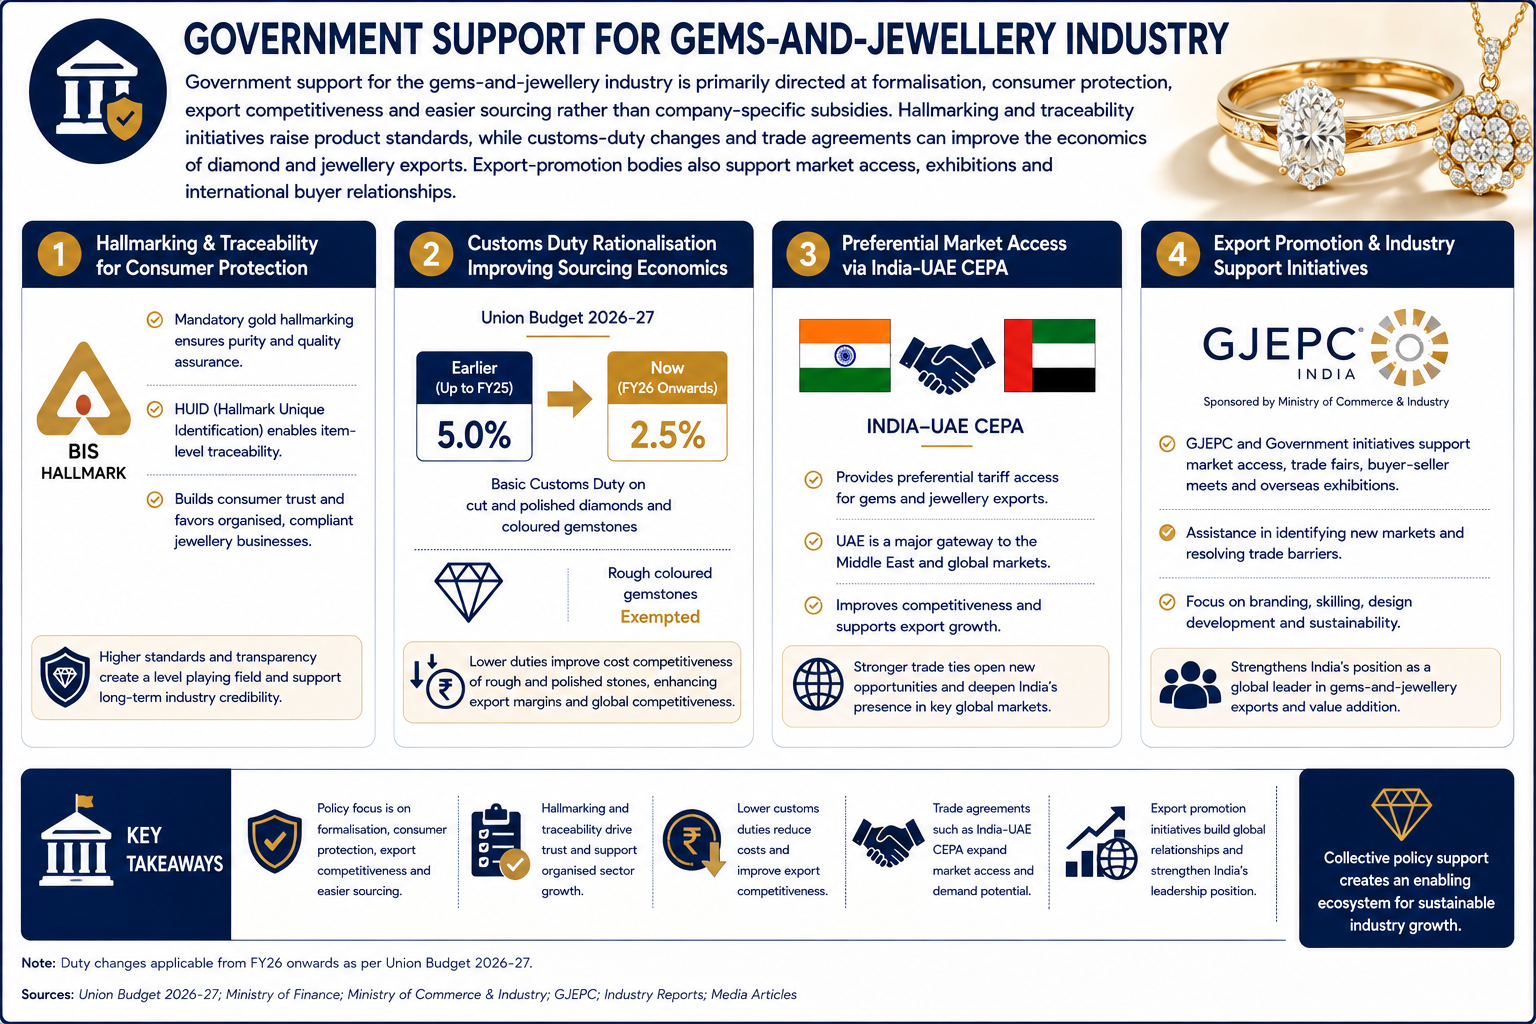
Government Policy Support
Government support for the gems-and-jewellery industry is primarily directed at formalisation, consumer protection, export competitiveness and easier sourcing rather than company-specific subsidies. Hallmarking and traceability initiatives raise product standards, while customs-duty changes and trade agreements can improve the economics of diamond and jewellery exports. Export-promotion bodies also support market access, exhibitions and international buyer relationships.
The key policies are:
Mandatory gold hallmarking and HUID traceability strengthen purity assurance and improve transparency across the organised jewellery ecosystem
Basic Customs Duty on cut and polished diamonds and coloured gemstones was reduced from 5.0% to 2.5% in Union Budget 2026-27, with rough coloured gemstones exempted
India-UAE CEPA provides preferential market access and supports jewellery exports into the UAE, a major gateway to Middle East demand
Government and GJEPC export-promotion initiatives focus on assisting exporters, identifying new markets and strengthening India’s position across the global gems-and-jewellery trade
Fundraise/Future Plans
Shareholding
Pre-issue shareholding
Promoter Holding 0.0%
Post-Issue Shareholding
Promoter Holding 0.0%
Category
Pre-Issue%Post-Issue%
Promoters
Shailesh Sangani
34.3%25.6%
Manisha Shailesh Sangani
14.9%11.1%
Aditi Karan Motla
14.9%11.1%
Aashna Sangani Parikh
14.9%11.1%
Tushar Mehta
0.5%0.3%
Isha Mehta (Promoter Group)
0.0%0.0%
Total Promoter Holding
79.5%59.2%
Additional Shareholders
Priority Retail Ventures Pvt. Ltd.
14.4%10.8%
Total Additional Holding
14.4%10.8%
Total Shareholding
93.9%70.0%
- Overview
- Business
- Financial Highlights
- Industry Overview
- Fundraise/Future Plans
- Documentation
Get the Preqt App and keep in touch around the clock!
 Monitor your investments in real-time.
- Receive tailored deal suggestions.
- Get real-time updates and alerts.
