


Purple Style Labs
Curating Modern LuxuryDesign. Desire. Distinction.
IPO Summary (PrEqT)
Purple Style Labs Limited operates Pernia's Pop-Up Shop, an omni-channel luxury fashion platform combining online discovery with Pernia's Pop-Up Studio Experience Centers. The platform had 1,109 Active Designer Brands, 208,490 SKUs and 14 Experience Centers globally as of the RHP date. FY26 revenue from operations increased 13.9% to INR 557.8 Cr and Total PPUS GMV rose 22.6% to INR 721.6 Cr, but EBITDA margin fell to 5.4% and PAT loss widened to INR (285.4) Cr as depreciation, finance costs and share-based payment expenses increased. The IPO is a 100% fresh issue aggregating up to INR 680.0 Cr. At the INR 546.0-INR 575.0 price band, post-issue market capitalisation is approximately INR 4,405.6 Cr-INR 4,603.5 Cr; P/E and P/B are not meaningful because FY26 PAT and net worth are negative. The investment case combines luxury premiumisation, a differentiated multi-designer assortment and omnichannel reach with material execution risk from losses, negative operating cash flow, lease-heavy expansion and increased leverage.
IPO Review Rating
Speculative
MainboardBringing Premium Fashion, Beauty, and Lifestyle Under One Platform
Purple Style Labs has built a differentiated luxury-fashion platform, but Revenue increased only from INR 504.4 Cr in FY24 to INR 557.8 Cr in FY26, representing a modest 5.2% CAGR. Profitability is the key weakness, with EBITDA Margin declining to 5.4% and PAT loss widening sharply from INR 47.7 Cr in FY24 to INR 285.4 Cr in FY26. The balance sheet has weakened, as Debt increased to INR 371.4 Cr while total equity turned negative at INR -52.3 Cr, leaving conventional leverage and return metrics stressed. Cash conversion also remains poor, with OCF negative for three consecutive years and FY26 OCF at INR -34.9 Cr, alongside a 105.3-day cash-conversion cycle. The industry backdrop is considerably stronger than the Company's financials, with wedding and occasion wear forecast at 13.0% CAGR and branded wear at approximately 16.0% CAGR through FY31. Pernia's benefits from strong brand breadth, NRI demand and omni-channel positioning, although Top-10 Designer Brands still account for 30.2% of FY26 GMV and international Revenue has declined over FY24–FY26. Management alignment is supported by a 100.0% fresh issue and INR 0.0 Cr OFS, but Board independence of 33.3%, litigation and substantial share-based compensation remain governance monitorables. Overall, Purple Style Labs offers an attractive luxury-consumption and formalisation theme, but sustained profitability, positive operating cash flow and successful returns on the INR 510.0 Cr+ lease-and-marketing deployment are essential before the underlying business quality can justify a stronger investment score.
PARAMETER
WEIGHT
SCORE
KEY FACTORS
Financial Performance
40.0%
1.0/5
Purple Style Labs has achieved only 5.2% FY24–FY26 Revenue CAGR, while financial quality has deteriorated materially. EBITDA Margin fell to 5.4%, PAT loss widened to INR 285.4 Cr, total equity turned negative at INR -52.3 Cr, and debt increased to INR 371.4 Cr.
Show more
Detailed Analysis
Revenue increased from INR 504.4 Cr in FY24 to INR 557.8 Cr in FY26, representing a FY24–FY26 CAGR of only 5.2%; FY25 Revenue was INR 489.9 Cr
EBITDA declined from INR 42.0 Cr in FY25 to INR 30.4 Cr in FY26, while EBITDA Margin contracted from 8.6% to 5.4%; FY24 Margin was 6.3%
Loss after tax widened from INR 47.7 Cr in FY24 to INR 188.4 Cr in FY25 and INR 285.4 Cr in FY26, resulting in FY26 PAT Margin of -51.2%
Debt increased from INR 116.3 Cr in FY24 to INR 371.4 Cr in FY26, while FY26 total equity turned negative at INR -52.3 Cr, making conventional D/E economically non-meaningful
ROE deteriorated from -120.8% in FY24 to -160.3% in FY25, while FY26 ROE is not meaningful because both PAT and total equity are negative
OCF remained negative at INR -31.3 Cr in FY24, INR -45.2 Cr in FY25 and INR -34.9 Cr in FY26, indicating persistent cash absorption
Customer concentration is low at an individual level, with no single customer contributing 10.0% or more of FY26 Revenue
Industry
15.0%
3.0/5
Purple Style Labs operates in a structurally attractive growth segment, with the Indian wedding and occasion wear market forecast to grow at 13.0% CAGR and the branded segment at 16.0% CAGR.
Show more
Detailed Analysis
Indian wedding and occasion wear market is projected to increase from INR 200,000.0 Cr in FY26 to INR 370,000.0 Cr in FY31, representing 13.0% CAGR
Branded wedding and occasion wear share is projected to increase from 31.0% in FY26 to 35.0% in FY31, with the branded segment growing at 16.0% CAGR
Luxury fashion retail operates under normal retail, consumer, tax, e-commerce and cross-border compliance requirements, without a uniquely restrictive sector-specific regime
Management
15.0%
4.0/5
Management benefits from a founder-led operating team with approximately 14.0 years of promoter experience, while the absence of an OFS is a positive alignment signal. Board independence at 33.3% is adequate.
Show more
Detailed Analysis
Promoter and CEO Abhishek Agarwal has approximately 14.0 years of work experience, including operating a multi-brand luxury omni-channel fashion platform
The Board comprises 6 Directors, including 2 Independent Directors, resulting in 33.3% independent representation
No material promoter pledge is disclosed, but a legal-metrology-linked criminal proceeding involving the Promoter remains pending alongside Company tax/regulatory matters
Recurring disclosed external RPTs were approximately INR 5.4 Cr in FY26, representing roughly 1.0% of Revenue, excluding intra-group transactions eliminated on consolidation
Valuation
20.0%
2.0/5
Valuation is a significant investment concern. Purple Style Labs has negative FY26 EPS of INR 42.0, negative NAV of INR 7.7 and negative net worth, so conventional P/E and P/B valuation support is absent.
Show more
Detailed Analysis
FY26 diluted EPS is INR -42.0, making issuer P/E non-meaningful
FY26 EBITDA is only INR 30.4 Cr, but no directly comparable listed peer
FY26 NAV is INR -7.7 per share, making conventional P/B economically non-meaningful
FY26 RoNW is not meaningful because net worth is negative
Merchant Banker Track Record
10.0%
4.0/5
The BRLM profile is a clear strength for Purple Style Labs. Axis Capital and IIFL Capital have substantial recent mainboard IPO experience, with 52 and 47 disclosed transactions.
Show more
Detailed Analysis
The latest 10 IPOs each disclosed for Axis and IIFL generated a model-calculated average opening return of approximately 13.4%, with Axis at approximately 19.3% and IIFL at 7.5%
Recent lead-managed IPOs saw strong demand, including Shiprocket at 99.4x and Milky Mist at 56.1x overall subscription
Across the latest 10 disclosed issues for each BRLM, approximately 65.0% opened above their issue prices
Axis handled 52 IPOs and IIFL handled 47 IPOs across the RHP's FY25–FY27 disclosure period, demonstrating substantial institutional execution depth
TOTAL
100%
2.3/5
Weighted Composite Score
Issue Price
₹546.0 to ₹575.0
As of 29 Aug 2026
GMP
₹0.0
As of 29 Aug 2026
Estimated Gain / Loss
0.0%
Lot Size
26.0 Shares
Grey Market Premium (GMPs) are shared for knowledge purpose only. PrEqt doesn’t promote or execute the trades.
| Issue Size (in Cr) | |
|---|---|
| Overall | ₹680.0 Cr |
| Fresh Issue | ₹680.0 Cr |
| Offer for Sale | ₹0.0 Cr |
Minimum Investment
₹14,950.0 / 676 shares

Merchant Banker
Axis Capital Ltd.; IIFL Capital Services Limited
IPO Document
RHP / Anchor Document
Offer Start Date
31st Aug 2026
Offer End Date
2nd Sept 2026
Valuation
₹4,603.5 Cr
Revenue (FY'26)
₹567.1 Cr
PAT (FY'26)
₹-285.4 Cr
Issue Size (in Cr)
₹680.0 Cr
Face Value
₹ 10.0Offer Price
₹ 575.0Lot Size
26.0 sharesSale Type
Fresh capital onlyPAT (FY'26)
₹ -285.4 CrPAT Margin (FY'26)
-51.2 %EBITDA (FY'26)
₹ 30.4 CrCAGR Growth 2Y
5.4 %ROE (FY'26)
-160.3 %ROCE (FY'26)
-23.6 %Company Website
www.purplestylelabs.comExplore new deals
Overview
Fund Allocation
Total: ₹0 CrSource:Company DRHP
Timeline
IPO Open Date
To Be Announced
IPO Close Date
To Be Announced
Tentative Allotment
To Be Announced
Initiation of Refunds
To Be Announced
Credit of Shares to Demat
To Be Announced
Tentative Listing Date
To Be Announced
Business
Business Model
Geographical Presence
Sales Channel
Key Risk Factor
Financial Highlights
Income Statement
Revenue growth with EBITDA and PAT margins
| Financial Metric | FY 2024 | FY 2025 | FY 2026 |
|---|---|---|---|
| Revenue (₹ Cr) | 510.0 | 494.0 | 567.1 |
| Growth (%) | - | -2.9% | 13.9% |
| EBITDA (₹ Cr) | 31.6 | 42.0 | 30.4 |
| EBITDA Margin (%) | 6.3% | 8.6% | 5.4% |
| PAT (₹ Cr) | -47.7 | -188.4 | -285.4 |
| PAT Margin (%) | -9.5% | -38.5% | -51.2% |
OBSERVATIONS & INSIGHTS
Revenue declined 2.9% in FY25 and rebounded 13.9% in FY26. FY24-FY26 CAGR was approximately 5.2%, indicating modest recognised-revenue growth despite faster recent GMV recovery
EBITDA rose in FY25 but declined to INR 30.4 Cr in FY26 as operating costs associated with expansion and the larger store network offset gross-profit growth
Losses widened from INR (47.7) Cr in FY24 to INR (285.4) Cr in FY26 as depreciation/amortisation and finance costs increased and exceptional share-based payment expense remained material
Balance Sheet
| Financial Metric | FY 2024 | FY 2025 | FY 2026 |
|---|---|---|---|
| Net Worth | ₹ 39.5 Cr | ₹ 117.5 Cr | ₹ -52.3 Cr |
| Total Assets | ₹ 458.4 Cr | ₹ 497.1 Cr | ₹ 829.6 Cr |
| Total Borrowing | ₹ 116.3 Cr | ₹ 112.8 Cr | ₹ 371.4 Cr |
| Reserves & Surplus | ₹ 39.3 Cr | ₹ 117.5 Cr | ₹ -120.5 Cr |
OBSERVATIONS & INSIGHTS
Accumulated losses and share-based-payment effects reduced Reserved & Surplus to INR (120.5) Cr and total equity to INR (52.3) Cr in FY26 despite the bonus-related increase in nominal share capital
Total Assets expanded sharply to INR 829.6 Cr in FY26 from INR 497.1 Cr in FY25, mainly because right-of-use assets and PPE increased as new Experience Centers were added
Total Borrowings increased from INR 112.8 Cr in FY25 to INR 371.4 Cr in FY26 as expansion required additional funding
Cash Flow
| Financial Metric | FY 2024 | FY 2025 | FY 2026 |
|---|---|---|---|
CFO (₹ Cr) Cash generated from core business operations. | -31.3 Cr | -45.2 Cr | -34.9 Cr |
CFI (₹ Cr) Cash used for investments and long-term assets. | -16.8 Cr | -12.1 Cr | -52.5 Cr |
CFF (₹ Cr) Cash flow related to funding and borrowings. | +43.8 Cr | +64.5 Cr | +92.5 Cr |
Working Capital
| Efficiency Metric | FY 2023 | FY 2024 | FY 2025 |
|---|---|---|---|
Debtor Days Average number of days taken to collect customer payments. | - | - | - |
Creditor Days Average time taken to pay suppliers and vendors. | - | - | - |
Inventory Days Average number of days inventory remains unsold. | - | - | - |
CCC (Cash Conversion Cycle) (Debtor Days + Inventory Days - Creditor Days) | - | - | - |
Financial Ratios
Measures the company’s leverage relative to shareholder equity.
OBSERVATIONS & INSIGHTS
ROE was negative in FY24-FY25 due to losses; FY26 is not meaningful because year-end net worth is negative
Debt / Equity improved to about 1.0x in FY25 after equity issuance, but becomes not meaningful in FY26 because total equity is negative while borrowings rise materially
Interest Coverage was Negative throughout because EBIT remained negative; FY26 deterioration reflects higher depreciation and lease/debt-related finance costs
Current Ratio improved above 1.0x in FY25 but fell to 0.5x in FY26 as current borrowings and lease liabilities increased faster than current assets
ROA deteriorated materially as net losses expanded faster than the asset base; FY26 average-asset ROA was approximately (43.0%)
ROCE deteriorated from (3.3%) to (23.6%), showing that capital employed has not yet generated positive operating returns
Industry Overview
Industry Drivers
Rising Affluence and Expansion of Luxury Consumption
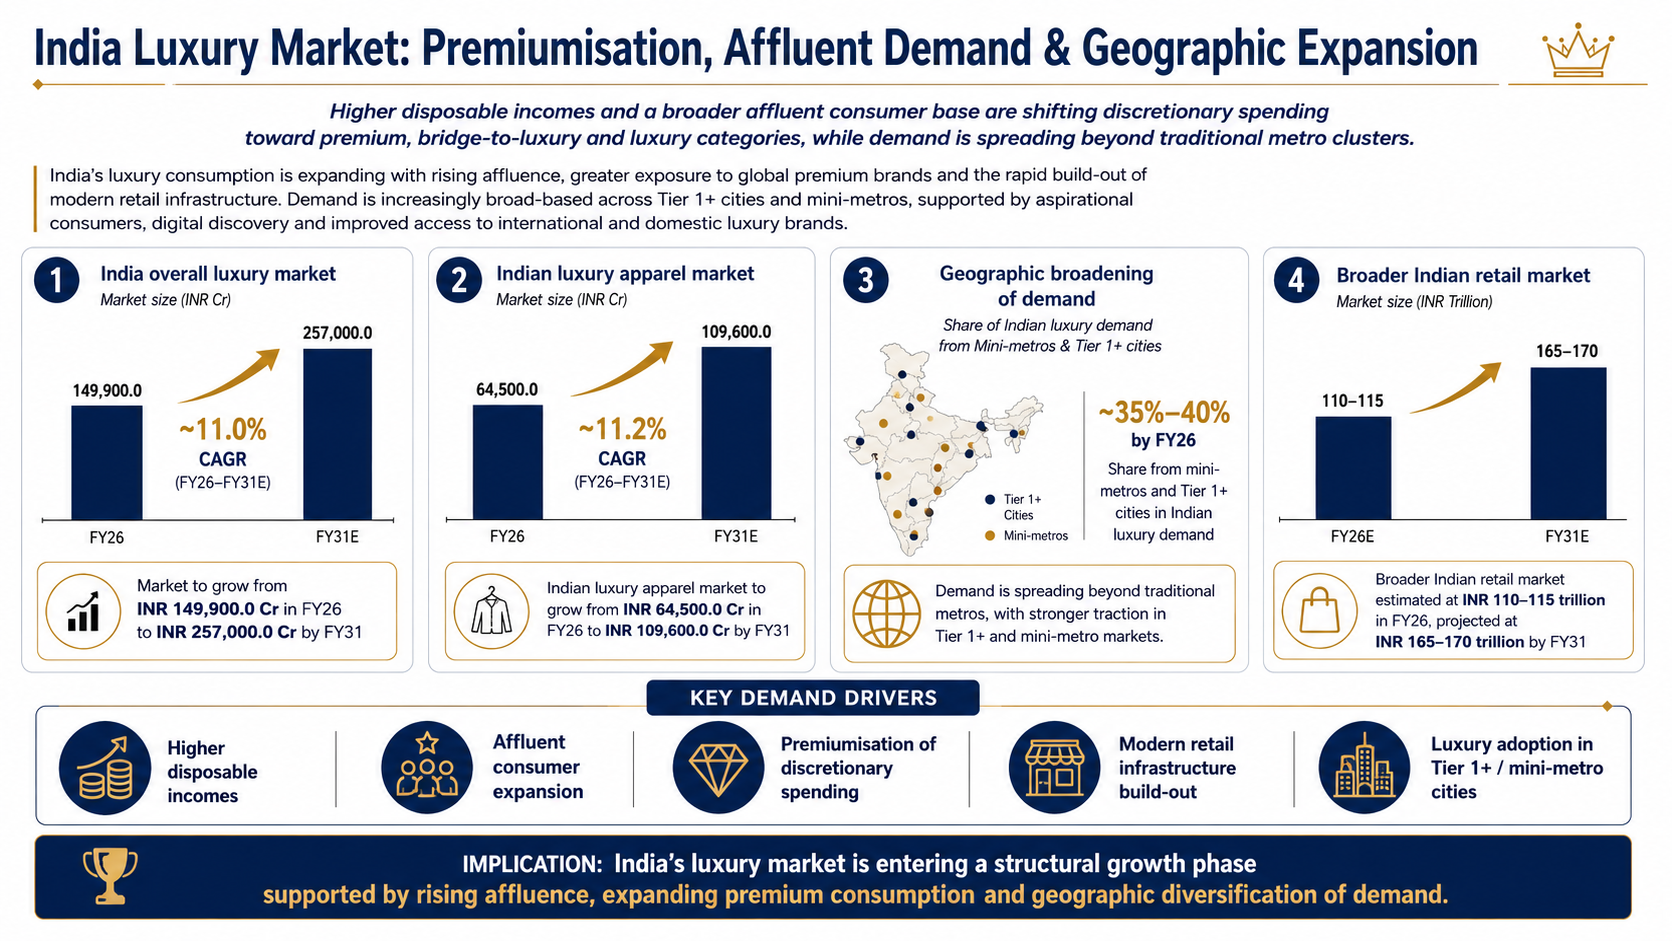
Higher disposable incomes and a broader affluent consumer base are moving discretionary spending toward premium, bridge-to-luxury and luxury categories. Luxury consumption is also spreading beyond traditional metropolitan clusters as consumers in Tier 1+ cities gain exposure to premium brands and modern retail infrastructure.
The key drivers are:
India's overall luxury market was INR 149,900.0 Cr in FY26 and is projected to reach INR 257,000.0 Cr by FY31, implying about 11.0% CAGR
The Indian luxury apparel market is projected to grow from INR 64,500.0 Cr in FY26 to INR 109,600.0 Cr by FY31
Mini-metros and Tier 1+ cities increased their share of Indian luxury demand to roughly 35%-40% by FY26
The broader Indian retail market is estimated at INR 110-115 trillion in FY26 and is projected to reach INR 165-170 trillion by FY31
Wedding, Occasion Wear and Premiumisation
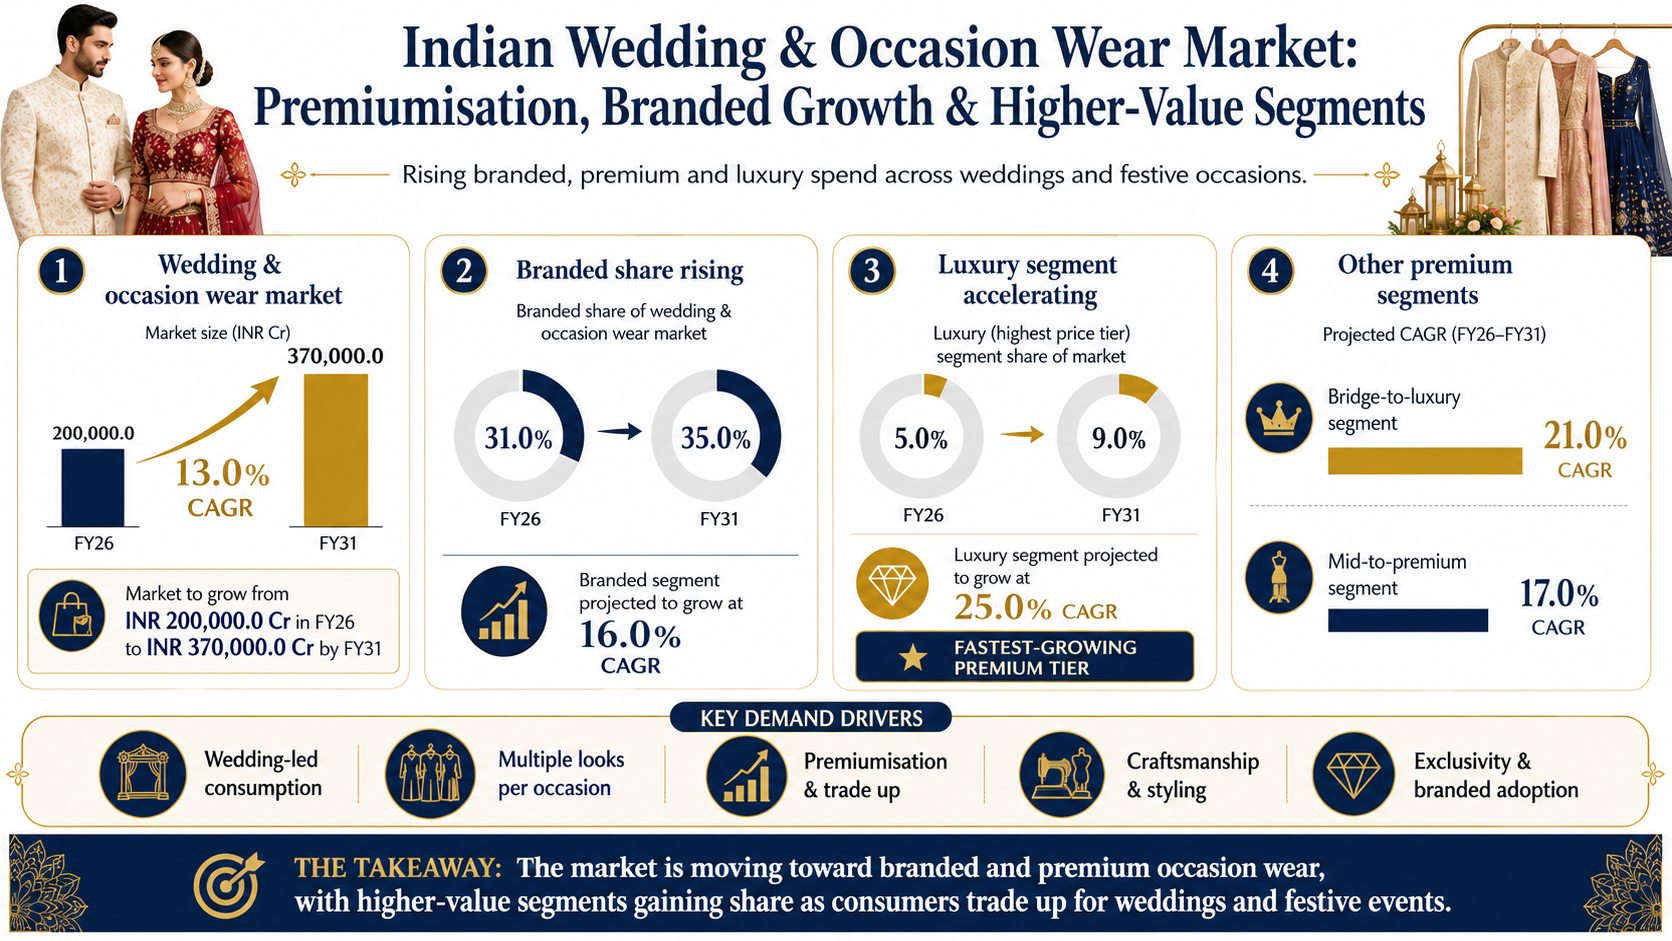
Weddings and festivals remain structurally important apparel-purchase occasions, but spend is increasingly shifting toward branded, designer-led and premium products. Consumers are buying multiple looks across wedding functions and festive events, while a higher willingness to pay for craftsmanship, styling and exclusivity is lifting higher-price segments.
The key details are:
The Indian wedding and occasion wear market was INR 200,000.0 Cr in FY26 and is projected to reach INR 370,000.0 Cr by FY31, a 13.0% CAGR
The branded share is projected to rise from 31.0% in FY26 to 35.0% by FY31, with the branded segment growing at approximately 16.0% CAGR
The luxury price segment is projected to grow at 25.0% CAGR, increasing its share from 5.0% to 9.0% by FY31
Bridge-to-luxury and mid-to-premium are projected to grow at about 21.0% and 17.0% CAGR, respectively
NRI Demand and Globalisation of Indian Designer Wear
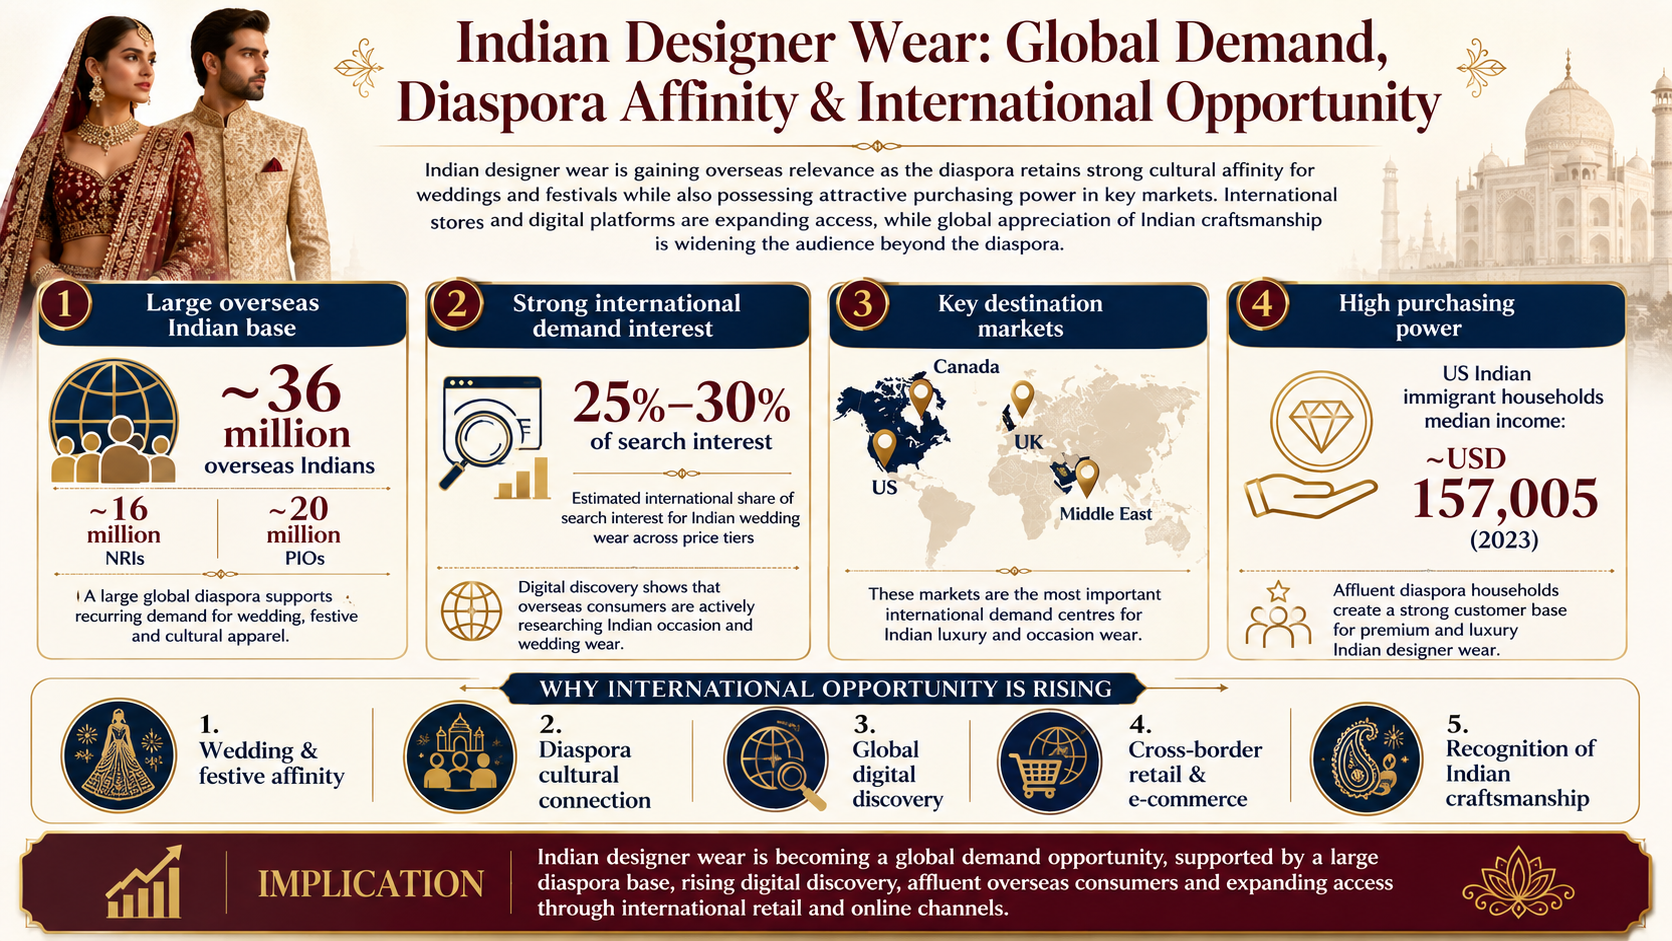
Indian designer wear is gaining overseas relevance as the diaspora retains strong cultural affinity for weddings and festivals while also possessing attractive purchasing power in key markets. International high-street stores and digital platforms allow Indian brands to serve this demand, while global recognition of Indian craftsmanship and couture is expanding the audience beyond the diaspora.
The key details are:
The overseas Indian population is estimated at approximately 36 million, including around 16 million NRIs and 20 million PIOs
International markets contribute an estimated 25%-30% of search interest for Indian wedding wear across price tiers
The US, UK, Canada and Middle East are key destination markets for Indian luxury and occasion wear
Indian immigrant households in the US had median annual household income of roughly USD 157,005 in 2023, materially above the US national average
Risks in the Industry
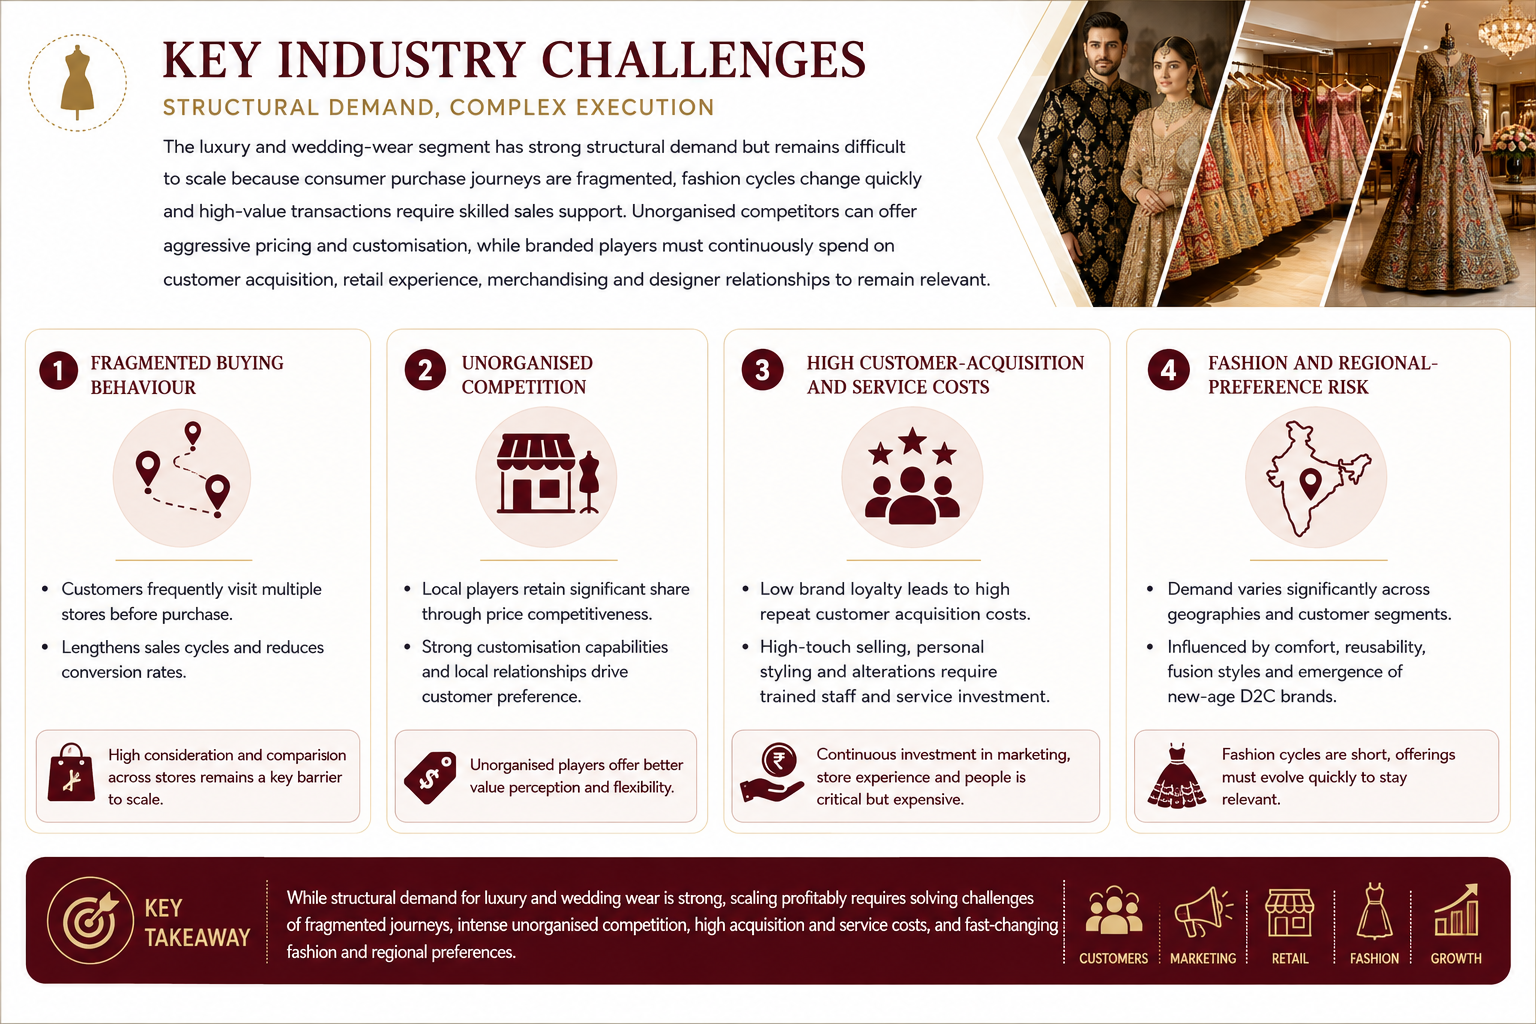
The luxury and wedding-wear segment has strong structural demand but remains difficult to scale because consumer purchase journeys are fragmented, fashion cycles change quickly and high-value transactions require skilled sales support. Unorganised competitors can offer aggressive pricing and customisation, while branded players must continuously spend on customer acquisition, retail experience, merchandising and designer relationships to remain relevant.
The key risks are:
Customers frequently visit multiple stores before purchase, lengthening sales cycles and reducing conversion
Local players retain significant share through price competitiveness, customisation and local relationships
Low brand loyalty and high-touch selling require continual investment in marketing and trained store staff
Demand varies by geography and is increasingly influenced by comfort, reusability, fusion styles and new-age D2C brands
Government Policy Support
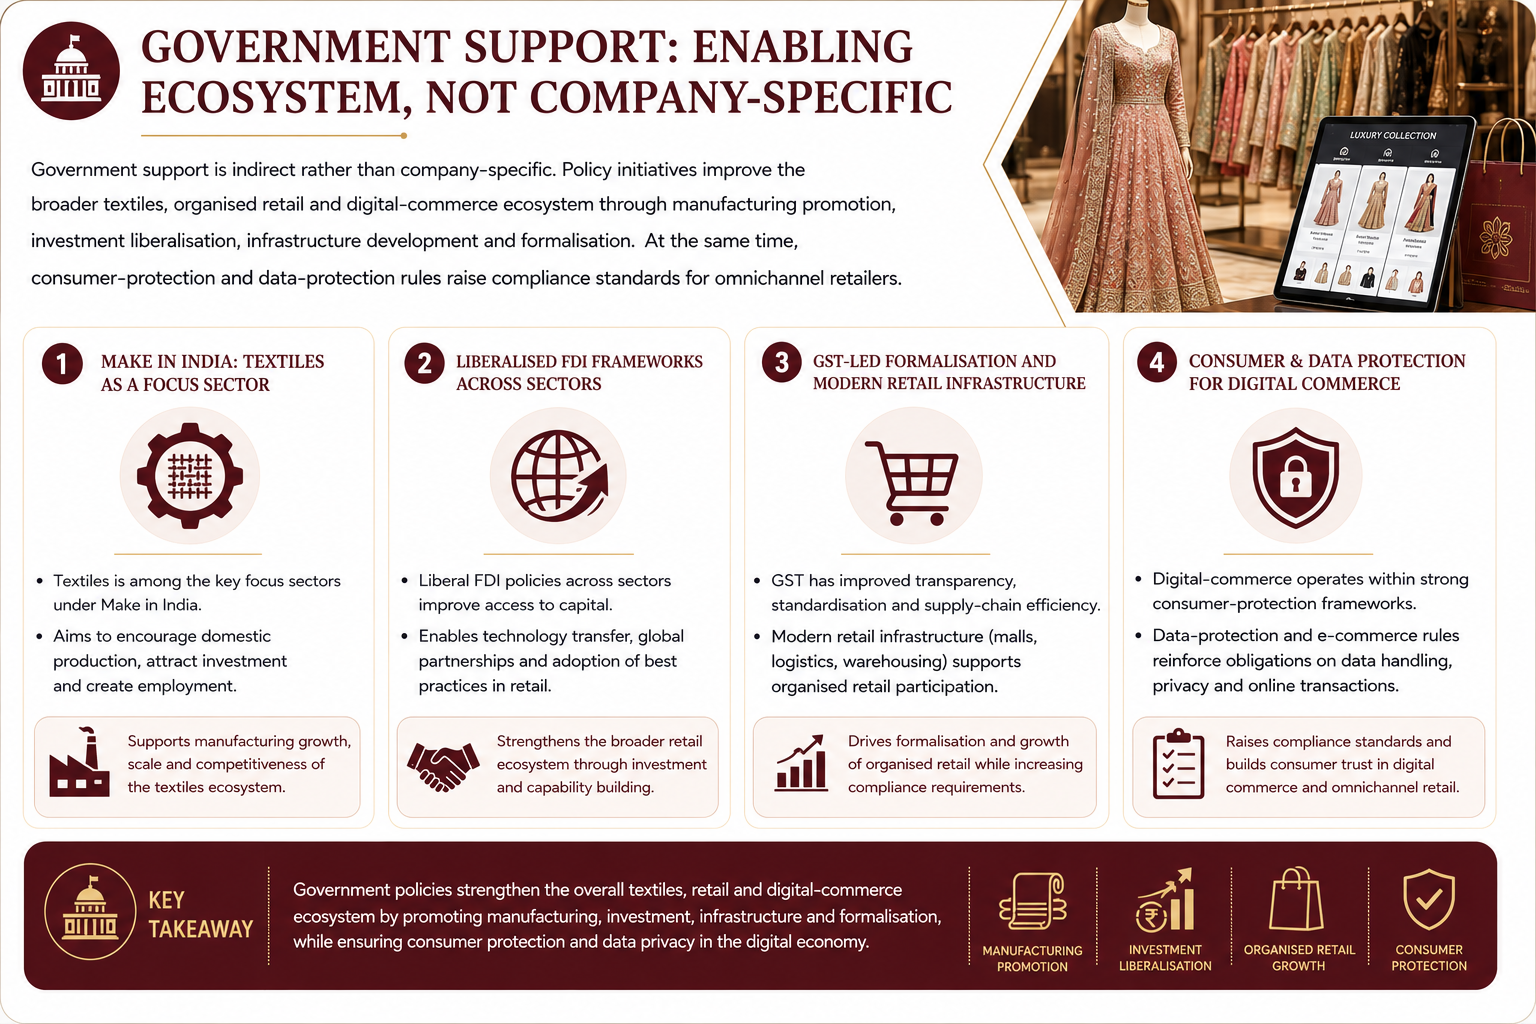
Government support is indirect rather than company-specific. Policy initiatives improve the broader textiles, organised retail and digital-commerce ecosystem through manufacturing promotion, investment liberalisation, infrastructure development and formalisation. At the same time, consumer-protection and data-protection rules raise compliance standards for omnichannel retailers.
The key policies are:
Make in India includes textiles among its focus sectors and seeks to encourage domestic production, investment and job creation
Liberalised FDI frameworks across several sectors improve access to capital, technology and global best practices, supporting the broader retail ecosystem
GST-led formalisation and modern retail infrastructure support greater transparency and organised retail participation, while also increasing compliance requirements
Digital-commerce businesses operate within consumer-protection, e-commerce and data-protection frameworks, reinforcing requirements around customer rights, data handling and online transactions
Fundraise/Future Plans
Shareholding
Pre-issue shareholding
Promoter Holding 0.0%
Post-Issue Shareholding
Promoter Holding 0.0%
Category
Pre-Issue%Post-Issue%
Promoters
Abhishek Agarwal
28.0%23.9%
Total Promoter Holding
28.0%23.9%
Additional Shareholders
Payal Kumari Agarwal
0.2%0.2%
Volrado Venture Partners Fund II
3.0%2.6%
Abhinav Agarwal
2.3%2.0%
Singularity Growth Opportunities Fund I
2.0%1.7%
Rajesh Kumar Soin
1.8%1.5%
Jitender Kumar Bansal
1.8%1.5%
Rahul Kayan
1.8%1.5%
NB Ventures Limited
1.7%1.4%
Total Additional Holding
14.6%12.4%
Total Shareholding
42.6%36.3%
- Overview
- Business
- Financial Highlights
- Industry Overview
- Fundraise/Future Plans
- Documentation
Get the Preqt App and keep in touch around the clock!
 Monitor your investments in real-time.
- Receive tailored deal suggestions.
- Get real-time updates and alerts.
