


Ravita Engineering Services
Precision in Climate SystemsBuilt for Critical Environments
IPO Summary (PreQT)
Ravita Engineering Services Limited provides engineering, procurement, installation and commissioning (EPIC) of HVAC and allied electro-mechanical systems, together with operations and maintenance (O&M), across onshore sites, offshore installations and data centres. FY26 revenue from operations reached INR 277.6 Cr, up 155.6%, with EBITDA of INR 40.0 Cr at a 14.4% margin and restated PAT of INR 28.0 Cr at a 10.1% total-income margin. The June 2026 order book was INR 491.1 Cr. The IPO consists entirely of 10,362,000 fresh shares, raising INR 108.8–116.1 Cr at INR 105–112; there is no OFS. Project expansion supports the growth case, while FY26 operating cash outflow of INR 46.9 Cr and disclosed governance matters are the main constraints.
IPO Review Rating
Above Avg
SMEEngineering Efficient Climate Infrastructure Through Integrated EPIC and O&M
Ravita Engineering presents a compelling growth story supported by a INR 491.1 crore order book, exposure to industrial HVAC, offshore projects and fast-growing data centres, and FY26 revenue and PAT of INR 277.6 crore and INR 28.0 crore. The IPO is entirely fresh issue, with proceeds directed towards working capital and heavy equipment, while valuation at approximately 15.0x post-issue FY26 earnings appears reasonable. However, investors should weigh concerns: FY26 operating cash flow was negative INR 46.9 crore, top-five customers contributed 78.7% of revenue, working-capital requirements are rising sharply, and material related-party equipment rentals exist.
Governance risk is elevated by the disclosed promoter-group ED matter. Overall, the IPO offers attractive growth and valuation, but warrants a measured approach until subscription quality, QIB participation, becomes visible.
The biggest positives are growth, order-book visibility, industry tailwinds, fresh-issue structure and reasonable valuation. The biggest negatives are cash-flow conversion, customer concentration, governance/related-party concerns and working-capital intensity
PARAMETER
WEIGHT
SCORE
KEY FACTORS
Financial Performance
40.0%
4.0/5
Profitability and growth are strong, but the quality of earnings is weakened materially by the negative operating cash flows and rapidly expanding working-capital requirements
Show more
Detailed Analysis
Revenue increased from INR 13.5 Cr in FY24 to INR 277.6 Cr in FY26, implying an extraordinary ~353.6% CAGR. However, this is partly a low-base effect and should not be extrapolated
FY26 EBITDA was ₹40.0 Cr with a 14.4% margin. Margins were stable at ~14.4% in FY25–FY26, though lower than FY24's 21.2%
PAT increased to INR 28.0 Cr in FY26, with a healthy 10.1% PAT margin
Debt/equity improved sharply to 0.2x in FY26, although it increased to approximately 0.3x by June 2026 as working-capital requirements rose
FY26 RoNW was extremely strong at 48.9%, although the ratio benefits from the Company's historically small equity base and recent capital restructuring
Despite reported profits, operating cash flow was negative INR 46.9 Cr in FY26, negative ₹8.9 Cr in FY25 and another negative INR 11.2 Cr in Q1FY27. This is the biggest financial weakness
Industry
15.0%
3.0/5
Ravita operates in a structurally attractive HVAC and electro-mechanical market, supported by infrastructure capex, industrialisation, energy-efficiency requirements and data-centre expansion. Strong growth prospects and meaningful entry barriers are positives, although competition remains intense
Show more
Detailed Analysis
India's HVAC EPC I&C market is projected to grow at approximately 15.9% CAGR during FY25–FY30, while HVAC O&M is projected at ~13.1%
Energy-efficiency standards, safety requirements and qualification criteria increase compliance requirements, but also create entry barriers for established operators
Ravita remains India-focused and is still geographically concentrated, particularly in Maharashtra, Gujarat and offshore territorial waters
Management
15.0%
3.0/5
Management combines long operating experience with a majority-independent Board, and the IPO involves no promoter OFS. However, recent promoter changes, material related-party machinery rentals and the disclosed promoter-group ED matter reduce the overall governance score
Show more
Detailed Analysis
Chairman Vibhoar Agrawal has over seven years of experience, while MD & CEO Sunildutt Goswami has more than 20 years of engineering experience and has been associated with Ravita since 2010
Three of the Company's five Directors are Independent Directors, giving a strong 60% independent Board, including two women Independent Directors
An ED matter relates to promoter-group entity Ganesh Infraworld and included provisional attachment of Vibhoar Agrawal's shares in that entity. Ravita also has disclosed GST and civil proceedings
Ravita leases machinery from group company Tykoon Mines GK Ltd. at approximately INR 3.7 Cr per month, making the related-party exposure material
Valuation
20.0%
4.0/5
At the upper band of ₹112, Ravita is valued at approximately 15.0x post-issue FY26 earnings and about 8.3x indicative EV/EBITDA. Valuation appears reasonable for the growth profile, though direct listed peer comparison is unavailable
Show more
Detailed Analysis
Post-issue FY26 P/E of approximately 15.0x is reasonable in absolute terms, although there is no direct listed peer benchmark
Indicative FY26 EV/EBITDA is approximately 8.3x, which appears attractive given the Company's growth and industry outlook
P/B was approximately 2.8x on June 2026 NAV, falling materially on a theoretical post-fresh-capital basis
FY26 RoNW was 48.9%, while weighted-average RoNW disclosed in the RHP is 77.0%
Merchant Banker Track Record
10.0%
4.0/5
The sole BRLM is Vivro Financial Services Private Limited. The RHP provides price-performance data for 11 SME IPOs handled by Vivro during the current financial year and two preceding financial years. No Mainboard IPOs are disclosed for this period
Show more
Detailed Analysis
8 of 11 IPOs (72.7%) opened above issue price. Average opening return was approximately 45.6%, although a few exceptional listings materially lift the average
7 of 11 IPOs traded above issue price after 30 days. Strong outcomes in Fabtech, FlySBS, Ganesh, Shanti and Spunweb were partly offset by losses in four issues
Among the nine IPOs with available 180-day data, 5 remained positive and 4 were negative, indicating that strong listing performance has not always translated into sustained aftermarket returns
TOTAL
100%
3.7/5
Weighted Composite Score
Issue Price
₹105.0 to ₹112.0
As of 9 Oct 2026
GMP
₹0.0
As of 9 Oct 2026
Estimated Gain / Loss
0.0%
Lot Size
1,200.0 Shares
Grey Market Premium (GMPs) are shared for knowledge purpose only. PrEqt doesn’t promote or execute the trades.
| Issue Size (in Cr) | |
|---|---|
| Overall | ₹110.0 Cr |
| Fresh Issue | ₹110.0 Cr |
| Offer for Sale | ₹0.0 Cr |
Minimum Investment
₹2,68,800.0 / 14,40,000 shares

Merchant Banker
Vivro Financial Services Pvt.Ltd.
Vivro Financial Services Pvt.Ltd.
IPO Document
Offer Start Date
Offer End Date
Valuation
Revenue (FY'26)
PAT (FY'26)
Issue Size (in Cr)
Face Value
₹ 5.0Offer Price
₹ 112.0Lot Size
1,200.0 sharesSale Type
Fresh capital onlyPAT (FY'26)
₹ 28.0 CrPAT Margin (FY'26)
10.1 %P/E Multiple
15.0xEBITDA (FY'26)
₹ 40.0 CrCAGR Growth 2Y
353.6 %ROE (FY'26)
48.9 %ROCE (FY'26)
48.7 %Price to Book Value
2.8xDebt/Equity
0.2xCompany Website
ravita.co.inExplore new deals
Overview
Fund Allocation
Total: ₹0 CrSource:Company DRHP
Timeline
IPO Open Date
To Be Announced
IPO Close Date
To Be Announced
Tentative Allotment
To Be Announced
Initiation of Refunds
To Be Announced
Credit of Shares to Demat
To Be Announced
Tentative Listing Date
To Be Announced
Business
Business Model
Geographical Presence
Sales Channel
Key Risk Factors
Financial Highlights
Income Statement
Revenue growth with EBITDA and PAT margins
| Financial Metric | FY 2024 | FY 2025 | FY 2026 |
|---|---|---|---|
| Revenue (₹ Cr) | 13.5 | 108.6 | 277.6 |
| Growth (%) | - | 705.0% | 155.6% |
| EBITDA (₹ Cr) | 2.9 | 15.7 | 40.0 |
| EBITDA Margin (%) | 21.2% | 14.4% | 14.4% |
| PAT (₹ Cr) | 1.5 | 11.8 | 28.0 |
| PAT Margin (%) | 11.1% | 10.8% | 10.1% |
OBSERVATIONS & INSIGHTS
FY25 revenue grew 705.0% and FY26 155.6%. The FY24–FY26 CAGR is 353.6%, spanning two compounding intervals and a small starting base. The RHP attributes FY26 growth to new and repeat orders and higher execution, particularly onshore project revenue of INR 145.4 Cr compared with INR 39.3 Cr in FY25
EBITDA rose from INR 2.9 Cr to INR 15.7 Cr and INR 40.0 Cr, a FY24–FY26 CAGR of 274.1%. FY26 growth was approximately 155.9%, broadly matching operating revenue growth
Restated PAT grew 684.3% in FY25 and 137.1% in FY26 to INR 28.0 Cr; the two-interval CAGR was 331.2%. FY26 absolute earnings growth is strong, although it is below revenue and EBITDA growth. PAT margin on total income fell from 11.1% to 10.8% and 10.1%. FY26 depreciation increased to INR 2.0 Cr from INR 0.2 Cr, while finance cost rose to INR 0.7 Cr from INR 0.3 Cr. FY25 also included INR 0.6 Cr from keyman-insurance encashment that did not recur in FY26
Balance Sheet
| Financial Metric | FY 2024 | FY 2025 | FY 2026 |
|---|---|---|---|
| Net Worth | ₹ 3.3 Cr | ₹ 15.1 Cr | ₹ 99.6 Cr |
| Total Assets | ₹ 9.1 Cr | ₹ 58.2 Cr | ₹ 163.0 Cr |
| Reserves & Surplus | ₹ 3.2 Cr | ₹ 15.0 Cr | ₹ 85.9 Cr |
OBSERVATIONS & INSIGHTS
Net worth increased from ₹3.3 Cr in FY24 to ₹99.6 Cr in FY26, supported by ₹56.4 Cr of fresh equity funding and retained profits
Total assets rose from ₹9.1 Cr to ₹163.0 Cr. Receivables, inventory and short-term advances accounted for 88.6% of FY26 assets, making collections and working-capital management critical
Equity funded 61.1% of total assets in FY26 versus 26.0% in FY25, strengthening the balance sheet; liquidity still depends on converting operating assets into cash
Cash Flow
| Financial Metric | FY 2024 | FY 2025 | FY 2026 |
|---|---|---|---|
CFO (₹ Cr) Cash generated from core business operations. | +0.2 Cr | -8.9 Cr | -46.9 Cr |
CFI (₹ Cr) Cash used for investments and long-term assets. | +0.0 Cr | -10.0 Cr | -0.2 Cr |
CFF (₹ Cr) Cash flow related to funding and borrowings. | -3.3 Cr | +19.2 Cr | +51.8 Cr |
Working Capital
| Efficiency Metric | FY 2023 | FY 2024 | FY 2025 |
|---|---|---|---|
Debtor Days Average number of days taken to collect customer payments. | - | - | - |
Creditor Days Average time taken to pay suppliers and vendors. | - | - | - |
Inventory Days Average number of days inventory remains unsold. | - | - | - |
CCC (Cash Conversion Cycle) (Debtor Days + Inventory Days - Creditor Days) | - | - | - |
Financial Ratios
Measures the company’s leverage relative to shareholder equity.
OBSERVATIONS & INSIGHTS
The FY26 improvement reflects enlarged receivables, inventory and advances as well as equity funding. It is a liquidity-coverage measure, not evidence that current assets can be collected immediately. The 2026 ratio fell to 2.5 times
FY26 net debt on this basis was INR 19.2 Cr. FY26 net debt/equity increased to 0.2 times
ROE rose to 128.3% in FY25 from 59.1%, then fell to 48.9% as the equity base expanded through FY26 funding and retained profit
ROCE was 35.1% for FY25 and 25.4% for FY26. FY24 is N.A. because a complete FY23 restated asset total on the same basis was not available in the reviewed statements
Interest coverage rose to 53.2 times. High coverage demonstrates a large accounting earnings cushion relative to the recorded finance charge. It does not offset negative CFO or eliminate the need for guarantees and short-term funding.
Industry Overview
Industry Drivers
Manufacturing and commercial infrastructure investment
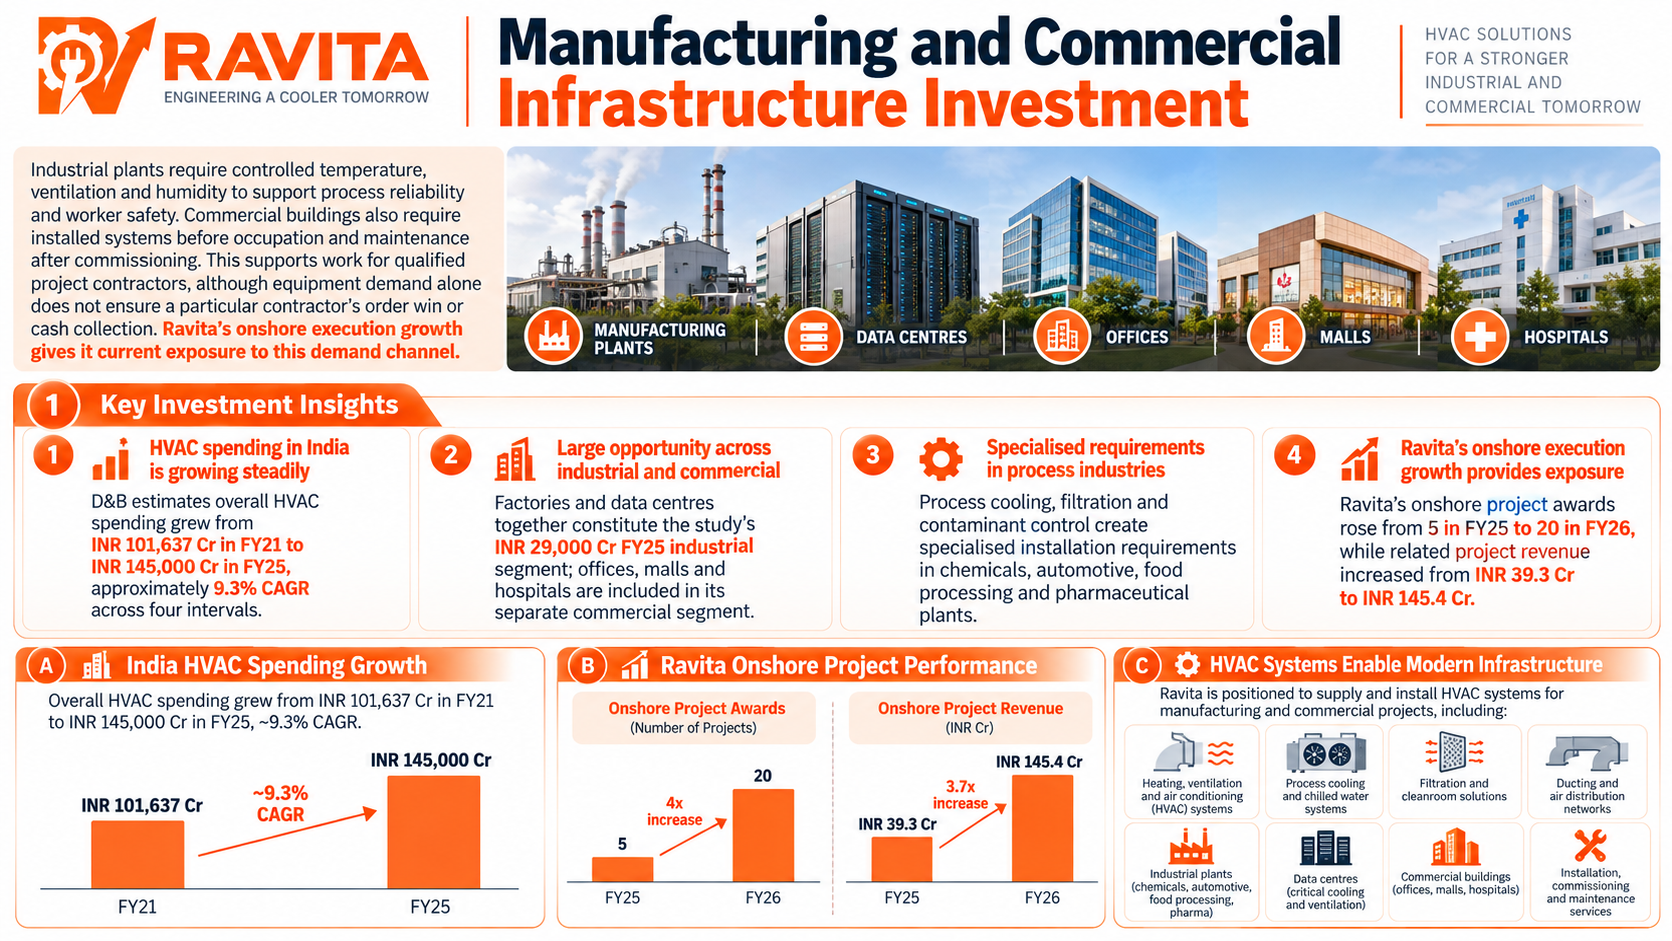
Industrial plants require controlled temperature, ventilation and humidity to support process reliability and worker safety. Commercial buildings also require installed systems before occupation and maintenance after commissioning. This supports work for qualified project contractors, although equipment demand alone does not ensure a particular contractor’s order win or cash collection. Ravita’s onshore execution growth gives it current exposure to this demand channel.
The key drivers are:
D&B estimates overall HVAC spending grew from INR 101,637 Cr in FY21 to INR 145,000 Cr in FY25, approximately 9.3% CAGR across four intervals
Factories and data centres together constitute the study’s INR 29,000 Cr FY25 industrial segment; offices, malls and hospitals are included in its separate commercial segment
Process cooling, filtration and contaminant control create specialised installation requirements in chemicals, automotive, food processing and pharmaceutical plants
Ravita’s onshore project awards rose from five in FY25 to 20 in FY26, while related project revenue increased from INR 39.3 Cr to INR 145.4 Cr
Data centres and mission-critical cooling
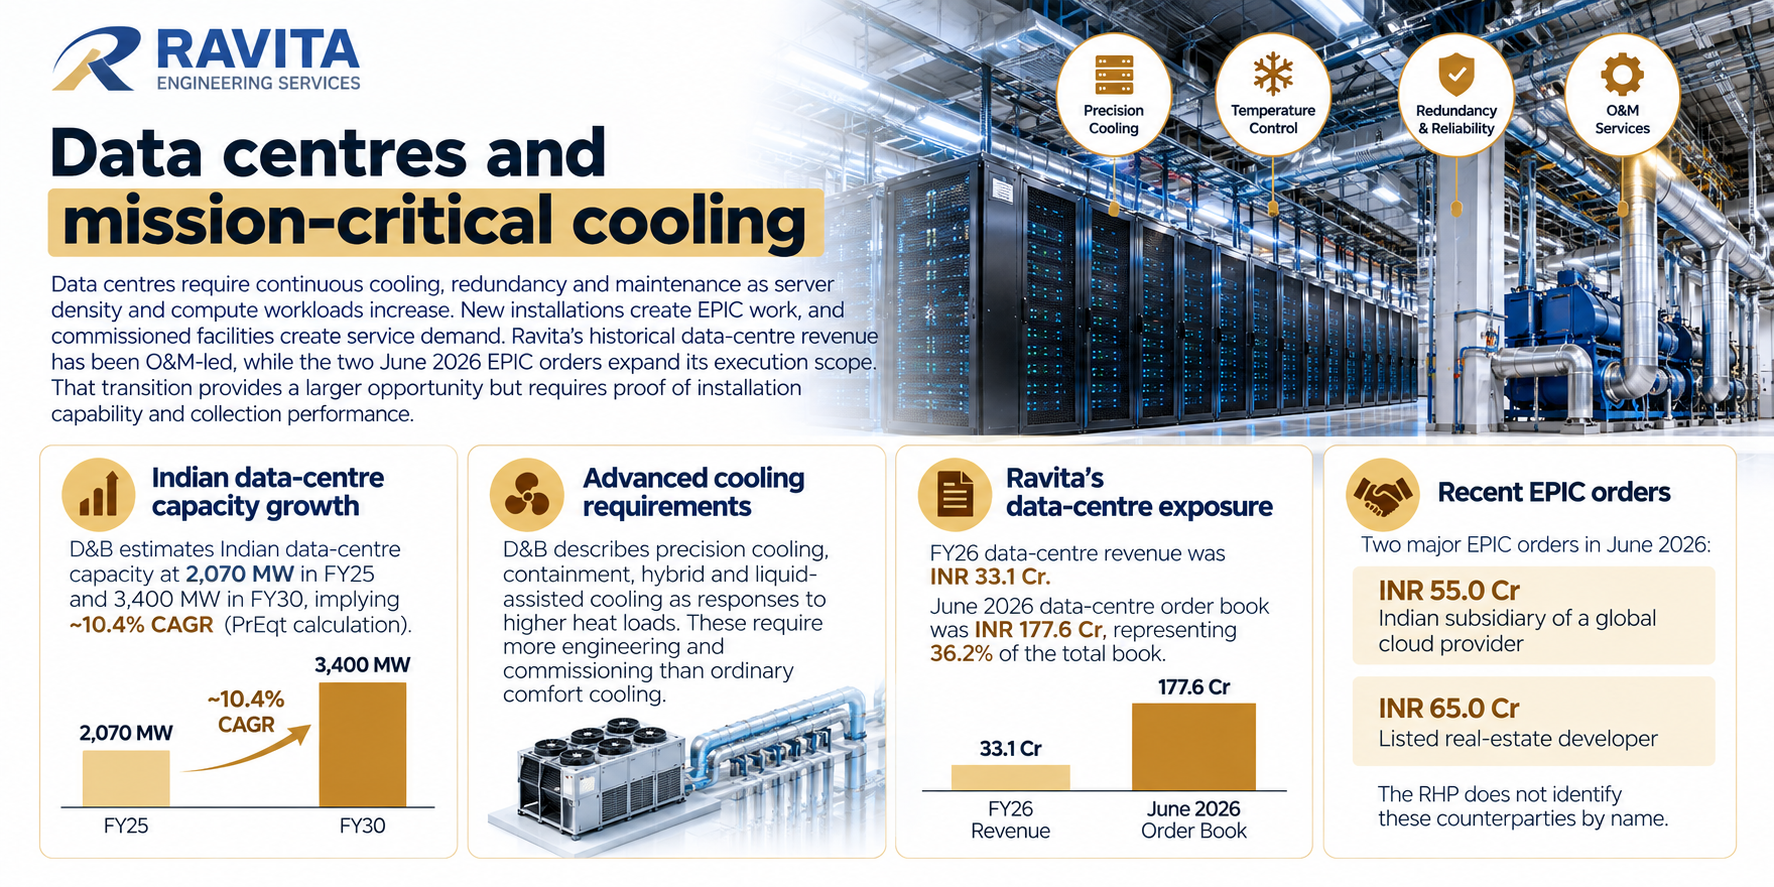
Data centres require continuous cooling, redundancy and maintenance as server density and compute workloads increase. New installations create EPIC work, and commissioned facilities create service demand. Ravita’s historical data-centre revenue has been O&M-led, while the two June 2026 EPIC orders expand its execution scope. That transition provides a larger opportunity but requires proof of installation capability and collection performance.
The key drivers are:
The D&B chart estimates Indian data-centre capacity at 2,070 MW in FY25 and projects 3,400 MW in FY30; these endpoints imply approximately 10.4% CAGR
D&B describes precision cooling, containment, hybrid and liquid-assisted cooling as responses to higher heat loads. These require more engineering and commissioning than ordinary comfort cooling
FY26 Ravita data-centre revenue was INR 33.1 Cr. Its June 2026 data-centre order book was INR 177.6 Cr, or 36.2% of the total book
Installed systems support lifecycle O&M
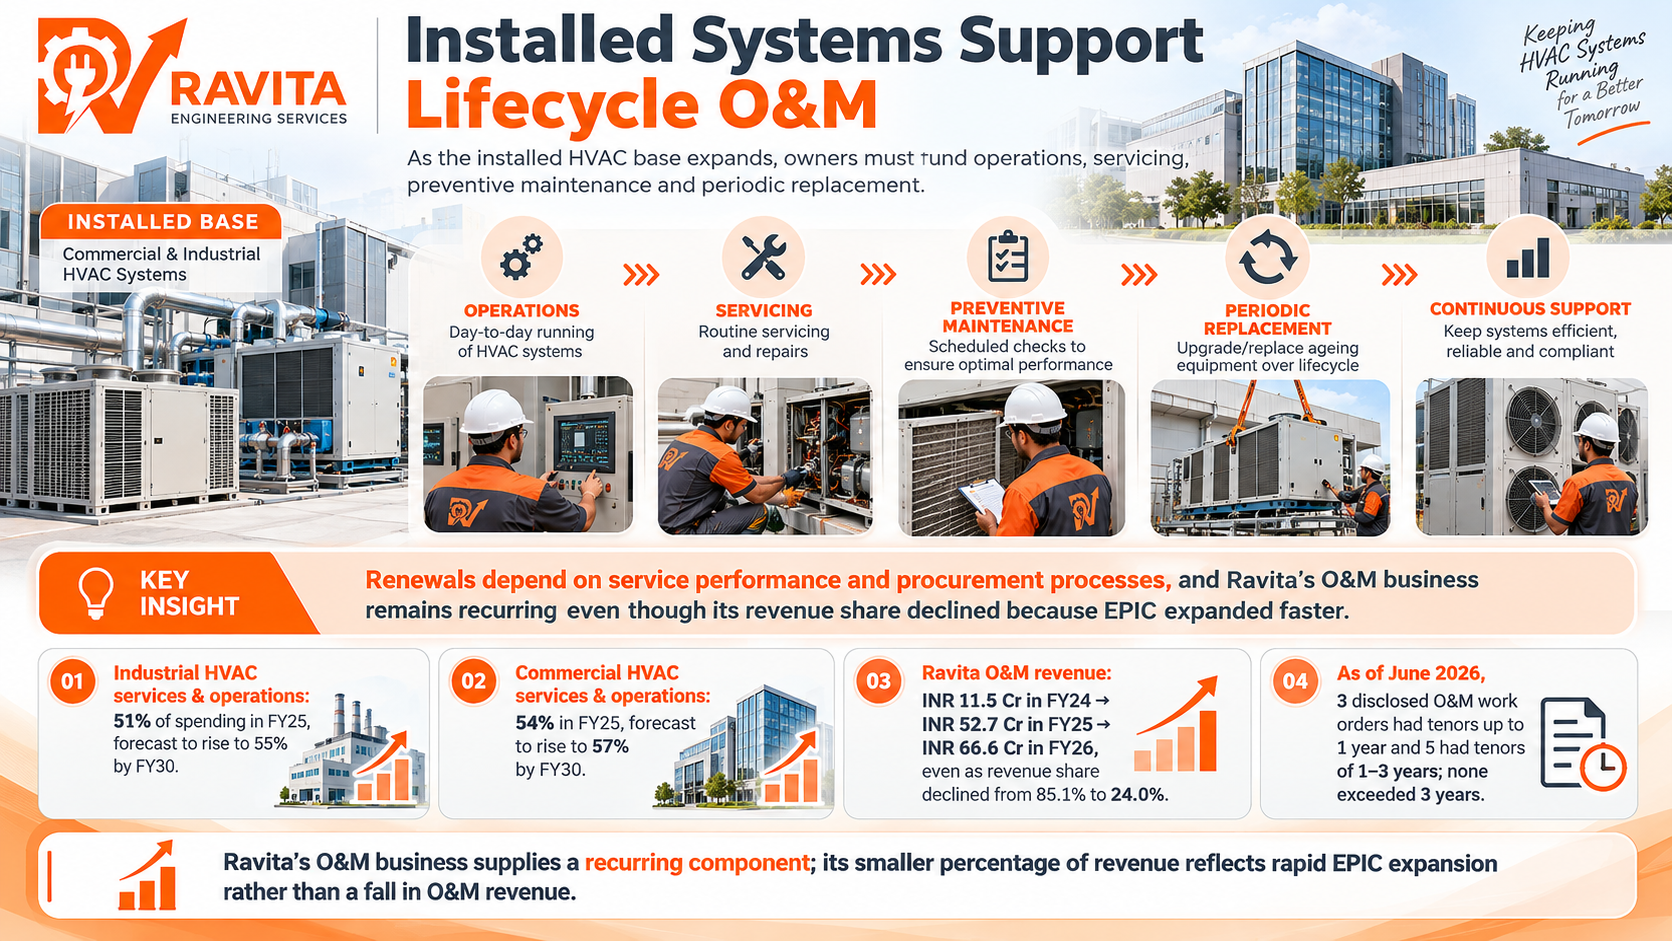
As the installed HVAC base expands, owners must fund operations, servicing, preventive maintenance and periodic replacement. Contractors familiar with a site’s systems can win renewals, but those renewals depend on service performance and procurement processes. Ravita’s O&M business supplies a recurring component; its smaller percentage of revenue reflects rapid EPIC expansion rather than a fall in O&M revenue.
The key drivers are:
D&B estimates industrial HVAC services and operations at 51% of spending in FY25, rising to a forecast 55% by FY30
Commercial HVAC services and operations are estimated at 54% in FY25 and forecast at 57% in FY30
Ravita’s O&M revenue increased from INR 11.5 Cr in FY24 to INR 52.7 Cr in FY25 and INR 66.6 Cr in FY26, despite its share declining from 85.1% to 24.0%
Risks in the Industry
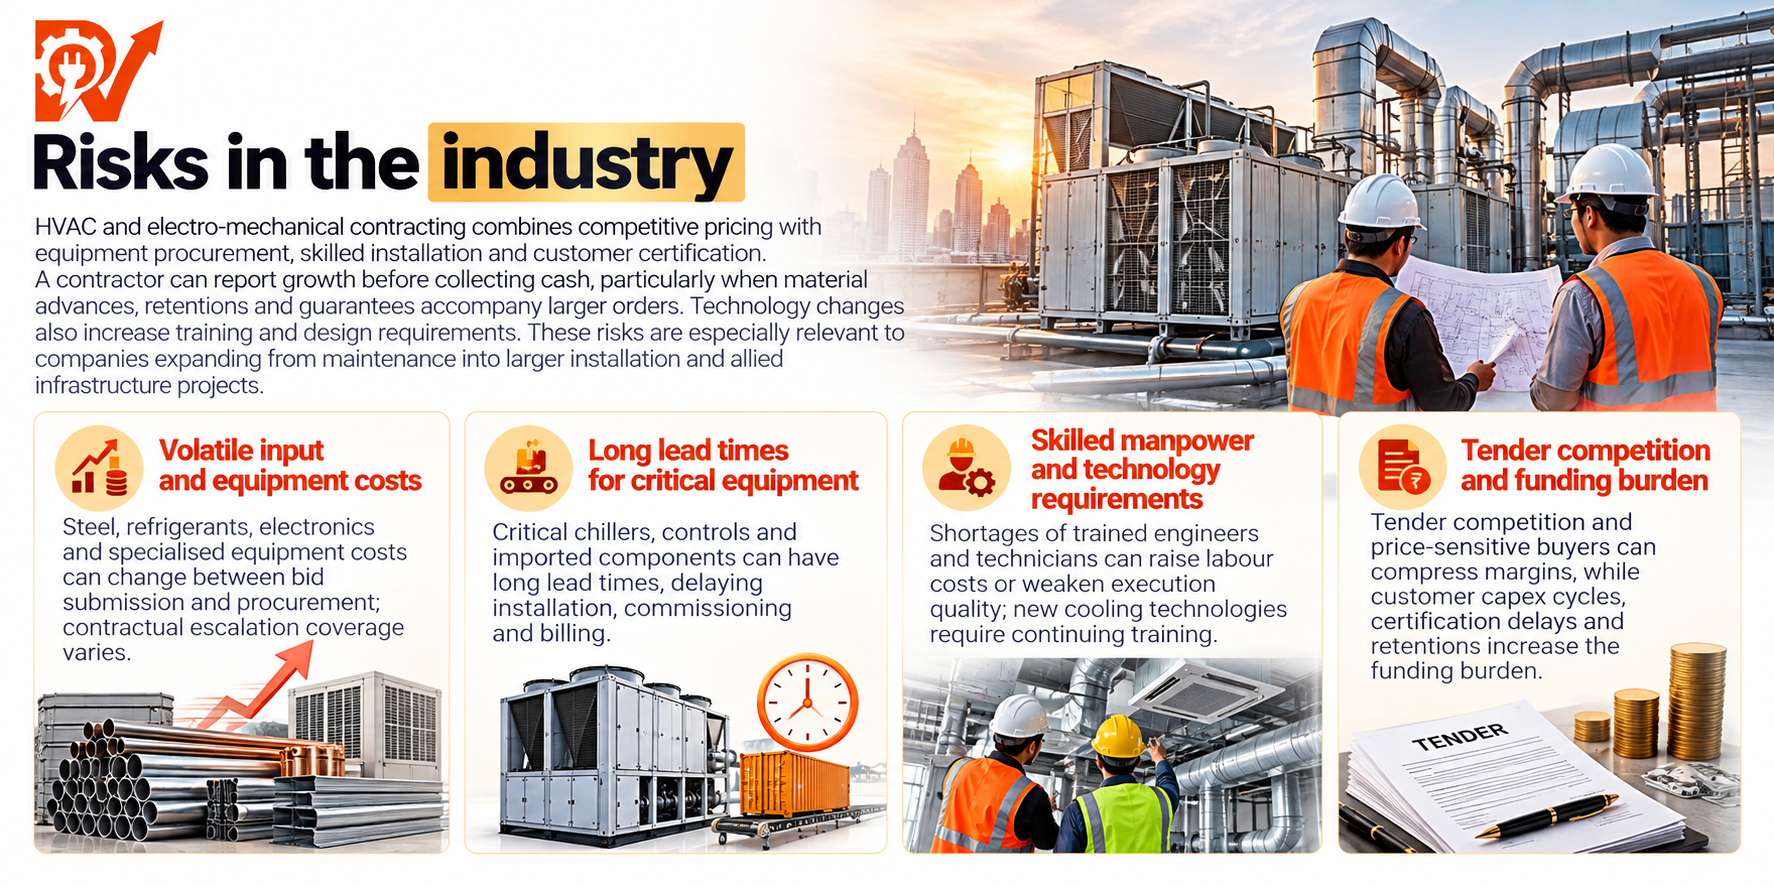
HVAC and electro-mechanical contracting combines competitive pricing with equipment procurement, skilled installation and customer certification. A contractor can report growth before collecting cash, particularly when material advances, retentions and guarantees accompany larger orders. Technology changes also increase training and design requirements. These risks are especially relevant to companies expanding from maintenance into larger installation and allied infrastructure projects.
The key risks are:
Steel, refrigerants, electronics and specialised equipment costs can change between bid submission and procurement; contractual escalation coverage varies
Critical chillers, controls and imported components can have long lead times, delaying installation, commissioning and billing
Shortages of trained engineers and technicians can raise labour costs or weaken execution quality; new cooling technologies require continuing training
Tender competition and price-sensitive buyers can compress margins, while customer capex cycles, certification delays and retentions increase the funding burden
Government Policy Support
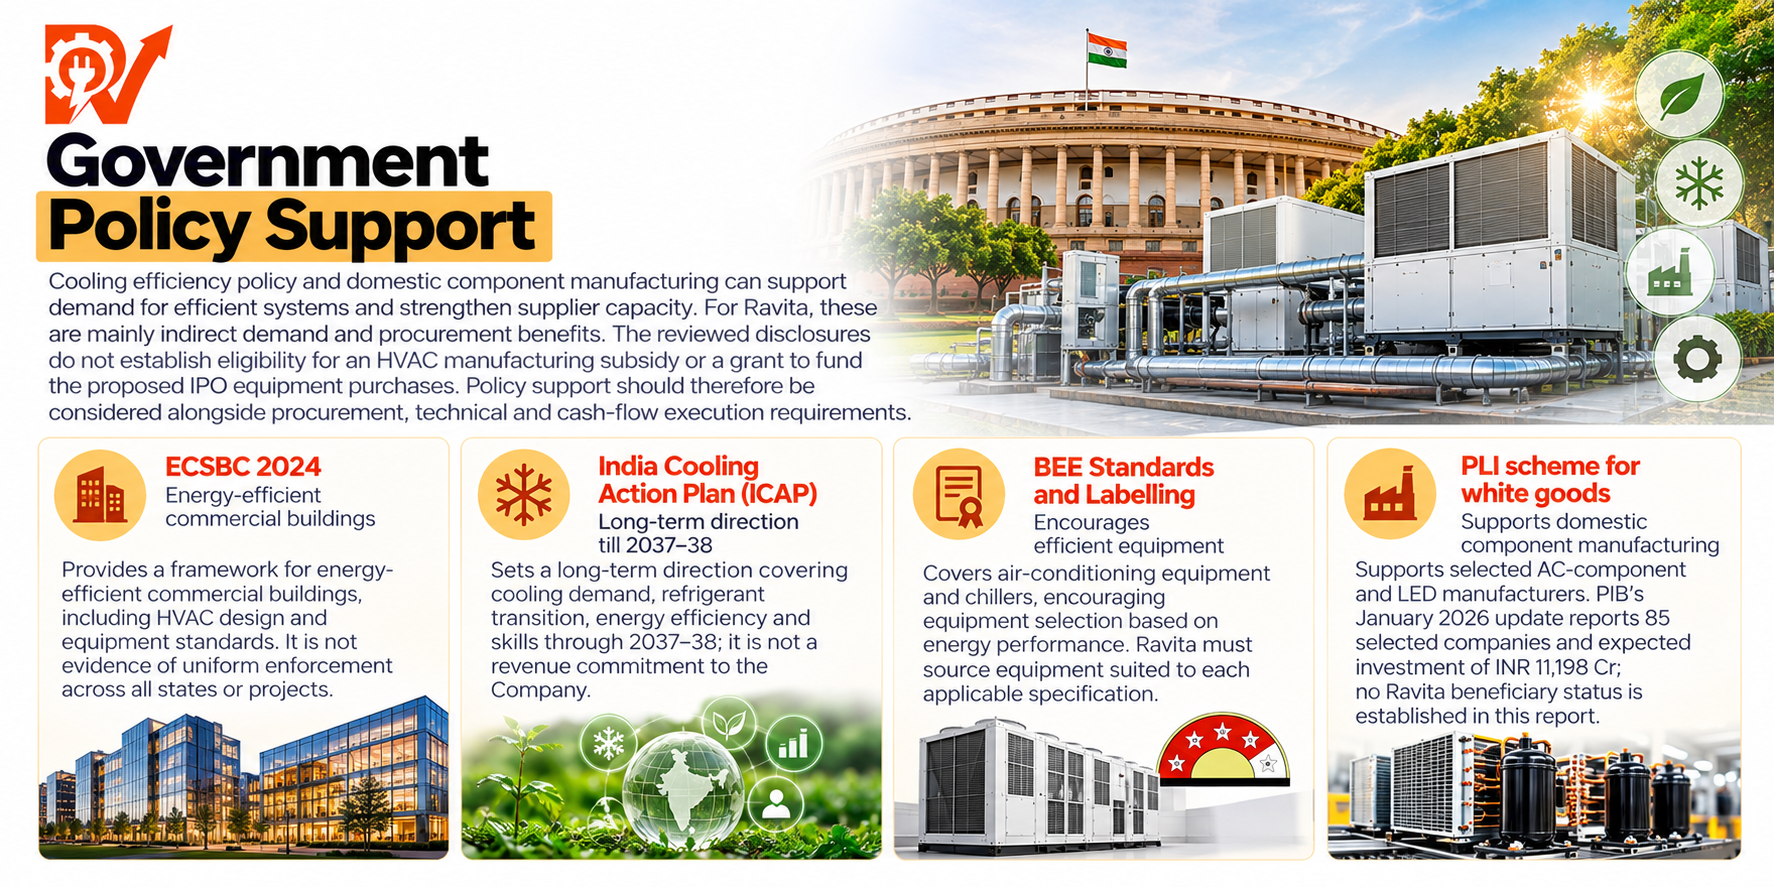
Cooling efficiency policy and domestic component manufacturing can support demand for efficient systems and strengthen supplier capacity. For Ravita, these are mainly indirect demand and procurement benefits. The reviewed disclosures do not establish eligibility for an HVAC manufacturing subsidy or a grant to fund the proposed IPO equipment purchases. Policy support should therefore be considered alongside procurement, technical and cash-flow execution requirements.
The key policies are:
ECSBC 2024 provides a framework for energy-efficient commercial buildings, including HVAC design and equipment standards. It is not evidence of uniform enforcement across all states or projects
The India Cooling Action Plan sets a long-term direction covering cooling demand, refrigerant transition, energy efficiency and skills through 2037–38; it is not a revenue commitment to the Company
BEE’s Standards and Labelling programme covers air-conditioning equipment and chillers, encouraging equipment selection based on energy performance. Ravita must source equipment suited to each applicable specification
The PLI scheme for white goods supports selected AC-component and LED manufacturers. PIB’s January 2026 update reports 85 selected companies and expected investment of INR 11,198 Cr; no Ravita beneficiary status is established in this report
Fundraise/Future Plans
Shareholding
Pre-issue shareholding
Promoter Holding 0.0%
Post-Issue Shareholding
Promoter Holding 0.0%
Category
Pre-Issue%Post-Issue%
Promoters
Vibhoar Agrawal
20.9%15.1%
Rachita Agrawal
47.0%34.1%
Starwings Realtors Private Limited
5.2%3.7%
Total Promoter Holding
73.1%52.9%
Additional Shareholders
Other Shareholders
27.0%47.1%
Total Additional Holding
27.0%47.1%
Total Shareholding
100.1%100.0%
- Overview
- Business
- Financial Highlights
- Industry Overview
- Fundraise/Future Plans
- Documentation
Get the Preqt App and keep in touch around the clock!
 Monitor your investments in real-time.
- Receive tailored deal suggestions.
- Get real-time updates and alerts.
