

Rays of Belief
Empowering Every ChildCare Beyond Boundaries
IPO Summary (PrEqT)
Rays of Belief Limited, operating under the Mom's Belief brand, is a For-Profit Social Enterprise providing personalised intervention plans and therapy-led support for children with neurodevelopmental disorders through a multi-centre, licensed-professional, school-collaboration and digital model. FY26 consolidated revenue from operations reached INR 81.7 Cr, EBITDA margin expanded to 14.6% and PAT was INR 5.0 Cr; however, FY26 is not directly comparable with FY25 because the June 2025 US acquisition contributed INR 34.1 Cr, or 41.7% of revenue. The IPO is a 100% fresh issue of 52,30,000 shares; at INR 239.0, post-issue market capitalisation is approximately INR 499.6 Cr and FY26 P/E is about 74.5x. The investment case combines a large domestic centre network, improving operating margins and a sizeable expansion plan, offset by acquisition-led comparability, negative operating cash flow, related-party export concentration, leased-centre execution risk and a high absolute earnings multiple.
IPO Review Rating
Above Avg
MainboardMaking Specialized Child Therapy Accessible Across Communities and Families
Rays of Belief has built a differentiated NDD-care platform with 139 centres and 58,000+ children served, giving it meaningful organised scale in an underpenetrated segment. Reported Revenue increased sharply from INR 30.6 Cr in FY24 to INR 81.7 Cr in FY26, while EBITDA increased from INR 1.5 Cr to INR 11.9 Cr and EBITDA margin reached 14.6%. However, a substantial part of FY26 growth came from the US acquisition; against FY25 pro-forma Revenue of INR 73.1 Cr, comparable growth was only around 11.6%. Earnings quality is another monitorable because FY25 PAT was supported by a INR 5.5 Cr deferred-tax credit, while OCF remained negative at INR 1.9 Cr in FY26 despite positive reported profits. The balance sheet is a clear strength, with only INR 3.6 Cr of borrowings and 0.1x D/E, providing capacity to fund expansion without excessive leverage. Governance structure is broadly strong with 60.0% Board independence, zero promoter pledge and INR 0.0 Cr OFS, but 25.6% of FY26 Revenue came from promoter-linked entities, which is a material concentration risk. Overall, Rays of Belief presents a strong growth and social-healthcare proposition with low leverage and an emerging-market leadership position, but the investment case requires successful expansion and significant future earnings growth to justify the current valuation.
PARAMETER
WEIGHT
SCORE
KEY FACTORS
Financial Performance
40.0%
4.0/5
Financial performance has improved materially, with Revenue increasing from INR 30.6 Cr in FY24 to INR 81.7 Cr in FY26, EBITDA increasing from INR 1.5 Cr to INR 11.9 Cr, and EBITDA margin expanding from 4.9% to 14.6%.
Show more
Detailed Analysis
Revenue increased from INR 30.6 Cr in FY24 to INR 36.4 Cr in FY25 and INR 81.7 Cr in FY26, representing reported FY24–FY26 CAGR of 63.3%
EBITDA increased from INR 1.5 Cr in FY24 to INR 3.0 Cr in FY25 and INR 11.9 Cr in FY26, while EBITDA margin expanded from 4.9% to 8.3% and 14.6%, respectively
PAT increased from INR 0.9 Cr in FY24 to INR 5.9 Cr in FY25, before declining to INR 5.0 Cr in FY26; FY26 PAT margin stood at 6.1% versus 16.2% in FY25
FY26 total borrowings were only INR 3.6 Cr against total equity of INR 30.8 Cr, resulting in a low 0.1x D/E
ROE improved from 16.8% in FY24 to 56.6% in FY25 and stood at 21.6% in FY26
OCF declined from positive INR 2.1 Cr in FY24 to negative INR 1.8 Cr in FY25 and negative INR 1.9 Cr in FY26
Promoter-related export revenue was INR 20.9 Cr / 25.6% of FY26 revenue, but the RHP does not establish whether either counterparty was the Company's largest overall customer
Industry
15.0%
3.0/5
The Company operates in an emerging and underpenetrated healthcare segment, with India's NDD therapy market estimated at approximately INR 5,262.3 Cr in CY25.
Show more
Detailed Analysis
India's NDD therapy market was approximately INR 5,262.3 Cr in CY25; ASD, ADHD and CP formed 72.7% / INR 3,815.0 Cr and are forecast to grow at approximately 5.6–6.5% CAGR, while DD and speech therapy are projected at 10.9% and 11.8% CAGR
Indian behavioural-health/NDD intervention market is described as nascent but expanding, supported by rising diagnosis, awareness and professional treatment adoption
India has the RPWD framework, health/education policies and CDSCO/ICMR oversight, but still lacks unified nationwide clinical guidelines for NDD care
Management
15.0%
4.0/5
Management and formal governance are relatively strong, with 19 years of promoter experience, 60.0% Board independence, zero promoter pledging and no promoter OFS.
Show more
Detailed Analysis
Nitin Bindlish has 19 years total prior experience, including 11 years in healthcare, and has been Founder & CEO since 2017
Board comprises 5 Directors, including 3 Independent Directors which gives 60.0% independence
0 promoter shares pledged/encumbered; no criminal, regulatory or tax proceedings disclosed against promoters/directors
Related-party export revenue was INR 20.9 Cr in FY26, representing 25.6% of revenue
Valuation
20.0%
3.0/5
Valuation is the weakest and least determinable part of the score. At INR 239.0, Rays trades at approximately 74.5x historical FY26 P/E, 15.3x P/B and 41.7x indicative EV/EBITDA, all of which are demanding in absolute terms
Show more
Detailed Analysis
At INR 239.0, historical FY26 P/E is 74.5x, but RHP states there is no directly comparable listed peer
Indicative FY26 EV/EBITDA is 41.7x, but no directly comparable listed peer exists for relative scoring
Price of INR 239.0 versus FY26 NAV of INR 15.7 implies approximately 15.3x P/B
RoNW stood at 21.6% in FY26, versus 56.6% in FY25 and 16.8% in FY24
Merchant Banker Track Record
10.0%
4.0/5
Mefcom's recent disclosed IPO delivered strong numerical outcomes, with 28.3% listing appreciation and 86.0x subscription, producing a high mechanical score of 8.8/10.0. However, this is based on only 1 recent issue, so confidence in the score is substantially lower than for an institutional BRLM with a long track record across multiple IPOs.
Show more
Detailed Analysis
Globe Civil Projects listed/opened at INR 91.1 versus INR 71.0 issue price, generating approximately 28.3% listing gain
Globe Civil Projects received 86.0x overall subscription, including 99.8x QIB and 143.2x NII
Recent disclosed track record comprises 1 completed IPO and 1 positive listing which means 100.0% mechanical success rate
Mefcom has only 1 public issue in the recent RHP-disclosed track-record period
TOTAL
100%
3.6/5
Weighted Composite Score
Issue Price
₹227.0 to ₹239.0
As of 29 Aug 2026
GMP
₹0.0
As of 29 Aug 2026
Estimated Gain / Loss
0.0%
Lot Size
62.0 Shares
Grey Market Premium (GMPs) are shared for knowledge purpose only. PrEqt doesn’t promote or execute the trades.
| Issue Size (in Cr) | |
|---|---|
| Overall | ₹125.0 Cr |
| Fresh Issue | ₹125.0 Cr |
| Offer for Sale | ₹0.0 Cr |
Minimum Investment
₹14,818.0 / 3,844 shares

Merchant Banker
Mefcom Capital Markets Ltd.
IPO Document
RHP / Anchor Document
Offer Start Date
1st Sept 2026
Offer End Date
3rd Sept 2026
Valuation
₹499.6 Cr
Revenue
₹82.1 Cr
PAT (FY'26)
₹5.0 Cr
Issue Size (in Cr)
₹125.0 Cr
Face Value
₹ 10.0Offer Price
₹ 239.0Lot Size
62.0 sharesSale Type
Fresh capital onlyPAT (FY'26)
₹ 5.0 CrPAT Margin (FY'26)
6.1 %P/E Multiple
74.5xEBITDA (FY'26)
₹ 11.9 CrCAGR Growth 2Y
63.3 %ROE (FY'26)
21.6 %ROCE (FY'26)
29.7 %Price to Book Value
15.3xDebt/Equity
0.1xCompany Website
www.momsbelief.comExplore new deals
Overview
Fund Allocation
Total: ₹0 CrSource:Company DRHP
Timeline
IPO Open Date
To Be Announced
IPO Close Date
To Be Announced
Tentative Allotment
To Be Announced
Initiation of Refunds
To Be Announced
Credit of Shares to Demat
To Be Announced
Tentative Listing Date
To Be Announced
Business
Business Model
Geographical Presence
Sales Channel
Key Risk Factor
Financial Highlights
Income Statement
Revenue growth with EBITDA and PAT margins
| Financial Metric | FY 2024 | FY 2025 | FY 2026 |
|---|---|---|---|
| Revenue (₹ Cr) | 30.8 | 36.5 | 82.1 |
| Growth (%) | - | 19.0% | 124.2% |
| EBITDA (₹ Cr) | 1.5 | 3.0 | 11.9 |
| EBITDA Margin (%) | 4.9% | 8.3% | 14.6% |
| PAT (₹ Cr) | 0.9 | 5.9 | 5.0 |
| PAT Margin (%) | 2.8% | 16.2% | 6.1% |
OBSERVATIONS & INSIGHTS
Revenue increased from INR 30.6 Cr in FY24 to INR 81.7 Cr in FY26. The FY26 step-up is materially influenced by the consolidation of three acquired US centres
EBITDA increased from INR 1.5 Cr in FY24 to INR 11.9 Cr in FY26, supported by higher scale and the inclusion of overseas operations
PAT rose to INR 5.9 Cr in FY25 but declined to INR 5.0 Cr in FY26 despite stronger operations. FY25 PBT was only INR 0.3 Cr and PAT benefited from a deferred-tax credit of INR 5.5 Cr; FY26 carried current and deferred tax expenses
Balance Sheet
| Financial Metric | FY 2024 | FY 2025 | FY 2026 |
|---|---|---|---|
| Net Worth | ₹ 5.8 Cr | ₹ 15.0 Cr | ₹ 30.8 Cr |
| Total Assets | ₹ 12.9 Cr | ₹ 26.1 Cr | ₹ 50.9 Cr |
| Total Borrowing | ₹ 0.0 Cr | ₹ 4.4 Cr | ₹ 3.6 Cr |
| Reserves & Surplus | ₹ 5.5 Cr | ₹ 14.7 Cr | ₹ 15.2 Cr |
OBSERVATIONS & INSIGHTS
Total Equity increased from INR 5.8 Cr to INR 30.8 Cr, driven by capital issuances, bonus capitalisation and retained/other equity movements
Total Assets increased from INR 12.9 Cr in FY24 to INR 50.9 Cr in FY26, reflecting both organic scale-up and the FY26 acquisition/consolidation
Total Borrowings gross borrowings were nil in FY24, INR 4.4 Cr in FY25 and INR 3.6 Cr in FY26; leverage therefore remains low relative to equity
Cash Flow
| Financial Metric | FY 2024 | FY 2025 | FY 2026 |
|---|---|---|---|
CFO (₹ Cr) Cash generated from core business operations. | +2.1 Cr | -1.8 Cr | -1.9 Cr |
CFI (₹ Cr) Cash used for investments and long-term assets. | -2.7 Cr | -2.0 Cr | -6.2 Cr |
CFF (₹ Cr) Cash flow related to funding and borrowings. | +1.0 Cr | +4.9 Cr | +6.0 Cr |
Working Capital
| Efficiency Metric | FY 2023 | FY 2024 | FY 2025 |
|---|---|---|---|
Debtor Days Average number of days taken to collect customer payments. | - | - | - |
Creditor Days Average time taken to pay suppliers and vendors. | - | - | - |
Inventory Days Average number of days inventory remains unsold. | - | - | - |
CCC (Cash Conversion Cycle) (Debtor Days + Inventory Days - Creditor Days) | - | - | - |
Financial Ratios
Measures the company’s leverage relative to shareholder equity.
OBSERVATIONS & INSIGHTS
FY25 ROE spiked to 56.6% because PAT was boosted by deferred tax; FY26 ROE normalised to 21.6% as the equity base expanded following fresh issuances
Debt / Equity leverage remains modest. The ratio rose to 0.3x in FY25 when borrowings were introduced, then improved to 0.1x in FY26 as debt reduced and equity increased
Interest Coverage ratio improved to 7.29x in FY26 as operating profit increased substantially
Current liquidity remained above 2.0x in FY25-FY26, although the ratio eased to 2.4x as current liabilities increased with the larger operating base
FY25 appears unusually high because tax accounting amplified PAT. FY26 calculated ROA of 12.9% reflects stronger earnings against a much larger asset base
ROCE increased from 4.6% to 29.7%, showing stronger operating profit relative to equity plus borrowings
Industry Overview
Industry Drivers
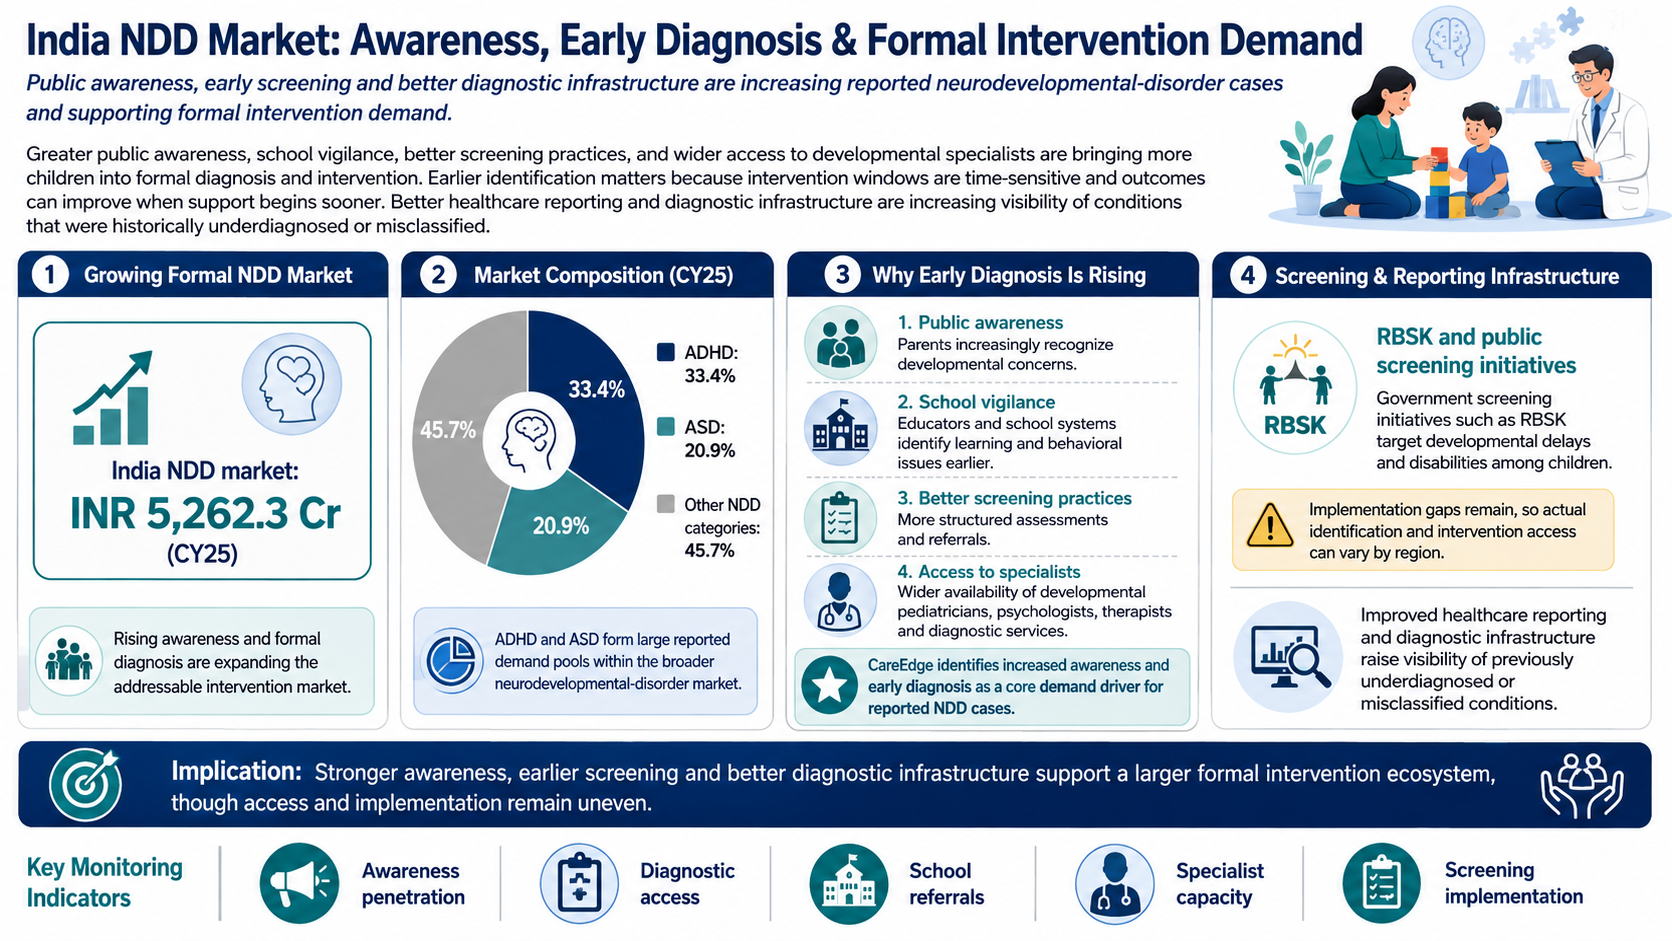
Rising Awareness, Earlier Diagnosis and Better Reporting
Public awareness, school vigilance, better screening practices and wider access to developmental specialists are bringing more children into formal diagnosis and intervention. Earlier identification is especially important because intervention windows are time-sensitive and developmental outcomes can improve when support begins sooner. Better healthcare reporting and diagnostic infrastructure also increase the visibility of conditions that were historically underdiagnosed or misclassified.
The key drivers are:
India's NDD market was estimated at INR 5,262.3 Cr in CY25
ADHD represented approximately 33.4% of the CY25 market, while ASD represented approximately 20.9%
CareEdge identifies increased awareness and early diagnosis as a core demand driver for reported NDD cases
Government screening initiatives such as RBSK target developmental delays and disabilities among children, although implementation gaps remain
Expanding Therapy Spend Across Major NDD Categories
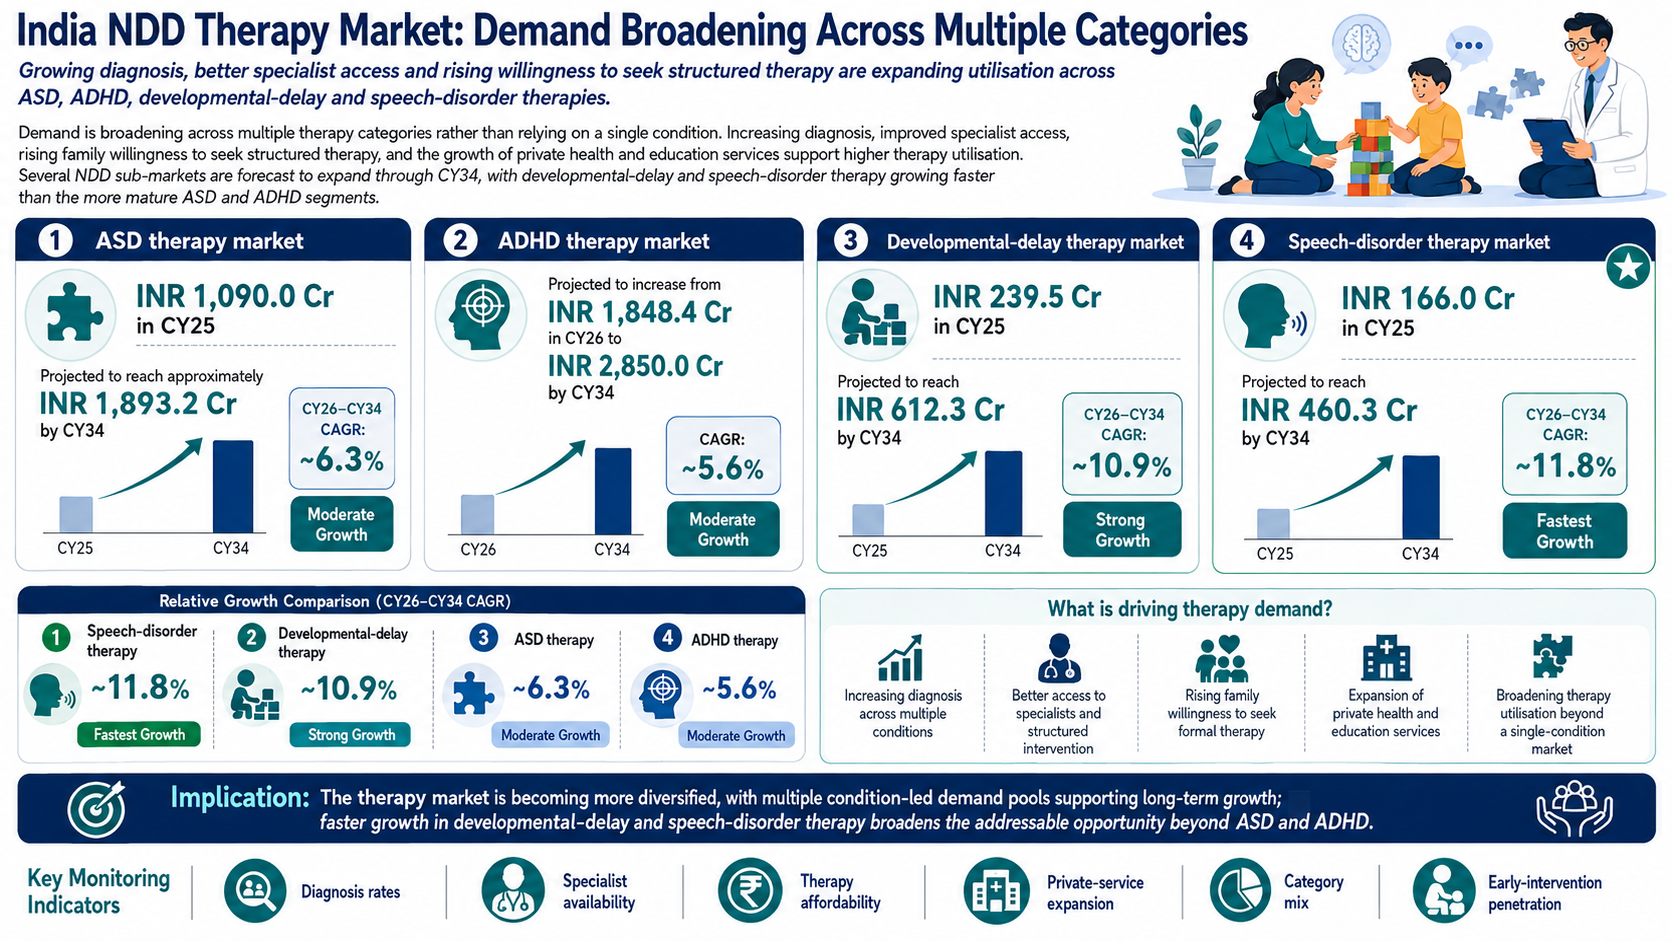
Demand is broadening across multiple therapy categories rather than relying on a single condition. Increasing diagnosis, improved specialist access, rising family willingness to seek structured therapy and the growth of private health and education services support higher therapy utilisation. Several NDD sub-markets are forecast to expand through CY34, with developmental-delay and speech-disorder therapy growing faster than the more mature ASD and ADHD segments.
The key details are:
ASD therapy market: INR 1,090.0 Cr in CY25, projected to reach approximately INR 1,893.2 Cr by CY34; CY26-CY34 CAGR ~6.3%
ADHD therapy market: projected to increase from INR 1,848.4 Cr in CY26 to INR 2,850.0 Cr by CY34; CAGR ~5.6%
Developmental-delay therapy market: INR 239.5 Cr in CY25, projected to reach INR 612.3 Cr by CY34; CY26-CY34 CAGR ~10.9%
Speech-disorder therapy market: INR 166.0 Cr in CY25, projected to reach INR 460.3 Cr by CY34; CY26-CY34 CAGR ~11.8%
Digital Therapeutics, AI-led Screening and Remote Care
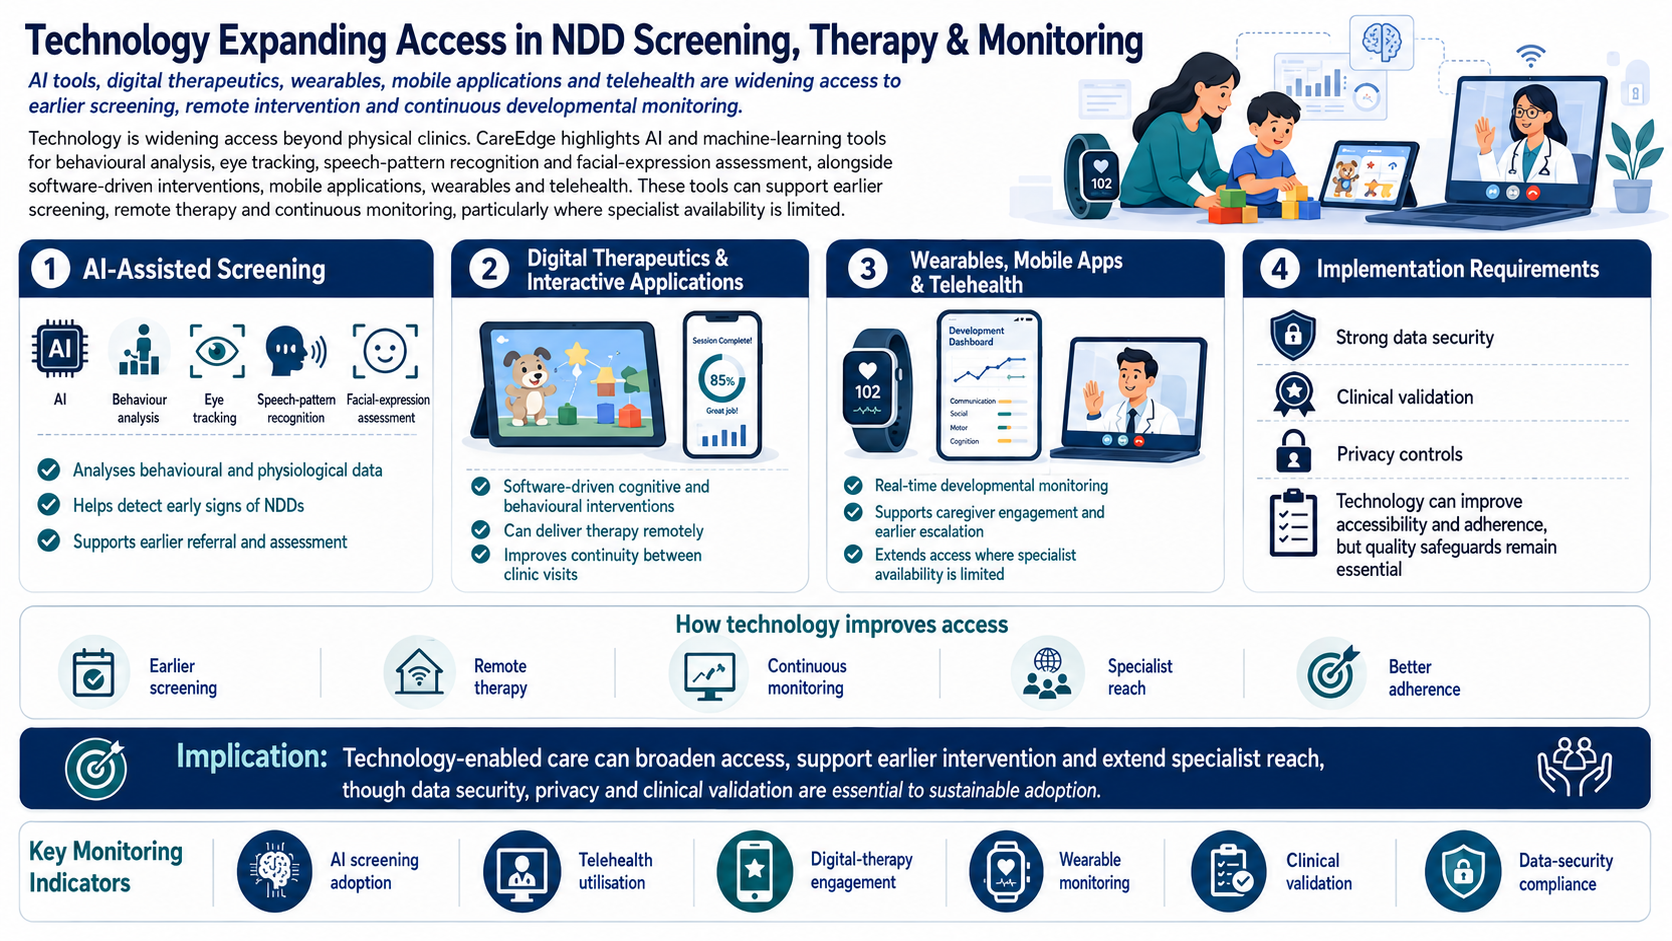
Technology is widening access beyond physical clinics. CareEdge highlights AI and machine-learning tools for behavioural analysis, eye tracking, speech-pattern recognition and facial-expression assessment, alongside software-driven interventions, mobile applications, wearables and telehealth. These tools can support earlier screening, remote therapy and continuous monitoring, particularly where specialist availability is limited.
The key details are:
AI-assisted screening can analyse behavioural and physiological data to detect early signs of NDDs
Digital therapeutics and interactive applications can deliver cognitive and behavioural interventions remotely
Wearable devices, mobile applications and telehealth can support real-time developmental monitoring and earlier escalation
Technology-enabled care can improve accessibility and adherence but requires strong data security, clinical validation and privacy controls
Risks in the Industry
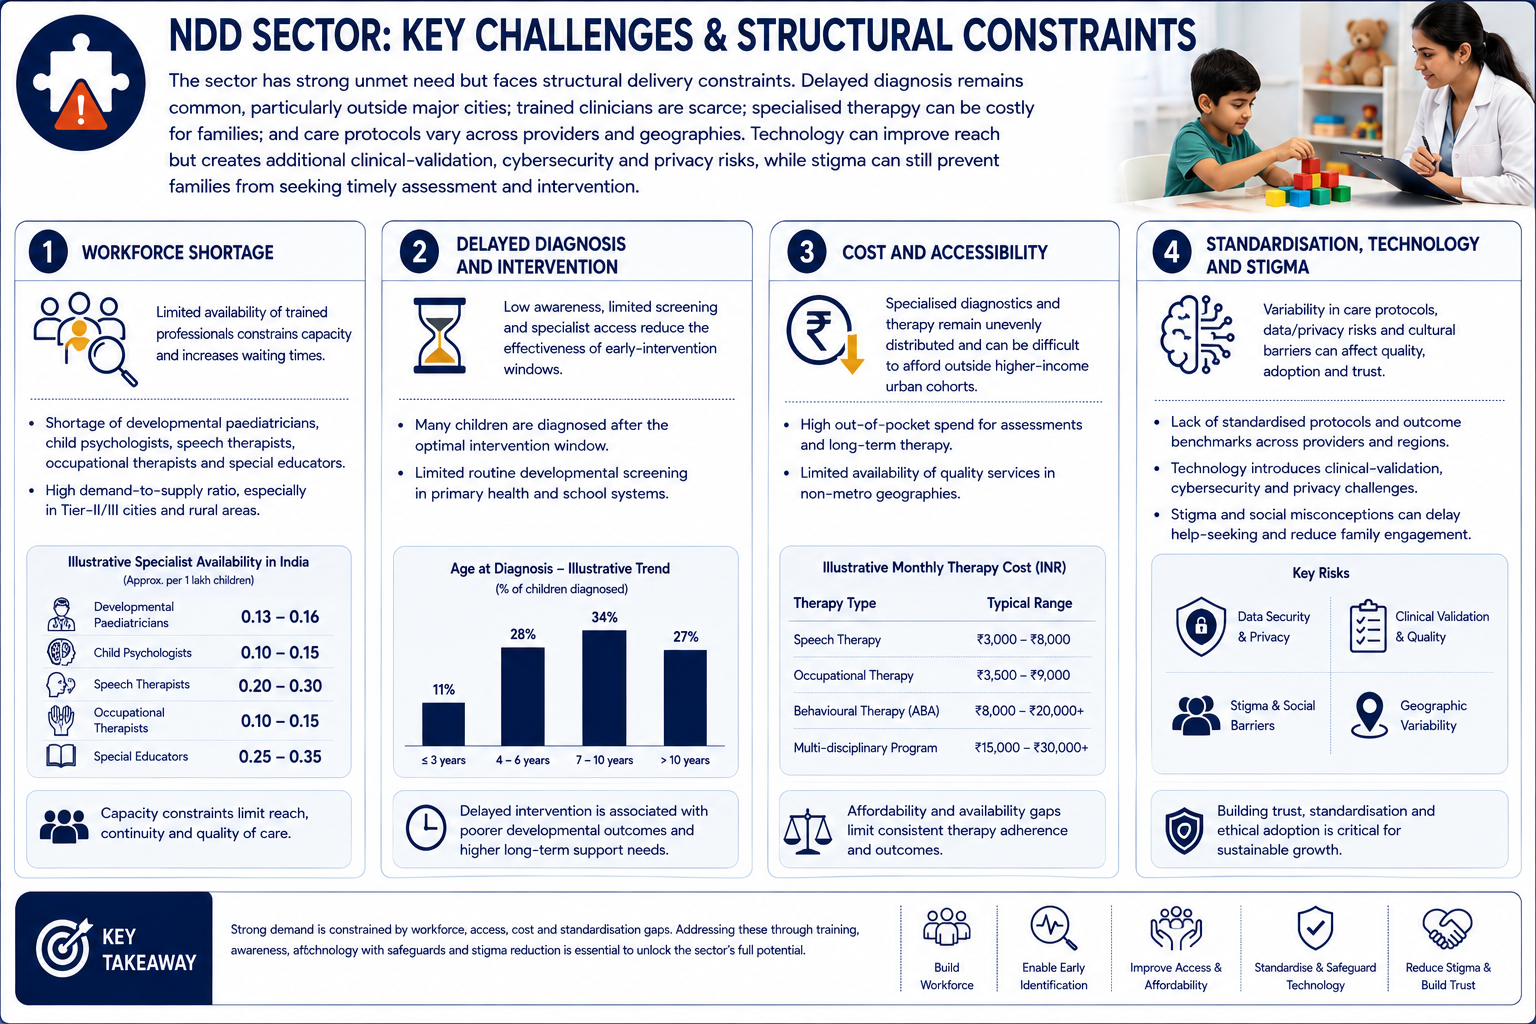
The sector has strong unmet need but faces structural delivery constraints. Delayed diagnosis remains common, particularly outside major cities; trained clinicians are scarce; specialised therapy can be costly for families; and care protocols vary across providers and geographies. Technology can improve reach but creates additional clinical-validation, cybersecurity and privacy risks, while stigma can still prevent families from seeking timely assessment and intervention.
The key risks are:
Workforce shortage: Limited availability of developmental paediatricians, child psychologists, speech therapists, occupational therapists and special educators can constrain capacity
Delayed diagnosis and intervention: Low awareness, limited screening and specialist access can reduce the effectiveness of early-intervention windows
Cost and accessibility: Specialised diagnostics and therapy remain unevenly distributed and can be difficult to afford outside higher-income urban cohorts
Standardisation, technology and stigma: Variability in care protocols, data/privacy risks and cultural barriers can affect quality, adoption and trust
Government Policy Support
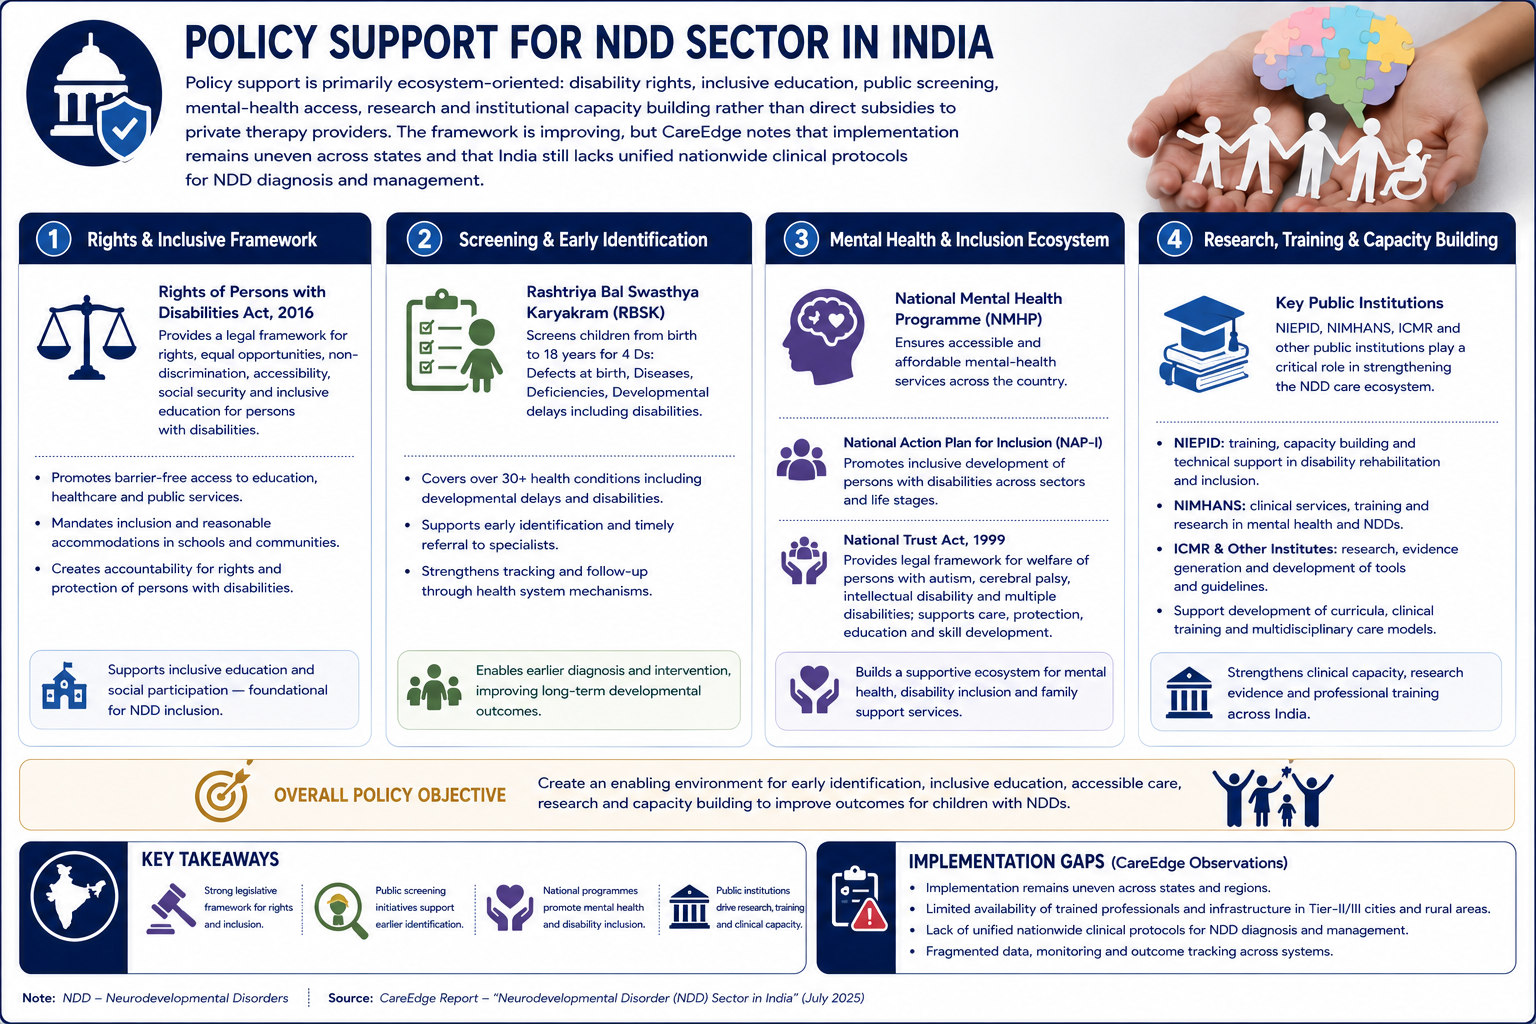
Policy support is primarily ecosystem-oriented: disability rights, inclusive education, public screening, mental-health access, research and institutional capacity building rather than direct subsidies to private therapy providers. The framework is improving, but CareEdge notes that implementation remains uneven across states and that India still lacks unified nationwide clinical protocols for NDD diagnosis and management.
The key policies are:
Rights of Persons with Disabilities Act, 2016 provides a framework for rights, equal opportunities, social support and inclusive education for persons with disabilities
Rashtriya Bal Swasthya Karyakram (RBSK) screens children for developmental delays and disabilities, supporting earlier identification
National Mental Health Programme, the National Action Plan for Inclusion and the National Trust provide broader mental-health, disability inclusion and institutional-support mechanisms
NIEPID, NIMHANS, ICMR and other public institutions support training, research, clinical services and development of the care ecosystem
Fundraise/Future Plans
Shareholding
Pre-issue shareholding
Promoter Holding 0.0%
Post-Issue Shareholding
Promoter Holding 0.0%
Category
Pre-Issue%Post-Issue%
Promoters
Carving Futures Pte. Ltd
91.4%68.5%
Nitin Bindlish
0.3%0.2%
Manish Agarwal
2.2%1.7%
KAPICO Investment Co. L.L.C
1.2%0.9%
Rainmatter Investments
1.1%0.8%
Total Promoter Holding
96.2%72.1%
Additional Shareholders
0.0%0.0%
Total Additional Holding
0.0%0.0%
Total Shareholding
96.2%72.1%
- Overview
- Business
- Financial Highlights
- Industry Overview
- Fundraise/Future Plans
- Documentation
Get the Preqt App and keep in touch around the clock!
 Monitor your investments in real-time.
- Receive tailored deal suggestions.
- Get real-time updates and alerts.
