

Rentomojo
Intelligence Behind Security
IPO Summary (PrEqT)
Rentomojo Limited operates a technology-driven, full-stack direct-to-consumer rental and subscription platform for furniture and appliances in India. The Company combines online discovery and ordering with 82 experience stores, while its operating stack spans demand forecasting, product procurement, warehousing, last-mile and reverse logistics, servicing, refurbishment and multi-cycle redeployment. As of March 31, 2026, the platform served 253,825 live subscribers across 29 cities and managed 851,184 live items. The investment case is driven by recurring subscription revenue, a large but still underpenetrated rental market, strong operating cash generation and the ability to monetise the same physical asset across multiple rental cycles. FY26 revenue from operations increased 45.5% to INR 387.0 Cr and EBITDA increased to INR 163.5 Cr, while occupancy remained 83.3%. However, the model remains asset- and execution-intensive, with substantial annual rental-asset capex, warehouse/logistics complexity, credit-loss provisioning and debt funding requirements. The IPO is dominated by an Offer for Sale. At the upper price, the total offer is approximately INR 1,256.0 Cr, of which the fresh issue is INR 150.0 Cr and the OFS is approximately INR 1,106.0 Cr. The Company proposes to use INR 70.0 Cr for debt repayment/prepayment and INR 42.5 Cr for warehouse and experience-store lease/license payments.
IPO Review Rating
Strong Buy
MainboardBuilding Smarter, Safer Infrastructure Through Intelligent Security Technologies
Rentomojo has demonstrated strong operating growth, with Revenue increasing from INR 192.7 Cr in FY24 to INR 387.0 Cr in FY26, representing a 41.7% CAGR. Profitability is a key strength, with EBITDA reaching INR 163.5 Cr at a 41.5% Margin and reported PAT increasing to INR 104.3 Cr at a 27.0% Margin. Cash-generation quality is also strong, with FY26 OCF of INR 172.9 Cr, while leverage has moderated to approximately 0.6x gross D/E despite the asset-intensive rental model. The industry opportunity is attractive and remains in an Emerging Phase, with the actual Indian furniture and appliance rental market projected to grow at approximately 31.0% CAGR through CY30P. Governance is supported by 50.0% Board independence, nil promoter pledge and low 1.3% RPT exposure, although the pending FIR and NCLT proceedings involving the Promoter require monitoring. The IPO is predominantly an investor exit, with 88.1% OFS, although promoter monetisation itself is relatively limited and INR 70.0 Cr of Fresh Issue proceeds is proposed for debt reduction. Overall, Rentomojo presents a high-growth, high-margin, cash-generative and category-leading subscription business, with the key monitorables being premium absolute valuation.
PARAMETER
WEIGHT
SCORE
KEY FACTORS
Financial Performance
40.0%
5.0/5
Rentomojo has demonstrated a strong financial transformation, with Revenue growing at 41.7% CAGR, EBITDA more than doubling to INR 163.5 Cr and PAT increasing from INR 22.4 Cr to INR 104.3 Cr over FY24–FY26.
Show more
Detailed Analysis
Revenue increased from INR 192.7 Cr in FY24 to INR 266.0 Cr in FY25 and INR 387.0 Cr in FY26, representing a strong FY24–FY26 CAGR of 41.7%
EBITDA increased from INR 78.2 Cr in FY24 to INR 118.4 Cr in FY25 and INR 163.5 Cr in FY26, while EBITDA Margin remained high at 39.9%, 43.6% and 41.5%, respectively
PAT increased from INR 22.4 Cr in FY24 to INR 43.1 Cr in FY25 and INR 104.3 Cr in FY26, while PAT Margin expanded from 11.6% to 16.2% and 27.0%
D/E improved from approximately 1.1x in FY24 to 0.8x in FY25 and 0.6x in FY26, despite absolute borrowings increasing alongside the rental-asset base
ROE remained strong at 27.7% in FY24, 26.7% in FY25 and 43.5% in FY26, indicating a sharp improvement in FY26 capital efficiency
OCF remained consistently positive and increased from INR 91.6 Cr in FY24 to INR 115.5 Cr in FY25 and INR 172.9 Cr in FY26
Customer diversification is strong, with no single customer contributing more than 10.0% of Group Revenue
Industry
15.0%
4.0/5
Rentomojo operates in an Emerging Phase industry with strong structural growth, with India's actual furniture and appliance rental market expected to expand at approximately 31.0% CAGR through CY30P.
Show more
Detailed Analysis
India's home furniture and appliances rental market is projected to grow at approximately 31.0% CAGR, from INR 1,550.0 Cr in CY25 to INR 6,030.0 Cr by CY30P
Rental penetration remains only approximately 1.0% for furniture and 1.4% for appliances, while adoption is rising rapidly from a very low base
Rentomojo holds approximately 42.0%–47.0% share of organised subscription Revenue and 50.0%–55.0% of live subscribers
The business is not subject to a dedicated sectoral regulator, although consumer protection, data, tax, municipal, labour and lease-related compliance remain applicable across operations
Management
15.0%
4.0/5
Rentomojo remains a founder-led business with 14+ years of promoter involvement, supported by a Board with 50.0% independent representation and low RPT exposure of only 1.3% of FY26 Revenue.
Show more
Detailed Analysis
Founder, MD & CEO Geetansh Bamania has 14+ years of business and management experience and has been associated with Rentomojo since incorporation in 2012
The Board comprises 6 Directors, including 3 Independent Directors, resulting in exactly 50.0% independent representation
No promoter shares are pledged, although a pending criminal proceeding and NCLT matter involving the Promoter constitute a material governance monitorable
Aggregate RPTs were only INR 5.0 Cr / 1.3% of FY26 Revenue, compared with 0.9% in FY25 and 3.8% in FY24
The Promoter is selling 8.5 lakh shares, worth approximately INR 34.3 Cr at the cap price; the overwhelming majority of the OFS relates to existing institutional/investor shareholders rather than promoter exit
Valuation
20.0%
3.0/5
At the upper price band of INR 404.0, Rentomojo is valued at approximately INR 4,246.3 Cr market capitalisation, 40.7x P/E, 26.9x EV/EBITDA and 14.1x P/B.
Show more
Detailed Analysis
Rentomojo is valued at 40.7x FY26 P/E, no comparable listed peer exists for a defensible premium/discount calculation
FY26 EV/EBITDA of approximately 26.9x
At INR 404.0 against FY26 NAV of INR 28.7 per share, the IPO is valued at approximately 14.1x P/B
FY26 RoNW stood at a strong 43.5%
Merchant Banker Track Record
10.0%
4.0/5
The BRLM consortium represents a strong execution and distribution setup, with substantial Mainboard IPO experience.
Show more
Detailed Analysis
Across the latest 10 disclosed IPOs for each of the three BRLMs, the combined 30 issue-level observations generated a calculated average opening return of approximately 14.7%
A representative recent four-IPO sample generated average overall subscription of approximately 84.1x, reflecting strong investor demand across several recent transactions
23 of the 30 latest disclosed IPO observations, or 76.7%, opened above their respective issue prices
The consortium comprises three established Mainboard investment-banking franchises with substantial recent IPO execution depth
TOTAL
100%
4.2/5
Weighted Composite Score
Issue Price
₹384.0 to ₹404.0
As of 5 Sep 2026
GMP
₹160.0
As of 5 Sep 2026
Estimated Gain / Loss
+39.6%
Lot Size
37.0 Shares
Grey Market Premium (GMPs) are shared for knowledge purpose only. PrEqt doesn’t promote or execute the trades.
| Issue size | |
|---|---|
| Overall | ₹1,256.0 Cr |
| Fresh Issue | ₹150.0 Cr |
| Offer for Sale | ₹1,106.0 Cr |
Minimum Investment
₹14,948.0 / 1,369 shares

Merchant Banker
Motilal Oswal Investment Advisors Ltd.; Axis Capital; IIFL Capital
IPO Document
RHP / Anchor Document
Offer Start Date
9th Sept 2026
Offer End Date
11th Sept 2026
Valuation
₹4,246.3 Cr
Revenue (FY'26)
₹387.0 Cr
PAT (FY'26)
₹104.3 Cr
Issue Size
₹1,256.0 Cr
Face Value
₹ 1.0Offer Price
₹ 404.0Lot Size
37.0 sharesSale Type
Fresh capital cum OFSPAT (FY'26)
₹ 104.3 CrPAT Margin (FY'26)
27.0 %P/E Multiple
40.7xEBITDA (FY'26)
₹ 163.5 CrCAGR Growth 2Y
41.7 %ROE (FY'26)
43.5 %ROCE (FY'26)
25.3 %Price to Book Value
14.1xDebt/Equity
0.6xCompany Website
www.rentomojo.comExplore new deals
Overview
Fund Allocation
Total: ₹0 CrSource:Company DRHP
Timeline
IPO Open Date
To Be Announced
IPO Close Date
To Be Announced
Tentative Allotment
To Be Announced
Initiation of Refunds
To Be Announced
Credit of Shares to Demat
To Be Announced
Tentative Listing Date
To Be Announced
Business
Business Model
Sales Channel
Key Risk Factor
Financial Highlights
Income Statement
Revenue growth with EBITDA and PAT margins
| Financial Metric | FY 2024 | FY 2025 | FY 2026 |
|---|---|---|---|
| Revenue (₹ Cr) | 195.8 | 266.0 | 387.0 |
| Growth (%) | - | 35.8% | 45.0% |
| EBITDA (₹ Cr) | 78.2 | 118.4 | 163.5 |
| EBITDA Margin (%) | 39.9% | 43.6% | 41.5% |
| PAT (₹ Cr) | 22.4 | 43.1 | 104.3 |
| PAT Margin (%) | 11.6% | 16.2% | 27.0% |
OBSERVATIONS & INSIGHTS
FY26 revenue rose 45.5% as gross items ordered increased to 989,931, live items to 851,184 and live subscribers to 253,825; furniture and appliance rentals remained the core growth engines
EBITDA increased 38.0% to INR 163.5 Cr as recurring subscription scale and asset utilisation lifted operating profit, though growth was slower than revenue because operating support costs rose sharply. Margin moderated to 41.5% from 43.6% as marketing, manpower, logistics and refurbishment investment outpaced revenue growth in parts of the cost base; margin remained above FY24
PAT increased to INR 104.3 Cr, but FY26 includes a INR 36.6 Cr deferred-tax credit from recognition of previously unrecognised tax assets, so reported PAT growth exceeds the underlying PBT improvement. Margin expanded to 27.0% from 16.2%; a substantial portion of the FY26 step-up is tax-accounting driven, so the margin should not be treated as fully recurring without normalisation
Balance Sheet
| Financial Metric | FY 2023 | FY 2024 | FY 2025 |
|---|---|---|---|
| Net Worth | ₹ 139.6 Cr | ₹ 183.6 Cr | ₹ 295.8 Cr |
| Total Assets | ₹ 366.2 Cr | ₹ 449.9 Cr | ₹ 641.1 Cr |
| Total Borrowing | ₹ 147.2 Cr | ₹ 154.6 Cr | ₹ 187.6 Cr |
| Reserves & Surplus | ₹ 138.9 Cr | ₹ 182.9 Cr | ₹ 291.7 Cr |
OBSERVATIONS & INSIGHTS
Reserves & surplus increased 59.5% to INR 291.7 Cr, driven primarily by retained profitability and equity-related reserve movements; this was the main reason total equity increased faster than debt
Total assets increased 42.5%, showing the balance-sheet investment required to support 45.5% revenue growth
Total borrowings increased to INR 187.6 Cr to support the rental-asset base, but debt/equity improved to 0.63x because equity expanded more quickly. INR 70.0 Cr of fresh-issue proceeds is earmarked for repayment / prepayment
Cash Flow
| Financial Metric | FY 2024 | FY 2025 | FY 2026 |
|---|---|---|---|
CFO (₹ Cr) Cash generated from core business operations. | +91.6 Cr | +115.5 Cr | +172.9 Cr |
CFI (₹ Cr) Cash used for investments and long-term assets. | -184.1 Cr | -111.3 Cr | -158.3 Cr |
CFF (₹ Cr) Cash flow related to funding and borrowings. | +113.1 Cr | -34.7 Cr | -4.2 Cr |
Working Capital
| Efficiency Metric | FY 2023 | FY 2024 | FY 2025 |
|---|---|---|---|
Debtor Days Average number of days taken to collect customer payments. | - | - | - |
Creditor Days Average time taken to pay suppliers and vendors. | - | - | - |
Inventory Days Average number of days inventory remains unsold. | - | - | - |
CCC (Cash Conversion Cycle) (Debtor Days + Inventory Days - Creditor Days) | - | - | - |
Financial Ratios
Measures the company’s leverage relative to shareholder equity.
OBSERVATIONS & INSIGHTS
ROE increased to 43.5% because reported PAT more than doubled while the average equity base expanded more gradually; the deferred-tax credit materially supports the FY26 result
ROCE held near 25% despite rapid asset growth, indicating stable operating returns on the enlarged capital base rather than a one-off margin spike
ROA increased to 16.3% because FY26 reported PAT grew 141.9% while closing total assets rose 42.5%; the INR 36.6 Cr deferred-tax credit materially inflates this PAT
Debt/equity improved to 0.6x as equity grew faster than borrowings; net gearing also improved to 0.5x
Interest Coverage Ratio improved to 3.7x because PBT expanded while finance cost declined, providing materially more debt-service cushion than FY24
Industry Overview
Industry Drivers
Large Home-Durables Base and Rising Household Formation
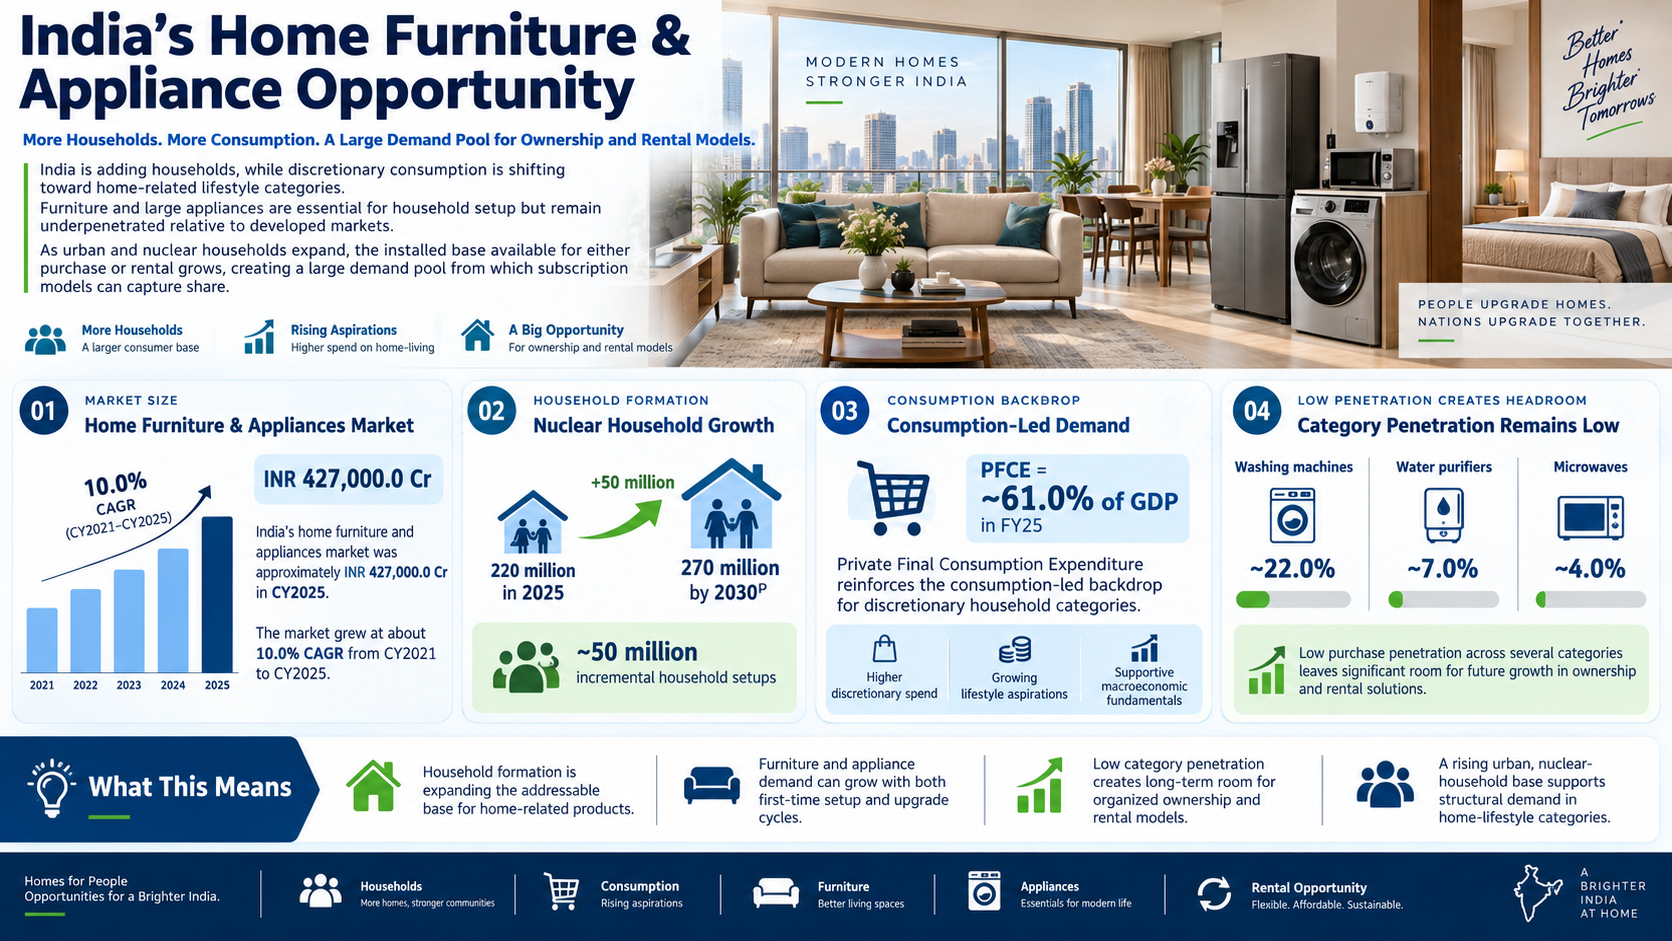
India is adding households while discretionary consumption is shifting toward home-related lifestyle categories. Furniture and large appliances are essential for household setup but remain underpenetrated relative to developed markets. As urban and nuclear households expand, the installed base available for either purchase or rental grows, creating a large demand pool from which subscription models can capture share.
The key drivers:
India's home furniture and appliances market was approximately INR 427,000.0 Cr in CY2025, after growing at about 10.0% CAGR from CY2021
Nuclear households are projected to increase from approximately 220 million in 2025 to 270 million by 2030P, adding roughly 50 million incremental household setups
Private Final Consumption Expenditure represented approximately 61.0% of GDP in FY25, reinforcing the consumption-led backdrop for discretionary household categories
Purchase penetration remains low in several categories washing machines about 22.0%, water purifiers about 7.0% and microwaves about 4.0% in CY2025
Urban Mobility, Rental Housing and Affordability Mismatch
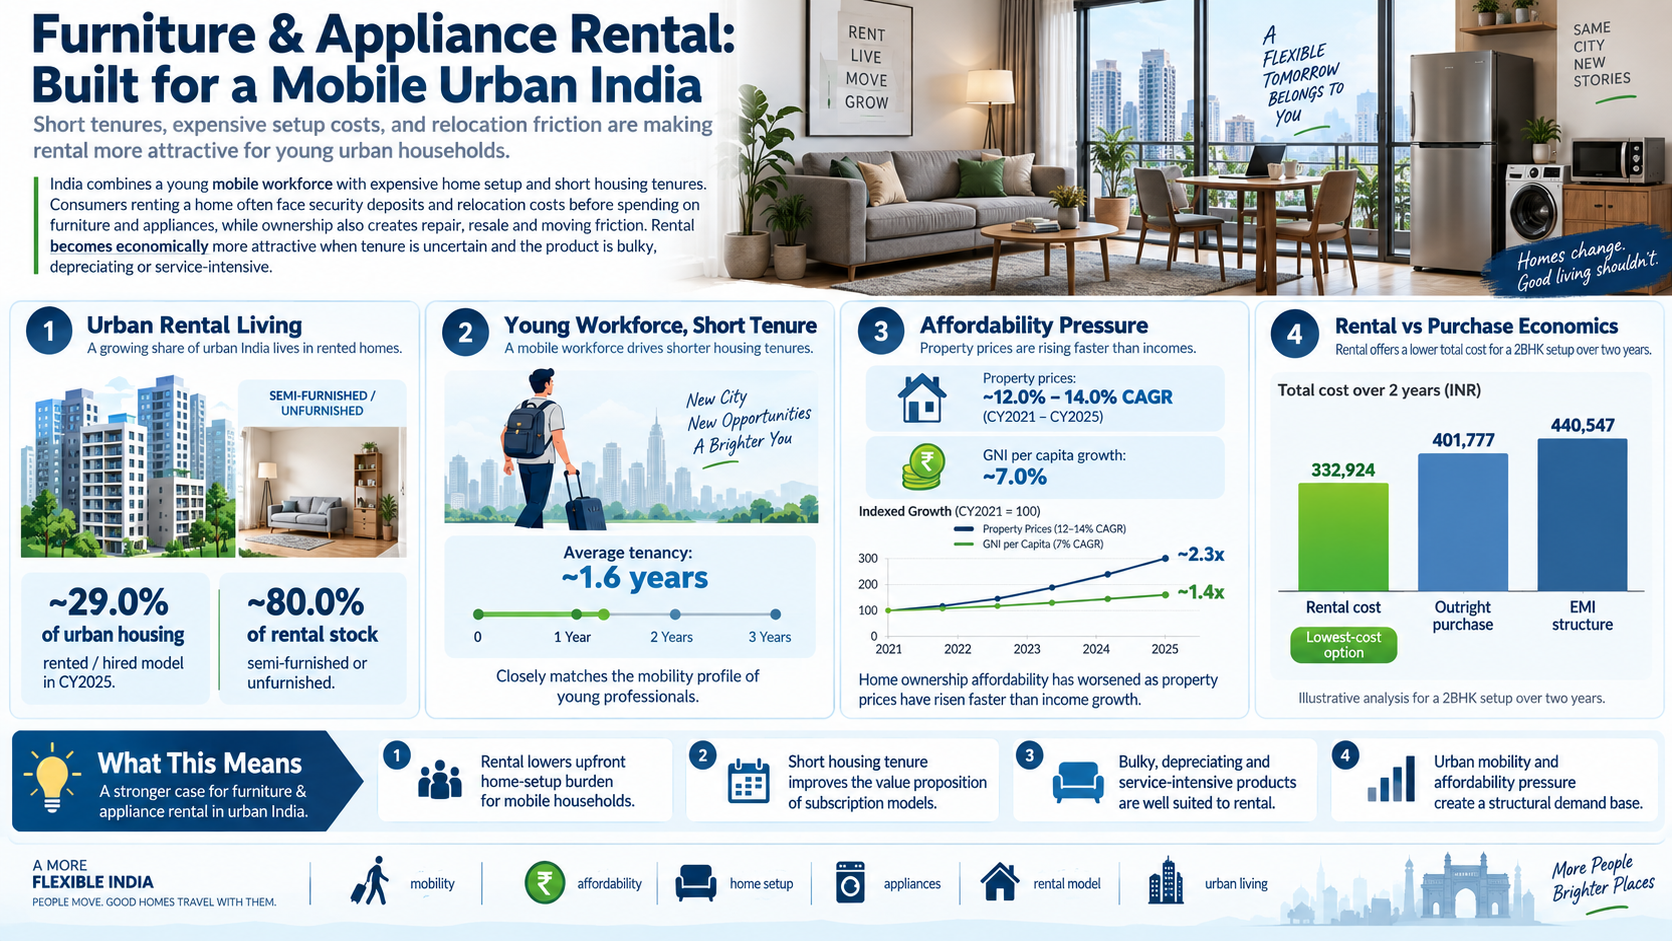
India combines a young mobile workforce with expensive home setup and short housing tenures. Consumers renting a home often face security deposits and relocation costs before spending on furniture and appliances, while ownership also creates repair, resale and moving friction. Rental becomes economically more attractive when tenure is uncertain and the product is bulky, depreciating or service-intensive.
The key drivers are:
Approximately 29.0% of urban housing followed a rented / hired model in CY2025; about 80.0% of that rental stock was semi-furnished or unfurnished
Average tenancy used in the Redseer analysis is approximately 1.6 years, closely matching the mobility profile of young professionals
Property prices increased at about 12.0%-14.0% CAGR between CY2021 and CY2025 versus roughly 7.0% GNI-per-capita growth, worsening affordability
For an illustrative 2BHK setup over two years, Redseer estimates rental cost at about INR 332,924.0 versus INR 401,777.0 for outright purchase and INR 440,547.0 under the assumed EMI structure
Low Rental Penetration and Rapid Organised-Platform Scaling
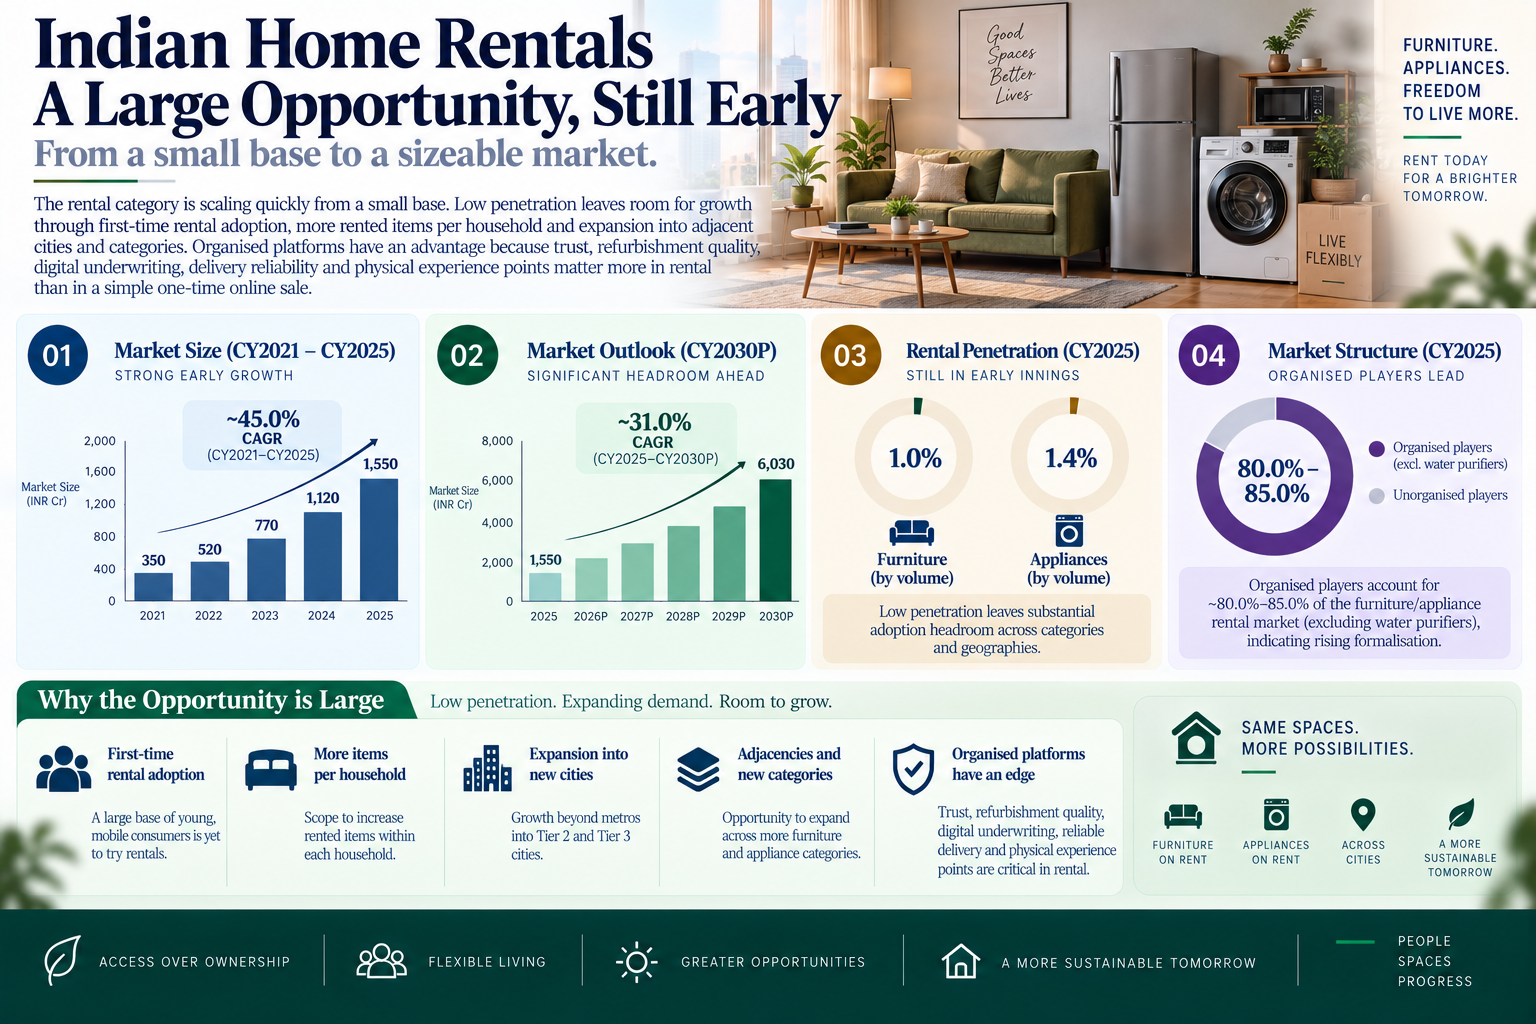
The rental category is scaling quickly from a small base. Low penetration leaves room for growth through first-time rental adoption, more rented items per household and expansion into adjacent cities and categories. Organised platforms have an advantage because trust, refurbishment quality, digital underwriting, delivery reliability and physical experience points matter more in rental than in a simple one-time online sale.
The key drivers are:
The Indian home furniture and appliances rental market expanded from approximately INR 350.0 Cr in CY2021 to INR 1,550.0 Cr in CY2025, implying about 45.0% CAGR
Redseer projects the rental market to reach approximately INR 6,030.0 Cr by CY2030P, implying about 31.0% CAGR from CY2025
Average rental penetration by volume was only about 1.0% for key furniture and 1.4% for key appliances in CY2025, showing substantial adoption headroom
Organised players accounted for approximately 80.0%-85.0% of the furniture/appliance rental market excluding water purifiers, indicating that category formalisation is already relatively high
Risks in the Industry
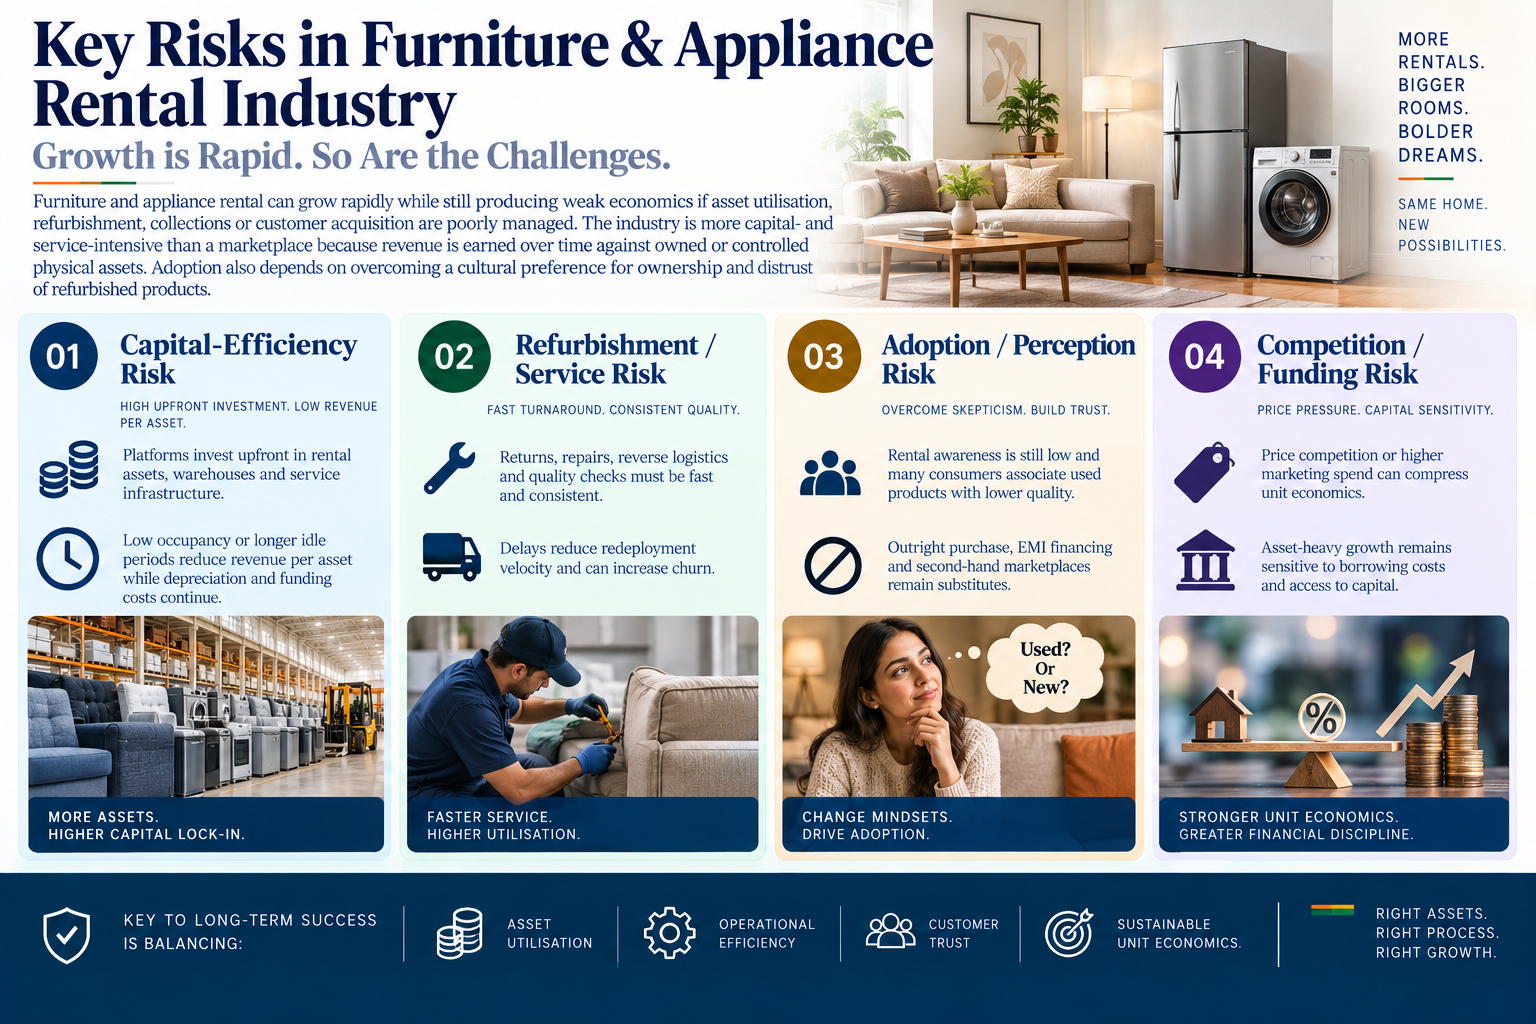
Furniture and appliance rental can grow rapidly while still producing weak economics if asset utilisation, refurbishment, collections or customer acquisition are poorly managed. The industry is more capital- and service-intensive than a marketplace because revenue is earned over time against owned or controlled physical assets. Adoption also depends on overcoming a cultural preference for ownership and distrust of refurbished products.
The key risks are:
Capital-efficiency risk: Platforms invest upfront in rental assets, warehouses and service infrastructure; low occupancy or longer idle periods reduce revenue per asset while depreciation and funding costs continue
Refurbishment / service risk: Returns, repairs, reverse logistics and quality checks must be fast and consistent; delays reduce redeployment velocity and can increase churn
Adoption / perception risk: Rental awareness is still low and many consumers associate used products with lower quality, while outright purchase, EMI financing and second-hand marketplaces remain substitutes
Competition / funding risk: Price competition or higher marketing spend can compress unit economics, while asset-heavy growth remains sensitive to borrowing costs and access to capital
Government Policy Support
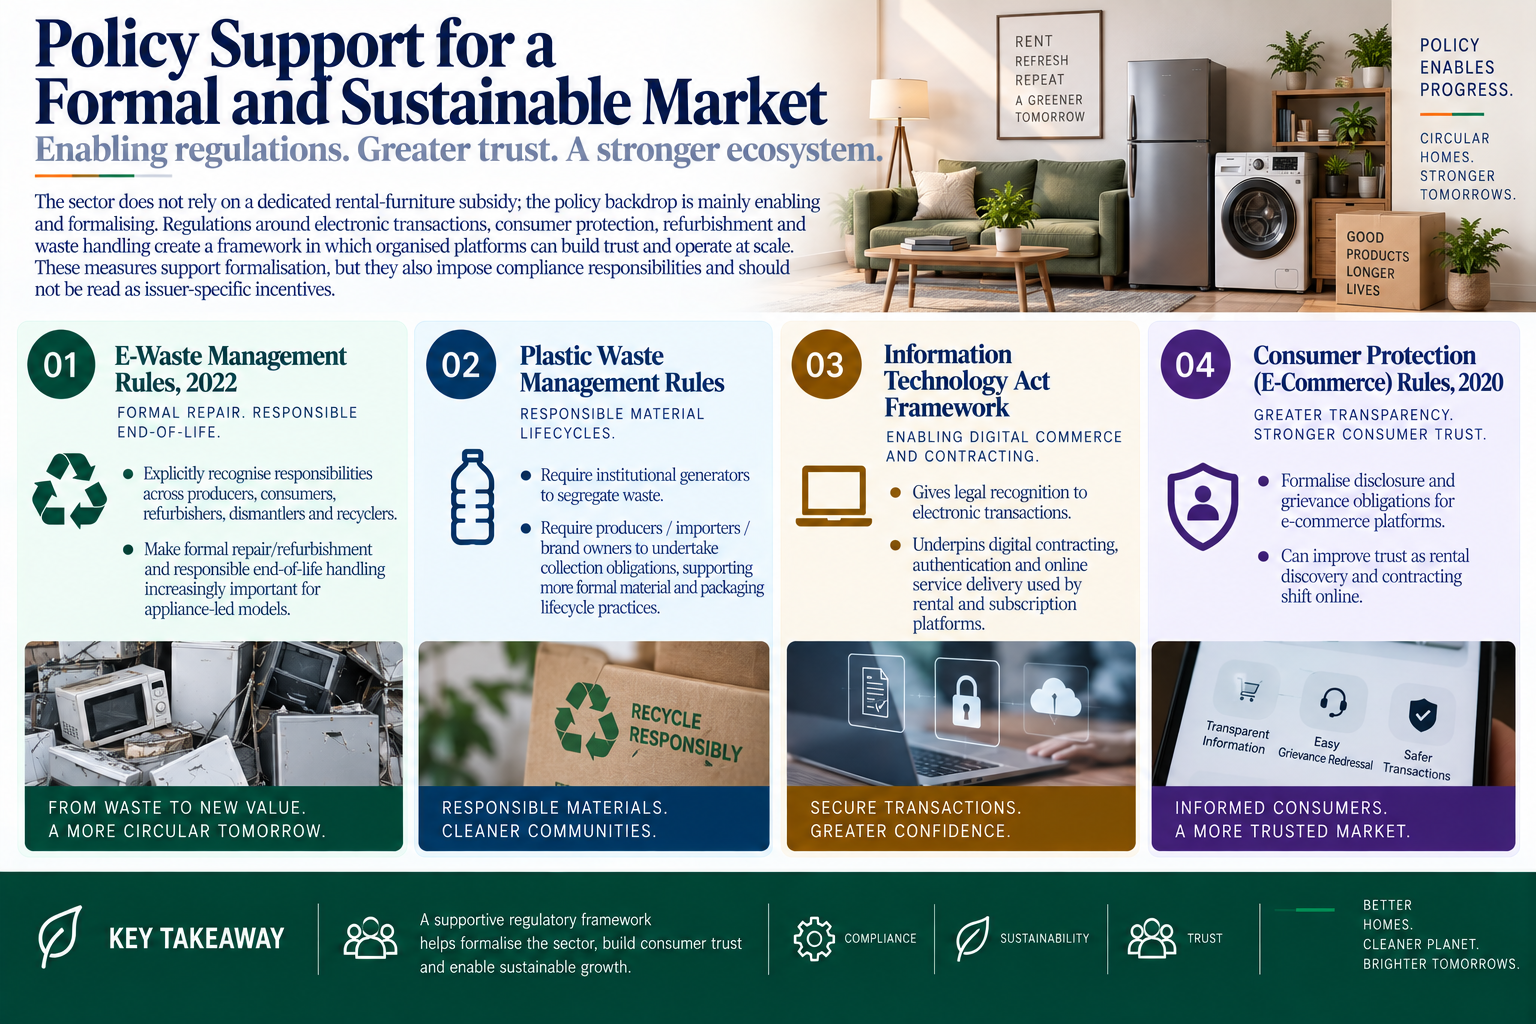
The sector does not rely on a dedicated rental-furniture subsidy; the policy backdrop is mainly enabling and formalising. Regulations around electronic transactions, consumer protection, refurbishment and waste handling create a framework in which organised platforms can build trust and operate at scale. These measures support formalisation, but they also impose compliance responsibilities and should not be read as issuer-specific incentives.
The key policies are:
E-Waste Management Rules, 2022: Explicitly recognise responsibilities across producers, consumers, refurbishers, dismantlers and recyclers, making formal repair/refurbishment and responsible end-of-life handling increasingly important for appliance-led models
Plastic Waste Management Rules: Require institutional generators to segregate waste and require producers/importers/brand owners to undertake collection obligations, supporting more formal material and packaging lifecycle practices
Information Technology Act framework: Gives legal recognition to electronic transactions and underpins digital contracting, authentication and online service delivery used by subscription platforms
Consumer Protection (E-Commerce) Rules, 2020: Formalise disclosure and grievance obligations for e-commerce platforms, which can improve trust as rental discovery and contracting shift online
Fundraise/Future Plans
Shareholding
Pre-issue shareholding
Promoter Holding 0.0%
Post-Issue Shareholding
Promoter Holding 0.0%
Category
Pre-Issue%Post-Issue%
Promoters
Geetansh Bamania
14.7%13.4%
Gaurav Bamania
2.8%2.3%
MVP Family Trust
3.9%3.7%
Promoter Group
6.8%6.2%
Total Promoter Holding
28.2%25.6%
Additional Shareholders
0.0%0.0%
Total Additional Holding
0.0%0.0%
Total Shareholding
28.2%25.6%
- Overview
- Business
- Financial Highlights
- Industry Overview
- Fundraise/Future Plans
- Documentation
Get the Preqt App and keep in touch around the clock!
 Monitor your investments in real-time.
- Receive tailored deal suggestions.
- Get real-time updates and alerts.
