


Royal Care Super Speciality Hospital Ltd.
Specialised Care, TrustedWhere Expertise Heals
IPO Review and Rating
Watchlist
Overall Recommendation
FY2026 operating income increased 25.8%, PAT reached INR 26.1 Cr, operating cash flow reached INR 89.9 Cr, and its expanding super-speciality infrastructure gives the company credible long-term growth potential. The problem is the combination of valuation and governance. A FY2025 market capitalisation of INR 3,018.5 Cr represented 190.5x earnings, 8.4x sales and 9.5x book value, despite a single-region hospital model. At the same time, borrowings have climbed to INR 552.7 Cr, promoter/director-related shares are pledged, independent representation is low and related-party transactions are unusually large
PARAMETER
WEIGHT
SCORE
KEY FACTORS
Financial Performance
25.0%
3.3/5
FY2026 shows excellent revenue, PAT and cash-flow recovery. The principal constraint is the rapidly expanding debt-funded capital base and still-moderate ROE
Show more
Detailed Analysis
FY2026 operating income grew 25.8%, a strong recovery and comfortably above the hospital industry's underlying growth rate
FY2026 EBITDA margin was 18.5%, healthy but below the roughly 22.0%-24.0% margins of major listed hospital operators
PAT margin recovered to 5.8% from 2.7% in restated FY2025, but remains moderate for a hospital at this scale
Gross borrowings reached INR 552.7 Cr, but equity also expanded to INR 450.5 Cr, resulting in D/E of approximately 1.2x
FY2026 ROE on average equity was approximately 6.8%, still modest despite the sharp PAT recovery
Industry
25.0%
3.2/5
Structural hospital demand is strong and Royalcare is expanding aggressively into it
Show more
Detailed Analysis
Indian hospitals are expected to sustain roughly 11.0%-15.0% growth, driven by insurance penetration, rising ARPOB and healthcare demand
Organised private healthcare remains in a growth phase, with sizeable bed additions planned across metros and Tier-II/III cities
Competition from national chains and regional hospitals is intense
Hospitals face pricing, clinical, accreditation and government reimbursement risks; regulation is meaningful but manageable
India's medical-tourism proposition remains attractive, supported by specialised care and significantly lower treatment costs
Management
25.0%
2.2/5
Promoter clinical experience and clean audit observations are positives. Low board independence, pledged promoter-related shares and very substantial RPT exposure are meaningful governance negatives
Show more
Detailed Analysis
Royal Care's specialist Dr. K. Madeswaran has approximately 25.0 years of experience in neurosurgery
Only 2 of 17 directors at FY2026-end were independent, approximately 11.8%
Promoter/director-related shares representing roughly 9.6% of total FY2026 shares are pledged; however, auditors reported no material litigation affecting the financial position
Related-party dealings are highly material, including procurement, leases, equipment purchases and the Phase III construction contract
Valuation Metrics
25.0%
2.0/5
Royalcare is expensive on earnings, sales and book value and trades materially above listed hospital benchmarks
Show more
Detailed Analysis
Royalcare's 190.5x P/E is approximately 186.0% above the FY2025 peer median of 66.6x
FY2025 EV/EBITDA of 48.8x is approximately 41.9% above the peer median of 34.4x
The hospital chain is valued at a book value of 9.5x
TOTAL
100%
2.7/5
Weighted Composite Score
Per Share Price
₹160.0
As of 24 Oct 2026
Lot Size
100.0 Shares
Minimum Investment
₹16,000.0 / 100 shares
Market Cap. (₹ Cr)
Revenue FY’25
PAT FY’25
P/E Multiple
Face Value
₹ 10.0Lot Size
100.0 sharesPAT FY’25
₹ 15.0 CrPAT Margin (%)
4.2 %P/E Multiple
190.5xCAGR Growth 3Y
13.1 %ROE (FY’25)
5.9 %ROCE (FY’25)
5.8 %Price to Book Value ratio
9.5xDebt/Equity (FY’25)
1.2xMerchant banker appointed
❌ NoCompany Website
www.royalcarehospital.inDisclaimer: Unlisted shares are unregulated & illiquid. This is NOT investment advice. Please do your own due diligence before investing.
Minimum Investment
₹16,000.0 / 100 sharesShares Lot 100 X 1
Investment amount
₹16,000.0
Overview
Business
Business Model
Geographical Presence
Sales Channel
Financial Highlights
Income Statement
Revenue growth with EBITDA and PAT margins
| Financial Metric | FY 2023 | FY 2024 | FY 2025 |
|---|---|---|---|
| Revenue (₹ Cr) | 305.5 | 332.7 | 3,526.0 |
| Growth (%) | 0.0% | 8.9% | 6.0% |
| EBITDA (₹ Cr) | 61.6 | 65.8 | 51.9 |
| EBITDA Margin (%) | 20.2% | 19.8% | 14.7% |
| PAT (₹ Cr) | 15.7 | 24.5 | 15.0 |
| PAT Margin (%) | 5.1% | 7.4% | 4.3% |
OBSERVATIONS & INSIGHTS
Revenue growth moderated from 8.9% in FY24 to 6.0% in FY25, while the two-year FY23-FY25 revenue CAGR was 7.4%
EBITDA fell to ₹51.9 Cr in FY25 and margin compressed by 5.1 percentage points versus FY24, indicating that incremental scale did not offset the cost burden during expansion
PAT fell 38.5% in FY25 to INR 15.0 Cr from INR 24.5 Cr in FY24 despite higher revenue, reducing return ratios and increasing the implied valuation multiple
Balance Sheet
| Financial Metric | FY 2023 | FY 2024 | FY 2025 |
|---|---|---|---|
| EQUITY & LIABILITIES | ₹ 420.7 Cr | ₹ 545.3 Cr | ₹ 811.1 Cr |
| Net Worth | ₹ 133.7 Cr | ₹ 194.7 Cr | ₹ 317.8 Cr |
| Share Capital | ₹ 164.4 Cr | ₹ 171.0 Cr | ₹ 188.7 Cr |
| Reserves & Surplus | ₹ -30.7 Cr | ₹ 23.7 Cr | ₹ 129.1 Cr |
| Total Liabilities | ₹ 287.0 Cr | ₹ 350.6 Cr | ₹ 493.3 Cr |
| Current Liabilities | ₹ 72.9 Cr | ₹ 97.5 Cr | ₹ 97.7 Cr |
| Borrowings | ₹ 40.0 Cr | ₹ 46.8 Cr | ₹ 36.3 Cr |
| Trade Payables | ₹ 12.5 Cr | ₹ 30.0 Cr | ₹ 34.4 Cr |
| Other Current Liabilities | ₹ 20.4 Cr | ₹ 20.7 Cr | ₹ 27.0 Cr |
| Non-Current Liabilities | ₹ 214.1 Cr | ₹ 253.1 Cr | ₹ 395.6 Cr |
| Borrowings | ₹ 203.5 Cr | ₹ 244.6 Cr | ₹ 388.8 Cr |
| Other Non-Current Liabilities | ₹ 10.6 Cr | ₹ 8.5 Cr | ₹ 6.8 Cr |
| ASSETS | ₹ 420.7 Cr | ₹ 545.2 Cr | ₹ 811.3 Cr |
| Current Assets | ₹ 45.2 Cr | ₹ 73.4 Cr | ₹ 104.3 Cr |
| Trade Receivables | ₹ 16.9 Cr | ₹ 23.4 Cr | ₹ 22.7 Cr |
| Inventory | ₹ 9.0 Cr | ₹ 13.3 Cr | ₹ 16.6 Cr |
| Cash & Cash Equivalents | ₹ 5.0 Cr | ₹ 27.2 Cr | ₹ 54.1 Cr |
| Other Current Assets | ₹ 14.3 Cr | ₹ 9.5 Cr | ₹ 10.9 Cr |
| Non-Current Assets | ₹ 375.5 Cr | ₹ 471.8 Cr | ₹ 707.0 Cr |
| Fixed Assets | ₹ 344.8 Cr | ₹ 412.8 Cr | ₹ 609.4 Cr |
| Other Non-Current Assets | ₹ 30.7 Cr | ₹ 59.0 Cr | ₹ 97.6 Cr |
OBSERVATIONS & INSIGHTS
Total assets increased from INR 420.7 Cr in FY23 to INR 811.2 Cr in FY25, driven primarily by fixed assets/CWIP and other non-current deployment
Long-term borrowings rose by INR 144.3 Cr in FY25 to INR 388.8 Cr even as fresh equity strengthened net worth
FY25 paid-up capital increased through rights and private-placement issuances; reserves also rose because of securities premium, materially expanding shareholders’ wealth
Cash Flow
| Financial Metric | FY 2023 | FY 2024 | FY 2025 |
|---|---|---|---|
CFO (₹ Cr) Cash generated from core business operations. | +59.0 Cr | +87.2 Cr | +52.6 Cr |
CFI (₹ Cr) Cash used for investments and long-term assets. | -25.9 Cr | -90.3 Cr | -218.3 Cr |
CFF (₹ Cr) Cash flow related to funding and borrowings. | -36.3 Cr | +25.3 Cr | +192.6 Cr |
Working Capital
| Efficiency Metric | FY 2023 | FY 2024 | FY 2025 |
|---|---|---|---|
Debtor Days Average number of days taken to collect customer payments. | - | - | - |
Creditor Days Average time taken to pay suppliers and vendors. | - | - | - |
Inventory Days Average number of days inventory remains unsold. | - | - | - |
CCC (Cash Conversion Cycle) (Debtor Days + Inventory Days - Creditor Days) | - | - | - |
Financial Ratios
Measures the company’s leverage relative to shareholder equity.
OBSERVATIONS & INSIGHTS
ROE improved from 12.5% in FY23 to 14.9% in FY24, supported by higher profitability, before declining sharply to 5.9% in FY25
Liquidity improved steadily from 0.6x in FY23 to 0.8x in FY24 and 1.1x in FY25. FY25 is the first year in the period where current assets exceeded current liabilities
Debt-to-equity improved from 1.8x in FY23 to 1.5x in FY24 and 1.3x in FY25
ROA increased from 3.8% in FY23 to 5.1% in FY24, but declined to 2.2% in FY25. Total assets expanded significantly because of Phase III capital expenditure and CWIP
Industry Overview
Industry Drivers
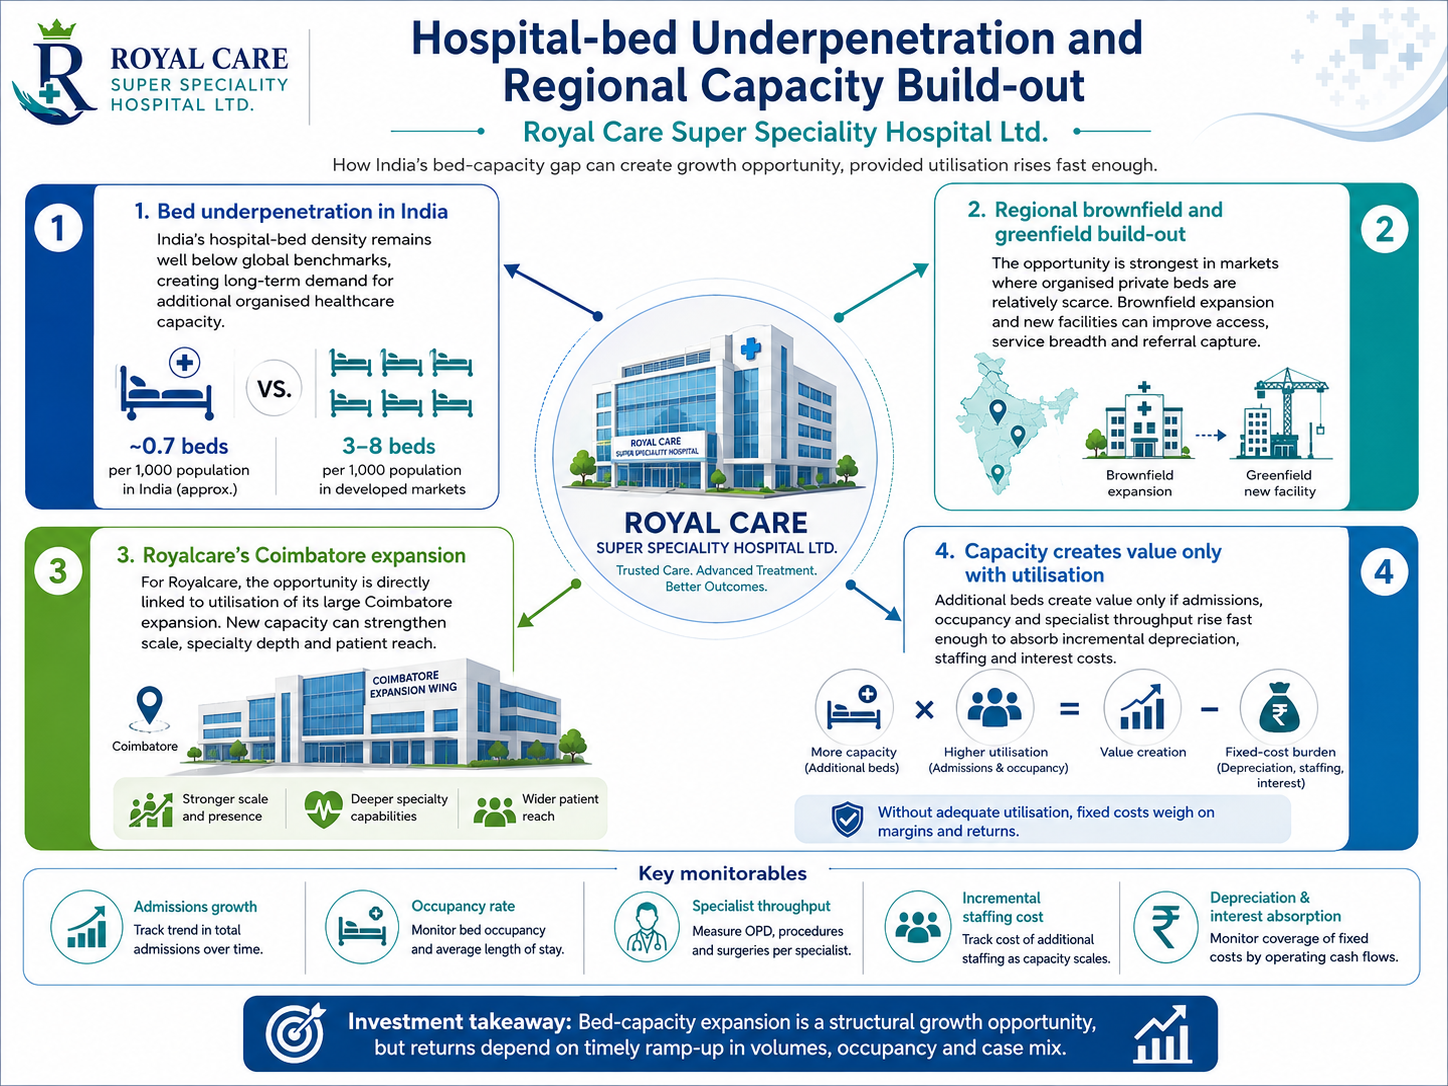
Hospital-bed underpenetration and regional capacity build-out
India’s bed density remains well below global benchmarks
This supports long-run demand for brownfield and greenfield capacity, particularly where organised private beds are scarce
For Royalcare, the opportunity is directly linked to utilisation of its large Coimbatore expansion: additional capacity creates value only if admissions, occupancy and specialist throughput rise fast enough to cover incremental depreciation, staffing and interest
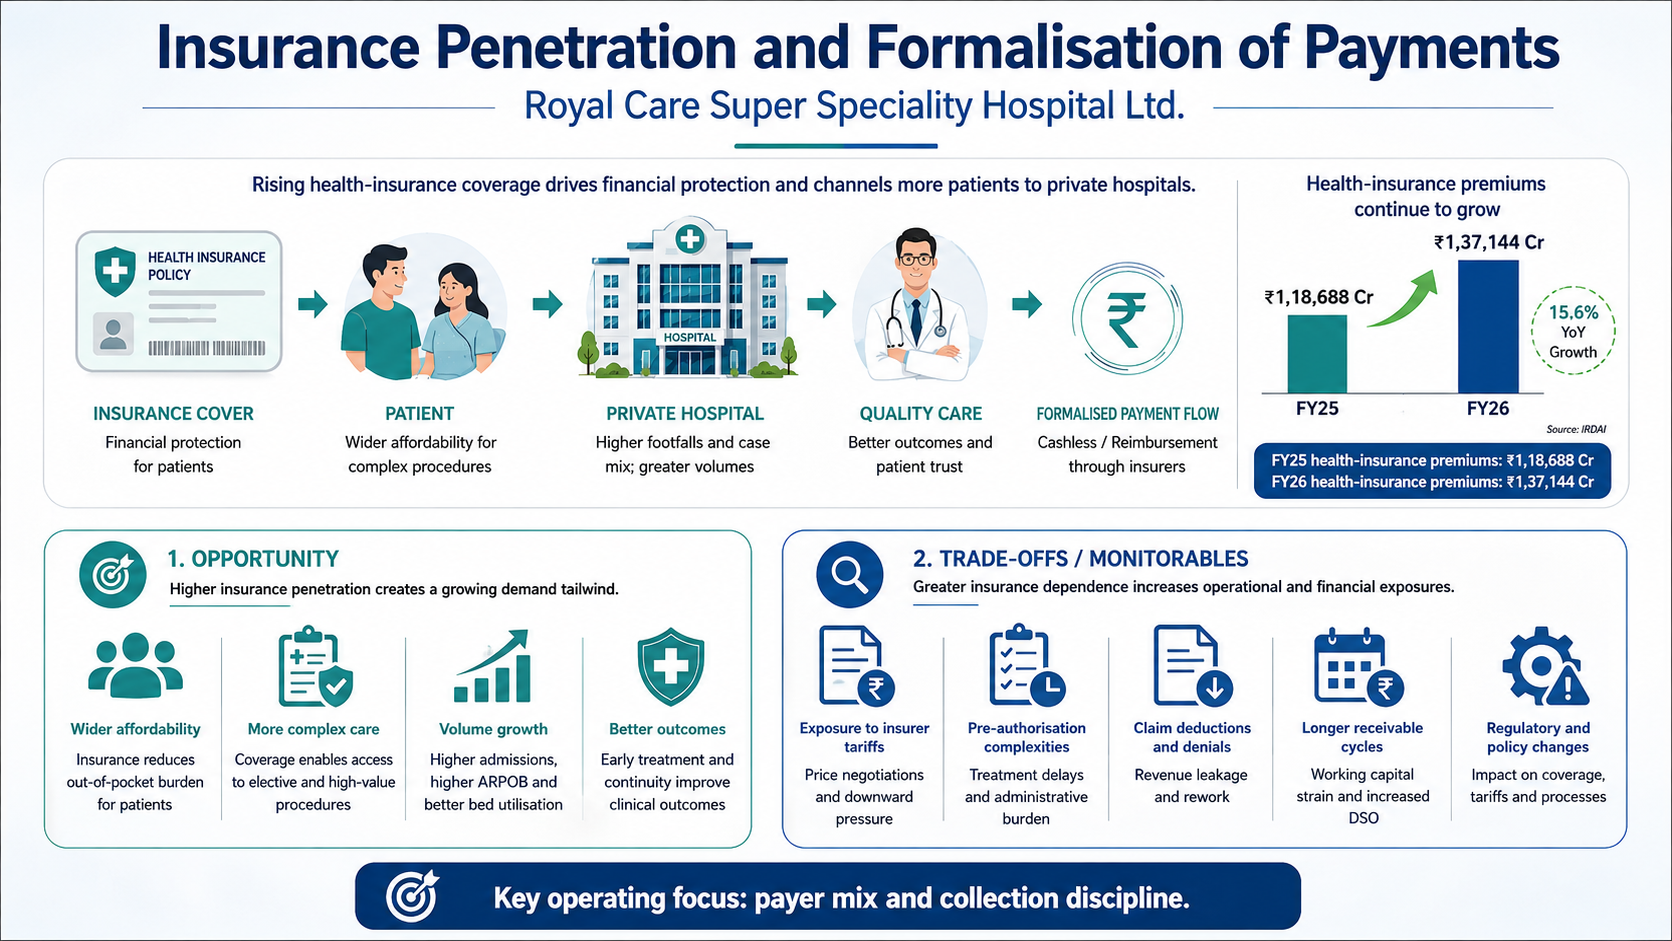
Insurance penetration and formalisation of payments
Health-insurance premiums continue to expand; IBEF reports FY26 health-insurance premiums of about ₹1,37,144 Cr versus ₹1,18,688 Cr in FY25
Higher insurance penetration widens affordability for complex procedures and can raise private-hospital volumes
The trade-off is greater exposure to insurer tariffs, pre-authorisation, claim deductions and receivable cycles, making payer mix and collection discipline important operating metrics
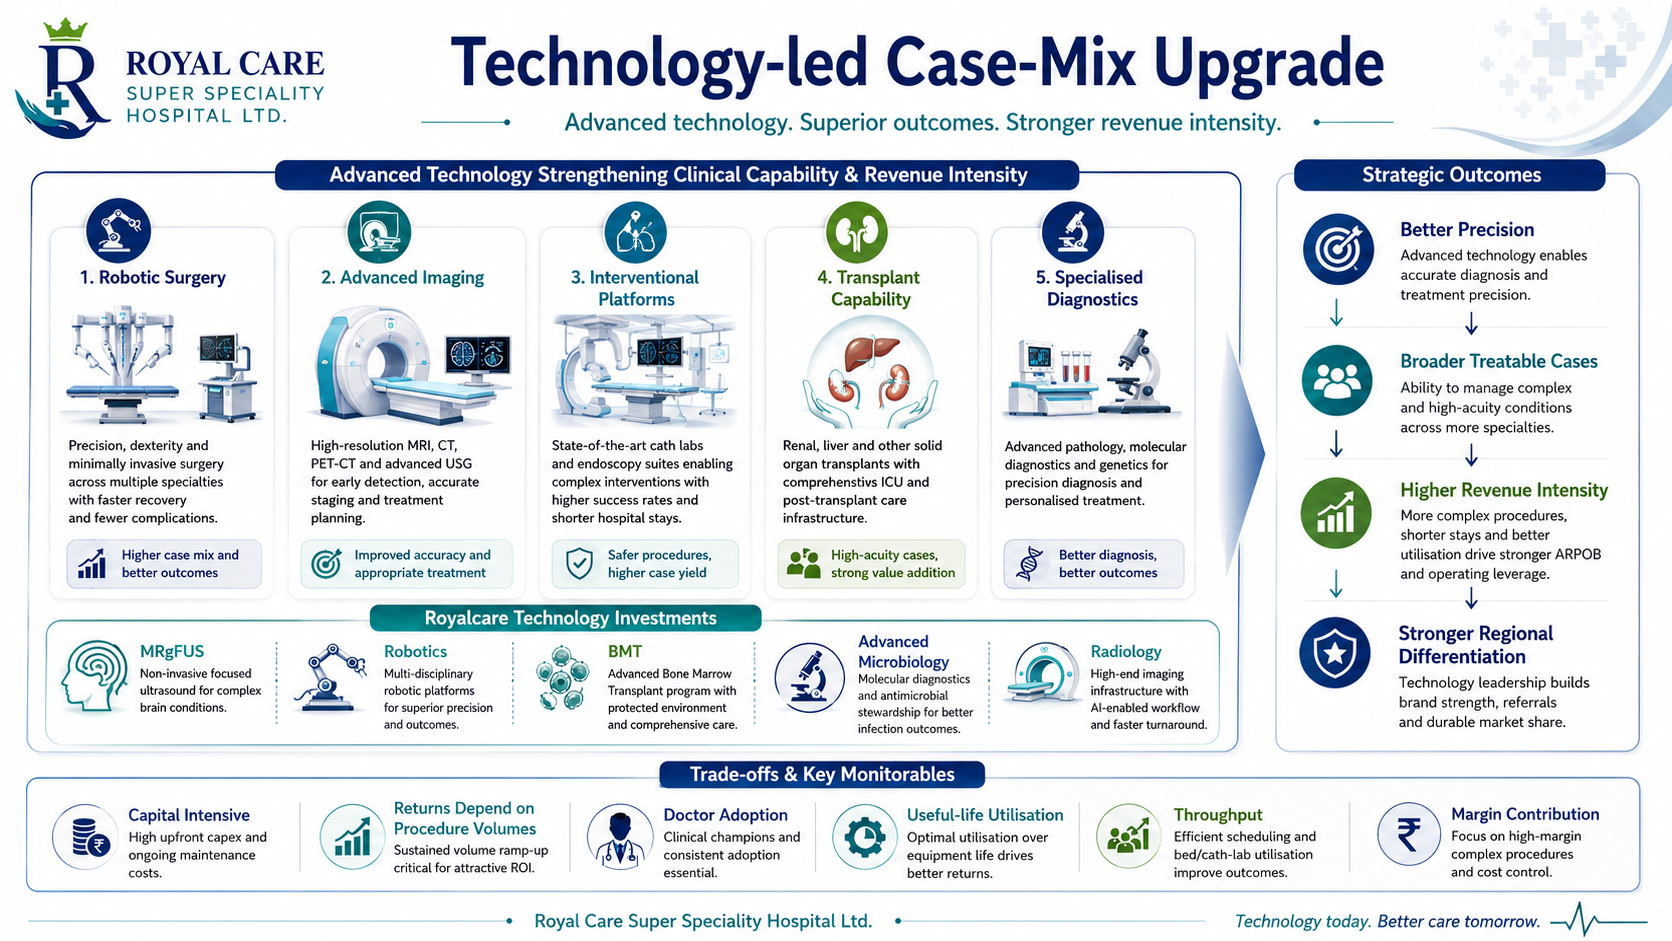
Technology-led case-mix upgrade
Robotic surgery, advanced imaging, interventional platforms, transplant capability and specialised diagnostics can improve precision, expand treatable cases and support higher revenue intensity
They can also create differentiation in regional markets
However, technology is capital intensive: returns depend on procedure volumes, doctor adoption and useful-life utilisation
Royalcare’s MRgFUS, robotics, BMT, advanced microbiology and radiology investments therefore need to translate into measurable throughput and margin contribution
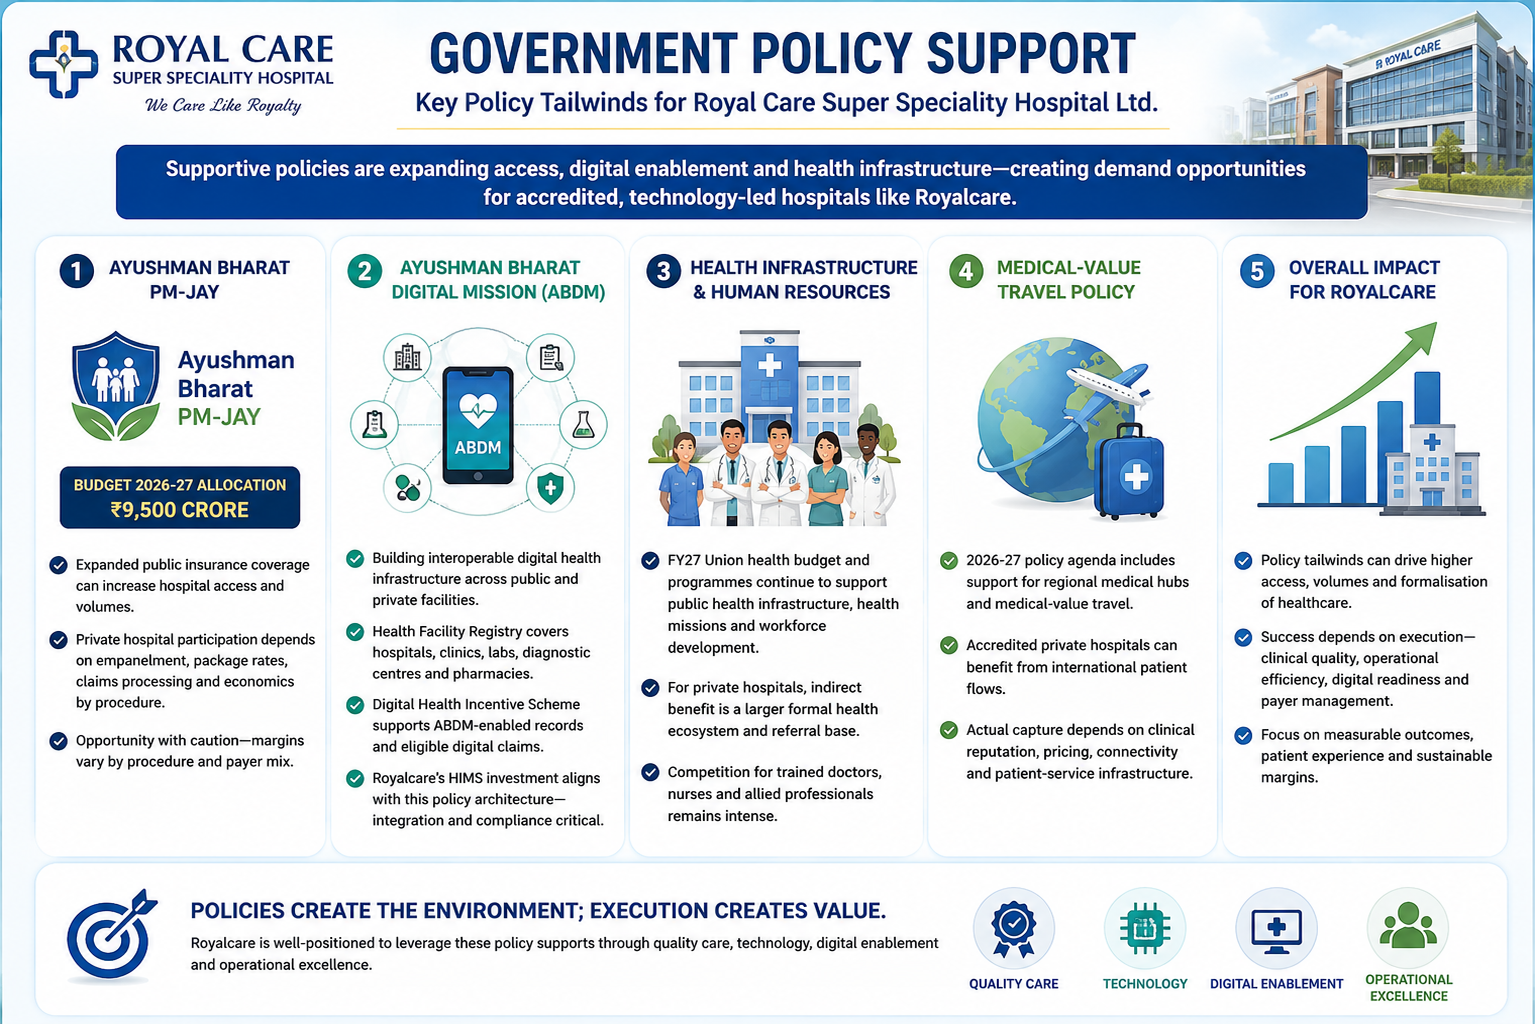
Government Policy Support
Ayushman Bharat - PM-JAY: The Union Budget 2026-27 increased PM-JAY allocation to ₹9,500.0 Cr. Wider public-insurance coverage can expand hospital access and volumes, although private-hospital participation depends on empanelment, package rates, claims processing and economics by procedure
Ayushman Bharat Digital Mission: ABDM is building interoperable registries and digital-health infrastructure across public and private facilities. The Health Facility Registry covers hospitals, clinics, labs, diagnostic centres and pharmacies, while Digital Health Incentive Scheme rules encourage ABDM-enabled records and eligible digital claims. Royalcare’s HIMS investment is directionally aligned with this policy architecture, but integration and compliance must be verified
Health infrastructure and human resources: The FY27 Union health budget and related programmes continue to support public-health infrastructure, health missions and workforce development. For private hospitals, the indirect benefit is a larger formal health ecosystem and referral base, but competition for trained doctors, nurses and allied professionals can remain intense
Medical-value travel policy: The 2026-27 policy agenda includes support for regional medical hubs and medical-value travel. Accredited private hospitals can benefit from international patient flows, but actual capture depends on clinical reputation, pricing, connectivity and patient-service infrastructure
- Overview
- Business
- Financial Highlights
- Industry Overview
- Documentation
Get the Preqt App and keep in touch around the clock!
 Monitor your investments in real-time.
- Receive tailored deal suggestions.
- Get real-time updates and alerts.
