

Runwal Enterprises
Building Better Urban FuturesHomes for Every Aspiration
IPO Summary (PreQT)
Runwal Enterprises Limited is a Mumbai-headquartered integrated real estate developer, with the Runwal brand tracing its legacy to 1978 and the present issuer incorporated in 2016. The Company develops residential projects across affordable, mid-income, premium and luxury segments, alongside commercial, retail and educational developments, with operations concentrated in Mumbai and the broader Mumbai Metropolitan Region (MMR).
As of March 31, 2026, the portfolio comprised 19 completed, 28 ongoing and 33 upcoming projects. In FY26, the Company recorded sales of approximately INR 2,353.5 Cr across 2.07 million sq ft and 2,182 units, while gross collections stood at approximately INR 1,854.6 Cr. JLL ranked Runwal third in Mumbai by both new launches and sales during January 2023–March 2026, with stronger positions in Eastern Suburbs and Kalyan-Dombivli.
The IPO is entirely a fresh issue of 16,393,442 shares at INR 290–305, aggregating INR 475.4–500.0 Cr. Proceeds will primarily fund debt repayment, subsidiary investments and future project acquisitions.
IPO Review Rating
Below Avg
MainboardBuilding Modern Urban Communities Through Scale, Design, and Execution
The strongest aspect is the combination of FY26 profitability, high RoNW and comparatively moderate valuation. FY26 Revenue rebounded to INR 1,799.0 Cr, EBITDA margin reached 19.4% and RoNW improved to 27.2%. At the upper band, the required post-Issue methodology gives an approximately 18.0x P/E, materially below the disclosed listed-peer average.
The principal financial concern is leverage. FY26 D/E remains high at 3.29x, and the Company's earnings profile has been volatile because real-estate Revenue recognition is project-dependent. The IPO partly addresses this directly: approximately INR 325.0 Cr, or 65.0% of the issue, is intended for debt reduction.
The governance profile is supported by 29 years of promoter experience, 50.0% Board independence, zero OFS and 84.6% continuing Promoter + Promoter Group ownership. Litigation and the wider group/related-party structure still require monitoring.
The industry environment is supportive, particularly for branded organised developers in Mumbai, while Runwal possesses meaningful positions in the eastern suburbs and Kalyan-Dombivli. The trade-off is substantial geographic concentration in Mumbai/MMR, leaving the business more exposed to one regional property cycle than diversified national developers.
PARAMETER
WEIGHT
SCORE
KEY FACTORS
Financial Performance
40.0%
3.0/5
Runwal shows improving profitability, strong FY26 margins and high RoNW, but its financial profile remains constrained by volatile revenue recognition and elevated leverage. The IPO-led debt reduction should strengthen the balance sheet, while sustained bookings and cash conversion remain key monitoring variables
Show more
Detailed Analysis
Revenue from operations moved from INR 2,408.9 Cr in FY24 to INR 1,007.8 Cr in FY25 and INR 1,799.0 Cr in FY26. FY24–FY26 CAGR is approximately -13.6%, reflecting highly lumpy real-estate revenue recognition
FY26 EBITDA margin improved materially to 19.4%, versus 17.9% in FY25 and 8.4% in FY24
FY26 net income of approximately INR 250.7 Cr implies a strong 13.9% margin, versus 9.1% in FY25 and 3.1% in FY24
D/E remains elevated at 3.3x, although it improved from 4.6x in FY25
FY26 ROE increased to a strong 27.2%, versus 17.2% in FY25
A comparable FY26 operating-cash-flow figure could not be independently verified from the current RHP-derived public data reviewed
Industry
15.0%
3.0/5
Runwal operates in a healthy organised real-estate market supported by urbanisation, infrastructure and consolidation toward branded developers. Its strong Mumbai micro-market positioning is valuable, but geographic concentration, regulatory approvals, interest-rate sensitivity and cyclical residential demand remain important sector-specific risks
Show more
Detailed Analysis
Indian residential demand remains healthy; Q1 2026 residential sales across major cities increased 8.0% YoY, while premium housing grew substantially faster
Organised real estate remains structurally supported by urbanisation, infrastructure and consolidation toward larger branded developers, although Mumbai is an established market
RERA, approvals, environmental clearances, redevelopment rules, land-title issues and interest-rate sensitivity create meaningful regulatory and execution exposure
Management
15.0%
3.0/5
Runwal benefits from an experienced promoter, 50.0% Board independence and exceptionally high continuing promoter ownership. The absence of an OFS aligns the IPO with capital raising rather than promoter exit, although group complexity, related-party dealings and outstanding litigation require continued monitoring
Show more
Detailed Analysis
Chairman and Managing Director Subodh Subhash Runwal has approximately 29 years of real-estate experience
Three of six Directors are Independent, implying 50.0% Board independence
Offer documents disclose outstanding proceedings involving the Company/promoter-related parties; no material current share-pledge issue was identified in the sources reviewed
The wider Runwal group structure and related entities create continuing related-party monitoring requirements
Valuation
20.0%
4.0/5
Runwal's approximately 18.0x post-Issue P/E is materially below its listed peer set, while FY26 RoNW is strong. Valuation therefore appears relatively attractive, though the discount partly reflects elevated leverage, Mumbai concentration and greater execution risk compared with larger diversified developers
Show more
Detailed Analysis
18.0x post-Issue P/E versus approximately 39.2x simple peer average
Historical FY26 NAV is INR 61.4/share; after fresh capital, the effective post-Issue book-value multiple should moderate materially from the pre-Issue level
FY26 ROE of 27.2% is substantially above most disclosed peers
Merchant Banker Track Record
10.0%
3.0/5
Runwal is backed by two experienced institutional BRLMs with substantial mainboard execution histories. ICICI Securities has delivered several strong 2026 listings, while Jefferies brings large-deal institutional distribution capabilities. Their credentials support execution confidence, although banker history cannot determine individual IPO performance
Show more
Detailed Analysis
Recent mandates across both bankers contain several strong positive listings, although outcomes are not uniformly positive
Both BRLMs have experience managing heavily subscribed institutional mainboard books and large transactions
Majority of the recent observable mandates have achieved positive listing outcomes, with some exceptions
TOTAL
100%
3.2/5
Weighted Composite Score
Issue Price
₹290.0 to ₹305.0
As of 24 Sep 2026
GMP
₹18.0
As of 24 Sep 2026
Estimated Gain / Loss
+5.9%
Lot Size
49.0 Shares
Grey Market Premium (GMPs) are shared for knowledge purpose only. PrEqt doesn’t promote or execute the trades.
| Issue Size (in Cr) | |
|---|---|
| Overall | ₹500.0 Cr |
| Fresh Issue | ₹500.0 Cr |
| Offer for Sale | ₹0.0 Cr |
Minimum Investment
₹14,945.0 / 2,401 shares

Merchant Banker
ICICI Securities Ltd.
ICICI Securities Ltd.
IPO Document
Offer Start Date
Offer End Date
Valuation
Revenue from Operations (FY'26)
PAT (FY'26)
Issue Size (in Cr)
Face Value
₹ 2.0Offer Price
₹ 305.0Lot Size
49.0 sharesSale Type
Fresh capital onlyPAT (FY'26)
₹ 185.8 CrPAT Margin (FY'26)
10.3 %P/E Multiple
18.0xEBITDA (FY'26)
₹ 349.8 CrCAGR Growth 2Y
-13.6 %ROE (FY'26)
27.2 %Price to Book Value
5.0xDebt/Equity
3.3xCompany Website
runwalenterprises.comExplore new deals
Overview
Fund Allocation
Total: ₹0 CrSource:Company DRHP
Timeline
IPO Open Date
To Be Announced
IPO Close Date
To Be Announced
Tentative Allotment
To Be Announced
Initiation of Refunds
To Be Announced
Credit of Shares to Demat
To Be Announced
Tentative Listing Date
To Be Announced
Business
Business Model
Geographical Presence
Sales Channel
Key Risk Factor
Financial Highlights
Income Statement
Revenue growth with EBITDA and PAT margins
| Financial Metric | FY 2024 | FY 2025 | FY 2026 |
|---|---|---|---|
| Revenue (₹ Cr) | 2,408.9 | 1,007.8 | 1,798.9 |
| Growth (%) | - | -58.2% | 78.5% |
| EBITDA (₹ Cr) | 201.7 | 180.1 | 349.8 |
| EBITDA Margin (%) | 8.4% | 17.9% | 19.4% |
| PAT (₹ Cr) | 93.7 | 55.7 | 185.8 |
| PAT Margin (%) | 3.9% | 5.5% | 10.3% |
OBSERVATIONS & INSIGHTS
Revenue from operations fell sharply in FY25 before recovering 78.5% to INR 1,798.9 Cr in FY26, reflecting the timing-sensitive nature of real-estate revenue recognition and project deliveries
EBITDA remained relatively resilient through FY25 and increased to INR 349.8 Cr in FY26; EBITDA margin expanded to 19.4% from 8.4% in FY24
Reported PAT increased to approximately INR 185.8 Cr in FY26 from INR 55.7 Cr in FY25, representing a substantial recovery in profit conversion. FY26 PAT margin on revenue from operations was approximately 10.3%, compared with approximately 5.5% in FY25 and 3.9% in FY24
Balance Sheet
| Financial Metric | FY 2024 | FY 2025 | FY 2026 |
|---|---|---|---|
| Net Worth | ₹ 372.7 Cr | ₹ 455.9 Cr | ₹ 768.2 Cr |
| Total Assets | ₹ 7,079.7 Cr | ₹ 8,328.1 Cr | ₹ 10,254.5 Cr |
| Total Borrowing | ₹ 1,783.7 Cr | ₹ 2,312.6 Cr | ₹ 2,909.1 Cr |
| Reserves & Surplus | ₹ 426.1 Cr | ₹ 460.1 Cr | ₹ 819.8 Cr |
OBSERVATIONS & INSIGHTS
Asset growth: Total assets increased from INR 7,079.7 Cr in FY24 to INR 10,254.5 Cr in FY26, reflecting the expansion of the development pipeline and project investment
Borrowings: Total borrowings increased from INR 1,783.7 Cr in FY24 to INR 2,909.1 Cr in FY26, underscoring the capital-intensive nature of the business
Net worth: Net worth more than doubled between FY24 and FY26 to INR 768.2 Cr, supporting the improvement in leverage from the FY25 peak, although absolute debt remains high
Cash Flow
| Financial Metric | FY 2024 | FY 2025 | FY 2026 |
|---|---|---|---|
CFO (₹ Cr) Cash generated from core business operations. | -549.5 Cr | -198.1 Cr | -180.7 Cr |
CFF (₹ Cr) Cash flow related to funding and borrowings. | +251.5 Cr | -167.7 Cr | -212.2 Cr |
CFI (₹ Cr) Cash used for investments and long-term assets. | +351.8 Cr | +309.8 Cr | +496.0 Cr |
Financial Ratios
Measures the company’s leverage relative to shareholder equity.
OBSERVATIONS & INSIGHTS
The RHP-derived return on net worth improved to 27.2% in FY26 after 17.2% in FY25, supported by the recovery in earnings
Debt/equity remained elevated but improved to 3.3x in FY26 from 4.6x in FY25 as equity increased faster than debt
ROA was approximately 1.3% in FY24, 0.7% in FY25 and 1.8% in FY26, reflecting the large asset base required for real-estate development
Interest Coverage, Current Ratio, ROCE shown as N.A. because the directly accessible current RHP extracts available for this report did not provide a sufficiently verified three-year series for the exact components
Industry Overview
Industry Drivers
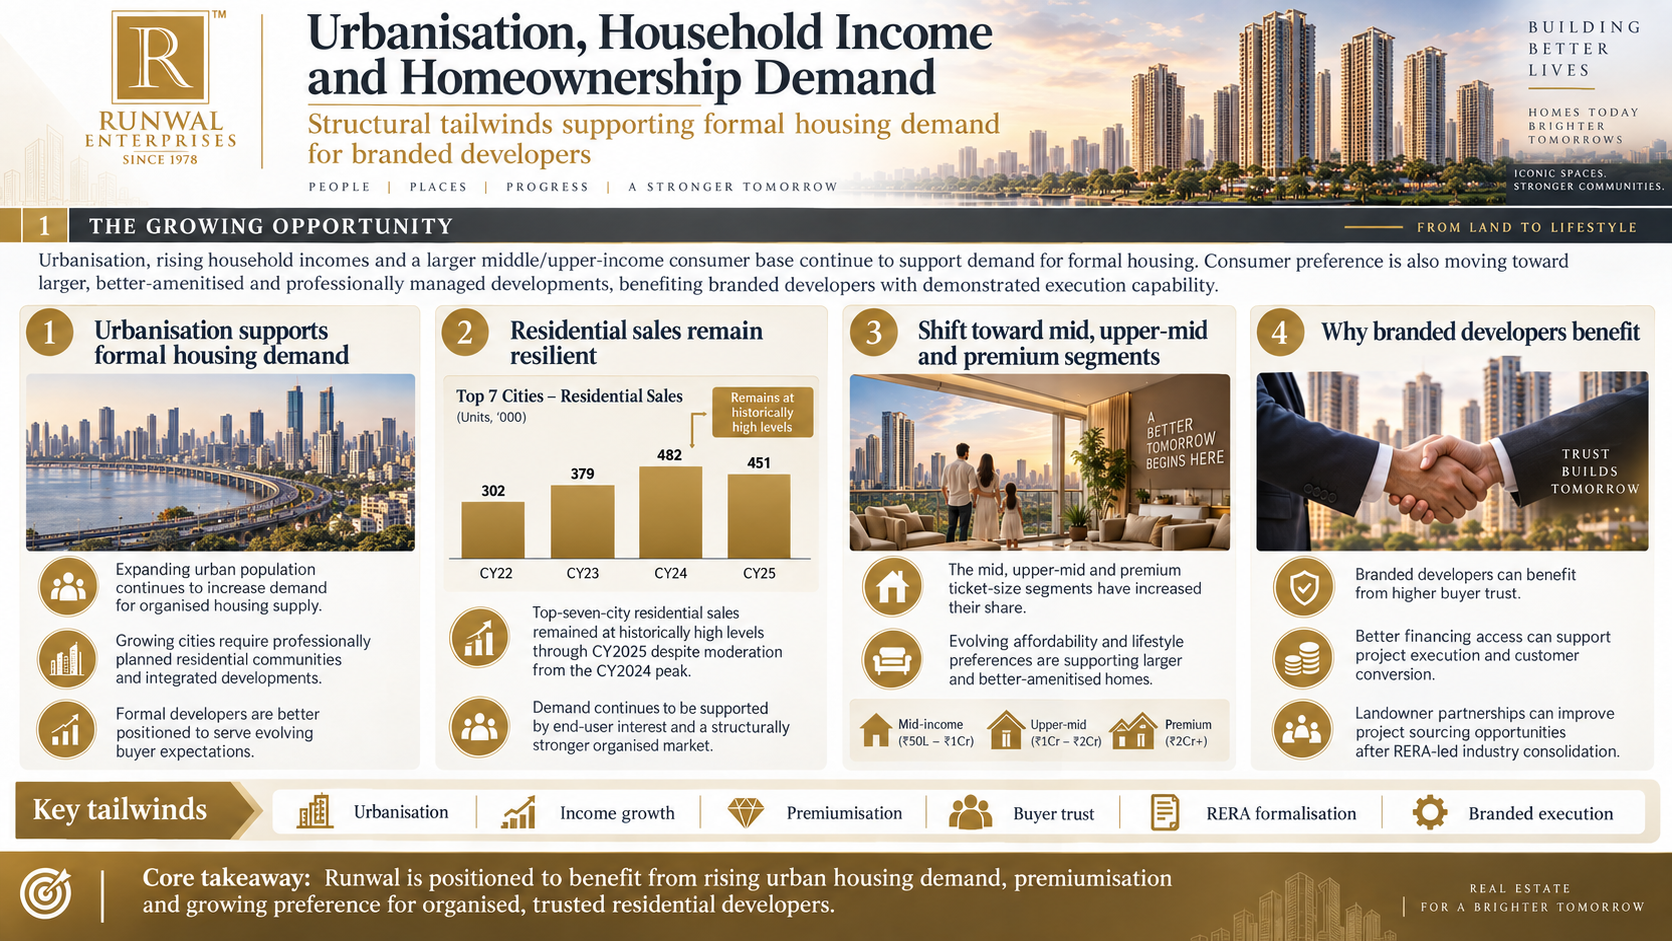
Urbanisation, Household Income and Homeownership Demand
Urbanisation, rising household incomes and a larger middle/upper-income consumer base continue to support demand for formal housing. Consumer preference is also moving toward larger, better-amenitised and professionally managed developments, benefiting branded developers with demonstrated execution capability.
The key points are:
Top-seven-city residential sales remained at historically high levels through CY2025 despite moderation from the CY2024 peak
The mid, upper-mid and premium ticket-size segments have increased their share as affordability and lifestyle preferences evolve
Branded developers can benefit from higher buyer trust, financing access and landowner partnerships after RERA-led industry consolidation
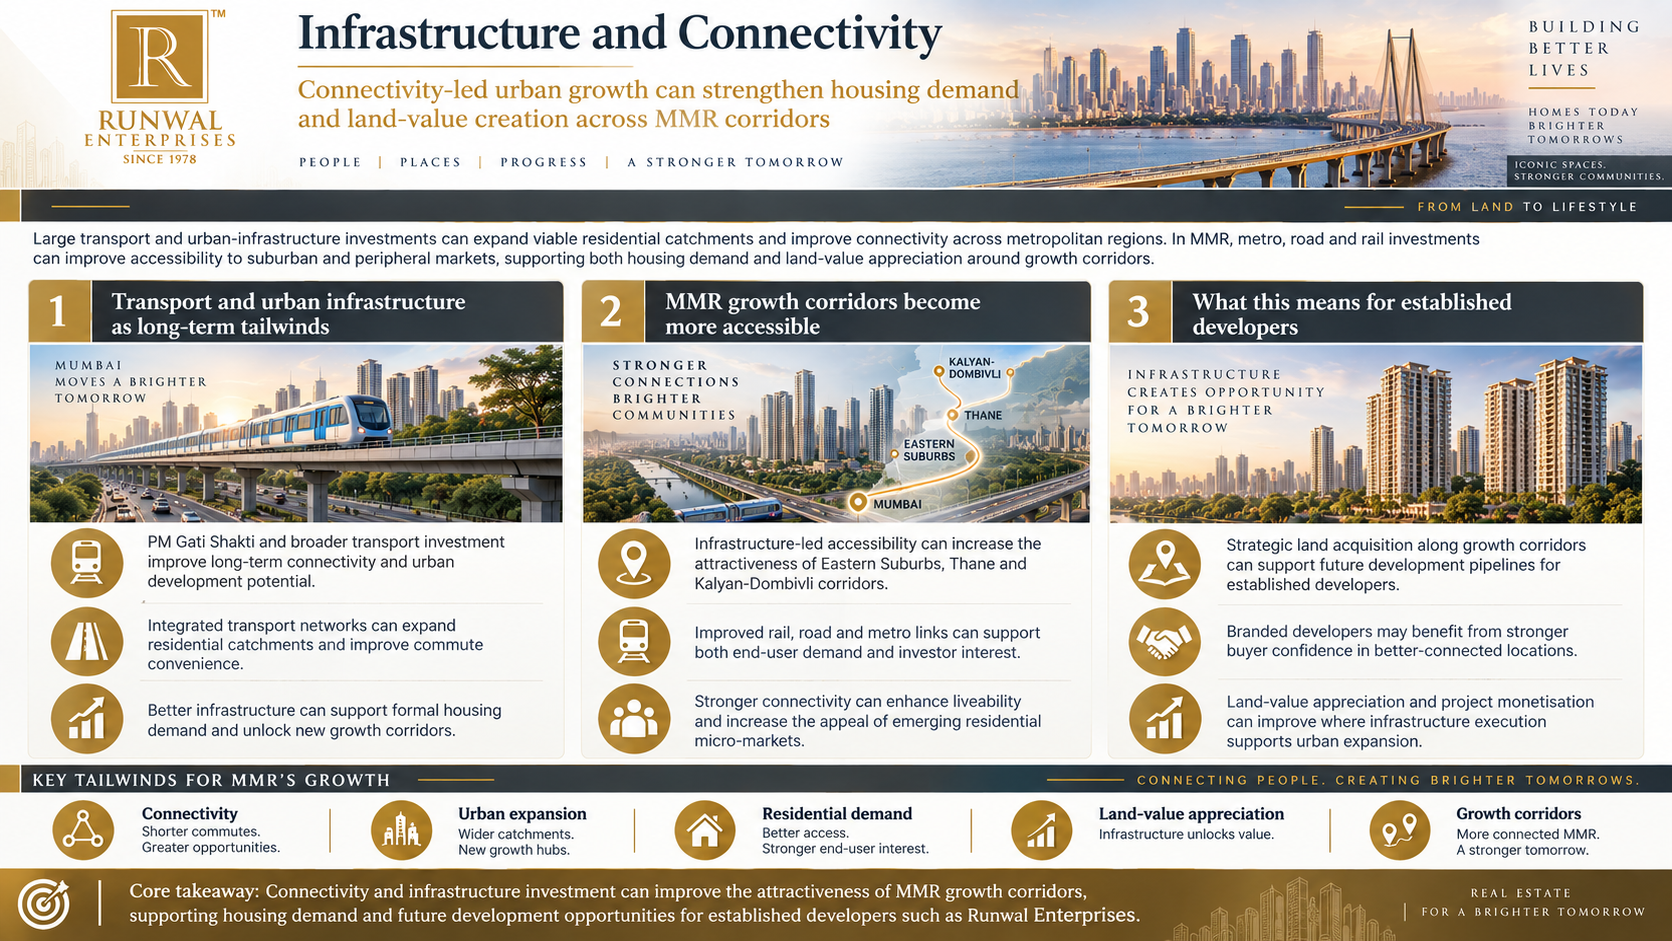
Infrastructure and Connectivity
Large transport and urban-infrastructure investments can expand viable residential catchments and improve connectivity across metropolitan regions. In MMR, metro, road and rail investments can improve accessibility to suburban and peripheral markets, supporting both housing demand and land-value appreciation around growth corridors.
The key points are:
PM Gati Shakti and broader transport investment improve long-term connectivity and urban development potential
Infrastructure-led accessibility can increase the attractiveness of Eastern Suburbs, Thane and Kalyan-Dombivli corridors
Strategic land acquisition along growth corridors can support future development pipelines for established developers
Premiumisation and Institutionalisation
Premium and luxury housing has gained share as affluent households seek differentiated design, amenities and community infrastructure. Institutional capital is also increasingly partnering with established developers. JLL recorded more than USD 10.5 billion of institutional real-estate investment across 78 deals in CY2025, the highest level on record in its series.
The key points are:
Premium projects can command higher selling prices when location, design and execution quality are differentiated
Institutional investors increasingly prefer development partnerships with selected reputed developers
The shift toward branded developers can support consolidation and improve access to capital and land opportunities

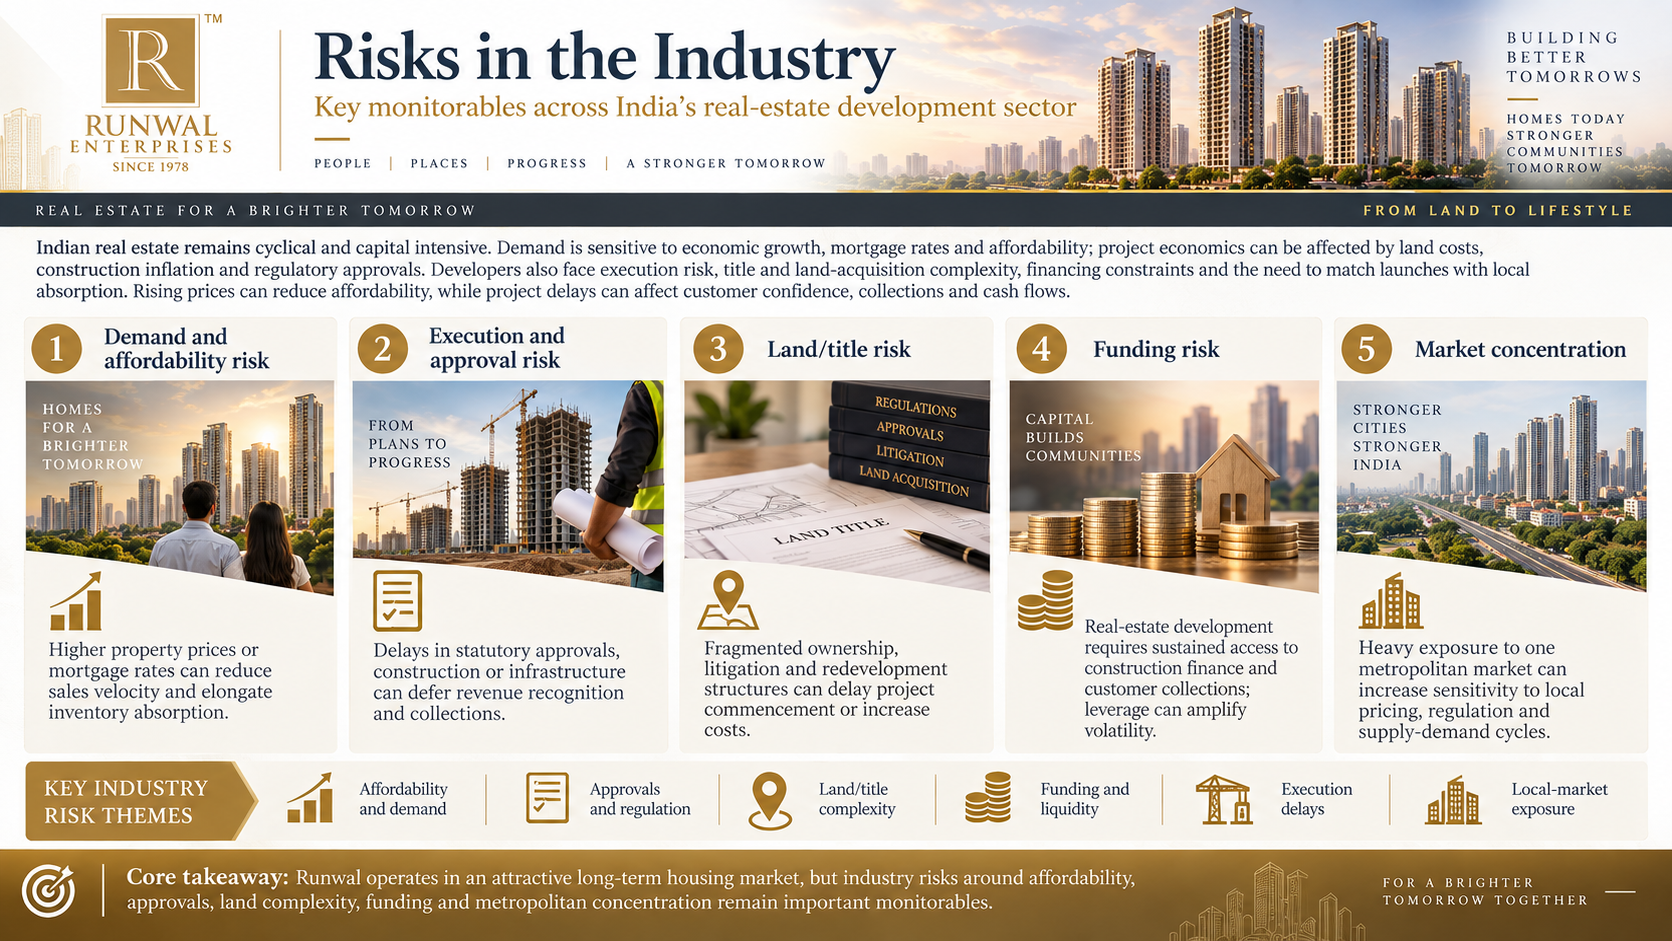
Risks in the Industry
Indian real estate remains cyclical and capital intensive. Demand is sensitive to economic growth, mortgage rates and affordability; project economics can be affected by land costs, construction inflation and regulatory approvals. Developers also face execution risk, title and land-acquisition complexity, financing constraints and the need to match launches with local absorption. Rising prices can reduce affordability, while project delays can affect customer confidence, collections and cash flows.
The key risks are:
Demand and affordability risk: Higher property prices or mortgage rates can reduce sales velocity and elongate inventory absorption
Execution and approval risk: Delays in statutory approvals, construction or infrastructure can defer revenue recognition and collections
Land/title risk: Fragmented ownership, litigation and redevelopment structures can delay project commencement or increase costs
Funding risk: Real-estate development requires sustained access to construction finance and customer collections; leverage can amplify volatility
Market concentration: Heavy exposure to one metropolitan market can increase sensitivity to local pricing, regulation and supply-demand cycles
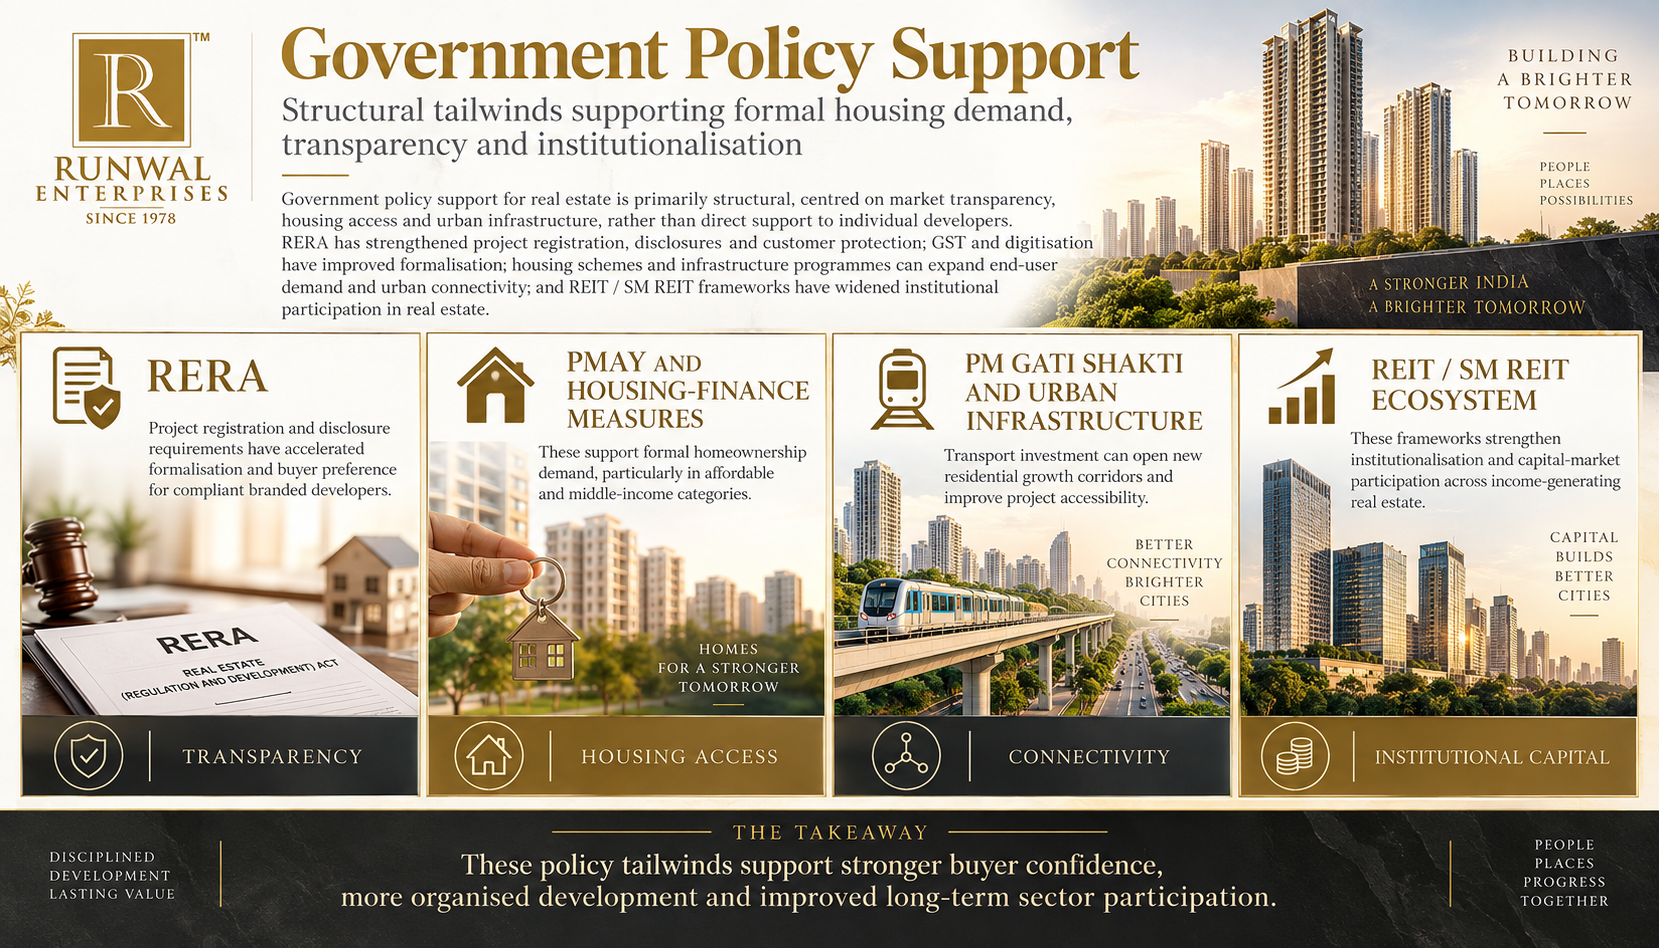
Government Policy Support
Policy support is primarily structural, centred on market transparency, housing access and urban infrastructure rather than direct support to individual developers. RERA has strengthened project registration, disclosures and customer protection; GST and digitisation have improved formalisation; housing schemes and infrastructure programmes can expand end-user demand and urban connectivity. REIT and SM REIT frameworks have also widened institutional participation in real estate.
The key policies are:
RERA: Project registration and disclosure requirements have accelerated formalisation and buyer preference for compliant branded developers
PMAY and housing-finance measures: Support formal homeownership demand, particularly in affordable and middle-income categories
PM Gati Shakti and urban infrastructure: Transport investment can open new residential growth corridors and improve project accessibility
REIT / SM REIT ecosystem: Strengthens institutionalisation and capital-market participation across income-generating real estate
Fundraise/Future Plans
Shareholding
Pre-issue shareholding
Promoter Holding 0.0%
Post-Issue Shareholding
Promoter Holding 0.0%
Category
Pre-Issue%Post-Issue%
Promoters
Subodh Subhash Runwal
80.9%71.9%
Subhash Suganlal Runwal
7.6%6.8%
Chanda Subhash Runwal
6.7%5.9%
Total Promoter Holding
95.2%84.6%
Additional Shareholders
Other Shareholders
4.8%15.4%
Total Additional Holding
4.8%15.4%
Total Shareholding
100.0%100.0%
- Overview
- Business
- Financial Highlights
- Industry Overview
- Fundraise/Future Plans
- Documentation
Get the Preqt App and keep in touch around the clock!
 Monitor your investments in real-time.
- Receive tailored deal suggestions.
- Get real-time updates and alerts.
